1 target capital for gi firms june 20, 2007 ian hinder, fia – kpmg llp allan kaufman, fcas – amk...
TRANSCRIPT
1
Target Capital Target Capital for GI Firmsfor GI Firms
June 20, 2007June 20, 2007Ian Hinder, FIA – KPMG LLPIan Hinder, FIA – KPMG LLP
Allan Kaufman, FCAS – AMK ConsultingAllan Kaufman, FCAS – AMK Consulting Dan Dan MagnoliaMagnolia

2
Working party Working party membersmembers
A Hitchcox (Chair) - KILNA Hitchcox (Chair) - KILN
I HinderI Hinder – KPMG – KPMG
A Kaufman – AMK ConsultingA Kaufman – AMK Consulting
T Maynard – Lloyd’sT Maynard – Lloyd’s
A Smith - DeloitteA Smith - Deloitte
M White – EquitasM White – Equitashttp://www.actuaries.org.uk/files/pdf/sessional/sm2http://www.actuaries.org.uk/files/pdf/sessional/sm20061127.pdf0061127.pdf

3
Three questionsThree questions
1)How much capital should the firm hold?
2) What rate of return is required?
3) How should the firm assess performance targets?

4
Need to consider a Need to consider a blend ofblend of
1)Insurance risk considerations• “Inside the firm”• How much capital is needed to back
insurance business• Premium rates to charge to achieve an
adequate return given risks (volatility)
And…

5
Need to consider a Need to consider a blend ofblend of
2) Financial markets views of risk • “Outside the firm”• How will this investment affect the risk of my
overall portfolio• Is the expected return on the shares
sufficient to compensate for the risk

6
1)How much capital should the firm hold?

7
How much capital?How much capital?
• European MCR – approx 18% premium
Old rules of thumb:• Short tail & low volatility: 40% premium• long tail or commercial lines: 60% premium• London Market/ reinsurance firms: 75% premium
8
Increasing capital…Increasing capital…
For• Better credit rating
– more profitable business– Discount profit stream at a lower rate –
higher NPV
Against• Lower leverage – lower ROE• Increase in double taxation

9
Reducing capital…Reducing capital…
ForFor• More leverage – higher ROEMore leverage – higher ROE• Reduce in double taxationReduce in double taxation
AgainstAgainst• Lower credit ratingLower credit rating
– less profitable business– Discount profit stream at a higher rate –
lower NPV
10
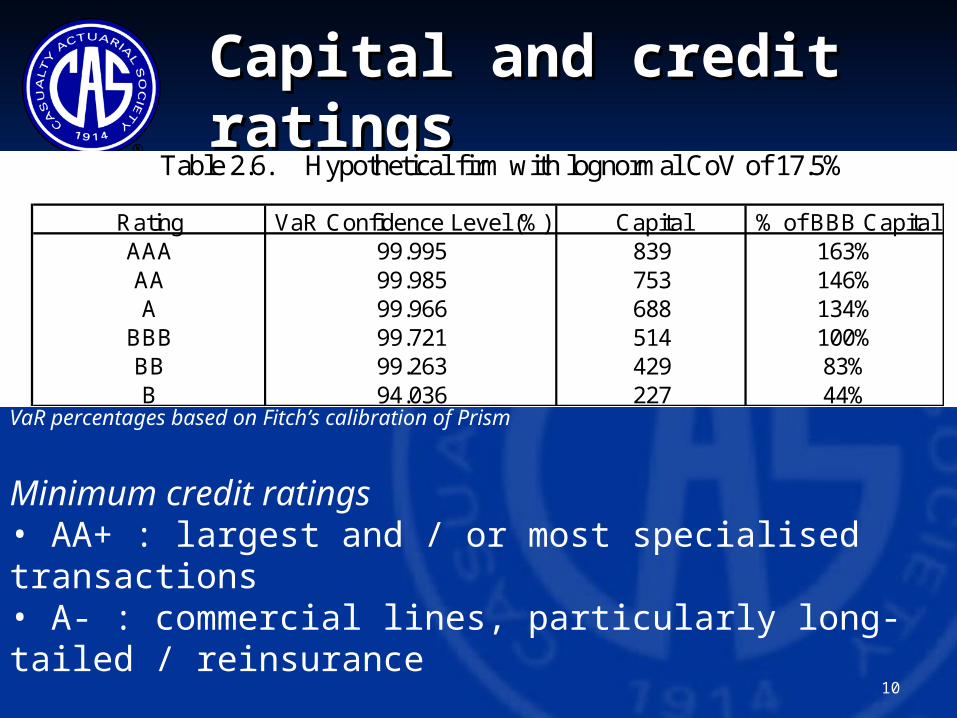
Capital and credit Capital and credit ratingsratings
VaR percentages based on Fitch’s calibration of Prism
Minimum credit ratings• AA+ : largest and / or most specialised transactions• A- : commercial lines, particularly long-tailed / reinsurance
• < A-: customers will leave and market share will decline
Table 2.6. Hypothetical firm with lognormal CoV of 17.5%
Rating VaR Confidence Level (%) Capital % of BBB CapitalAAA 99.995 839 163%AA 99.985 753 146%A 99.966 688 134%
BBB 99.721 514 100%BB 99.263 429 83%B 94.036 227 44%
11
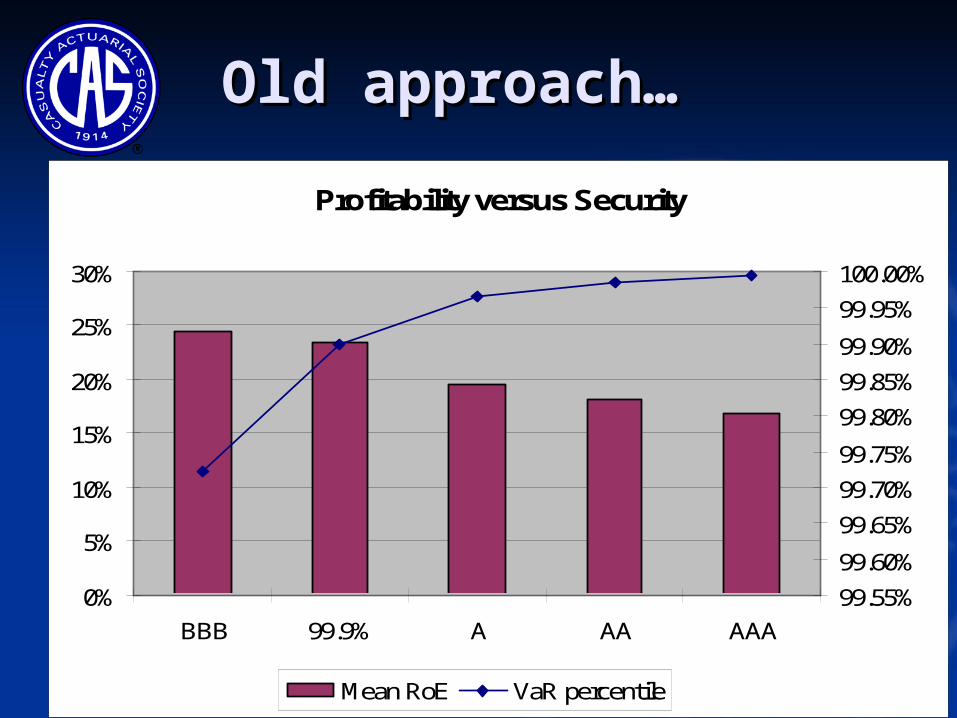
Profitability versus Security
0%
5%
10%
15%
20%
25%
30%
BBB 99.9% A AA AAA
99.55%
99.60%
99.65%
99.70%
99.75%
99.80%
99.85%
99.90%
99.95%
100.00%
Mean RoE VaR percentile
Old approach…Old approach…
12
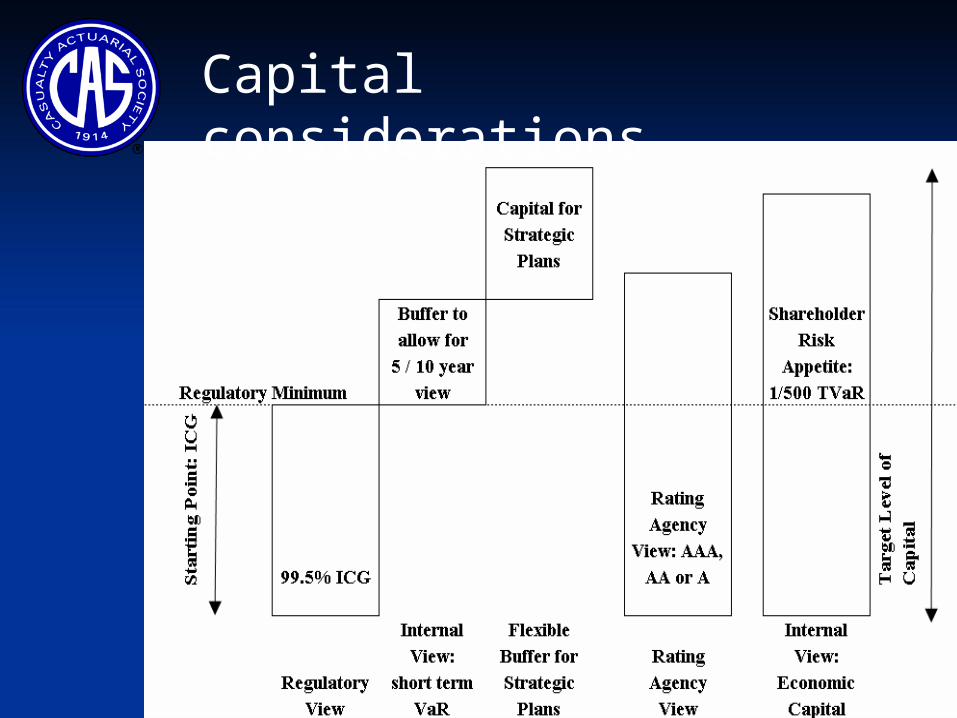
Capital considerations

13
New thinkingNew thinking
Fra
nch
ise
valu
e
Franchise value = market capitalisation - capital
• Hold capital held to maximise franchise value
14
How much capital?How much capital?• Management need to be able to articulate
decision to:– Regulators– Shareholders– Rating agents
• Traditional approach – maximise expected return subject to acceptable level of risk
• Financial economist – maximise franchise value• Need consideration of both approaches

15
2) What rate of return is required?

16
Cost of capitalCost of capital
• External studies of Cost of Capital tend to look External studies of Cost of Capital tend to look at TSR – based on market capitalisationat TSR – based on market capitalisation
• Market value different to capital in firmMarket value different to capital in firmMarket value = capital + franchise valueMarket value = capital + franchise value
• Cost of capital is not the same as Return on Cost of capital is not the same as Return on EquityEquity
• Can’t use external cost of capital directly to Can’t use external cost of capital directly to set performance targetsset performance targets
17
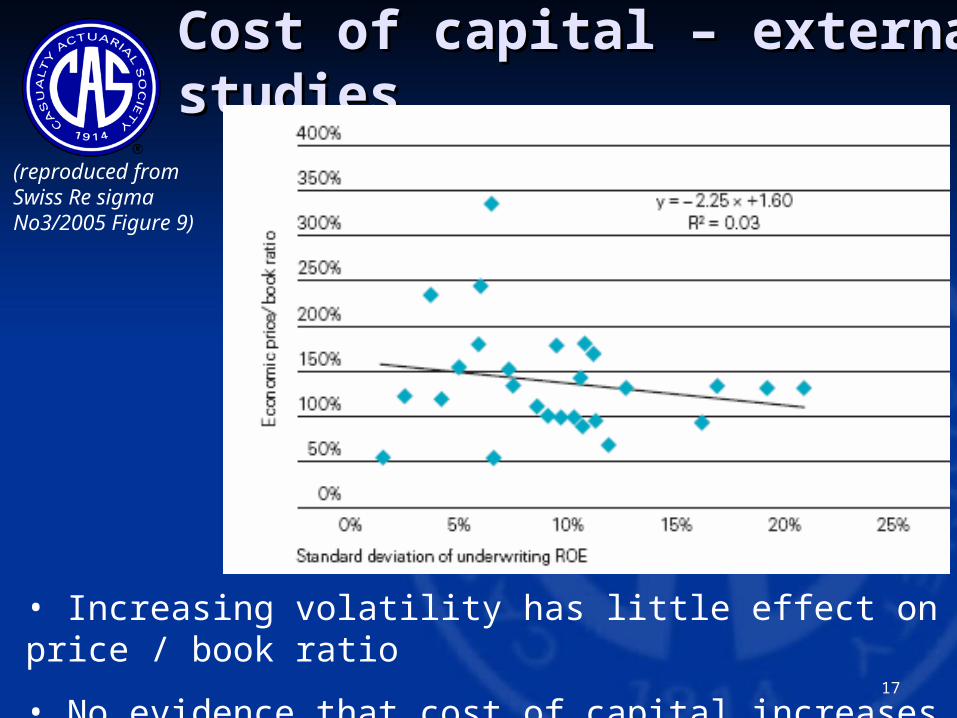
Cost of capital – external Cost of capital – external studiesstudies
(reproduced from Swiss Re sigma No3/2005 Figure 9)
• Increasing volatility has little effect on price / book ratio
• No evidence that cost of capital increases with volatility
18
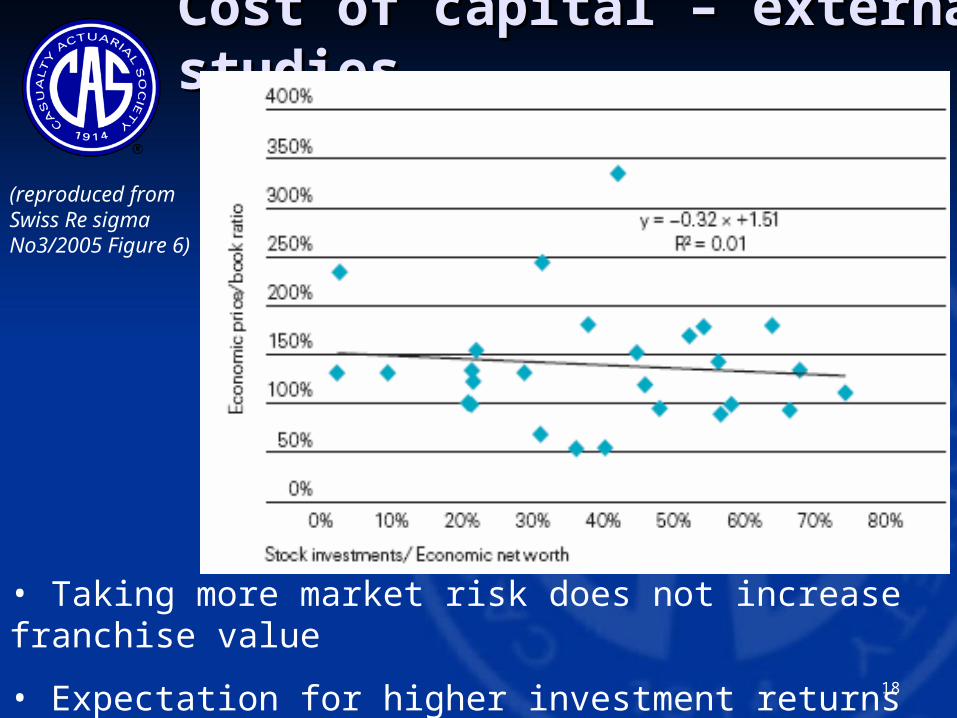
Cost of capital – external Cost of capital – external studiesstudies
(reproduced from Swiss Re sigma No3/2005 Figure 6)
• Taking more market risk does not increase franchise value
• Expectation for higher investment returns is countered by increase in target return
19
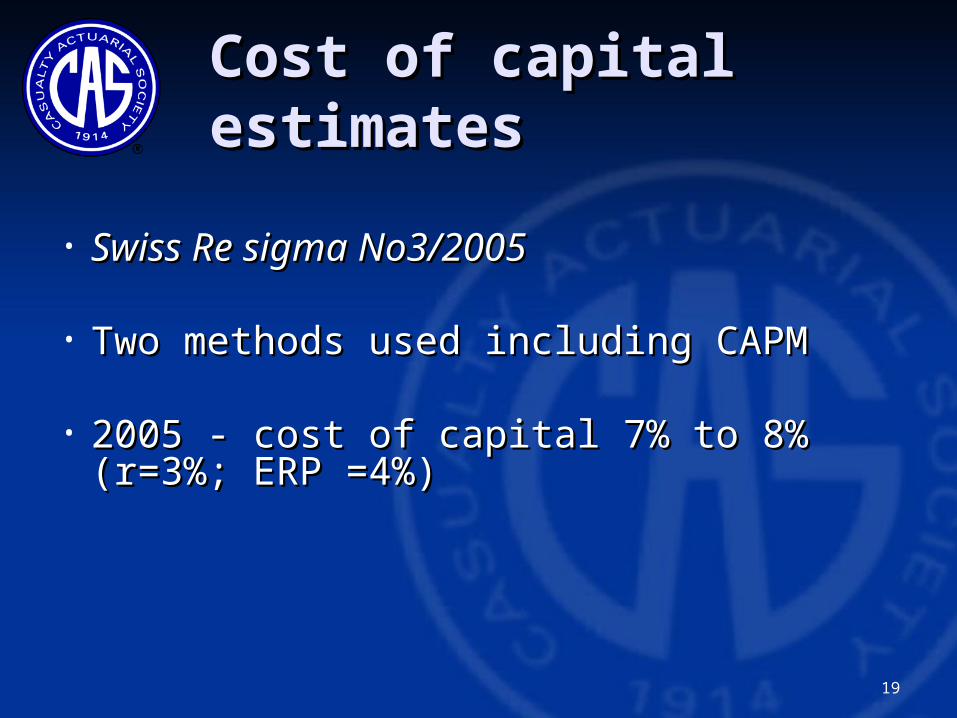
Cost of capital Cost of capital estimatesestimates
• Swiss Re sigma No3/2005Swiss Re sigma No3/2005
• Two methods used including CAPM Two methods used including CAPM
• 2005 - cost of capital 7% to 8% (r=3%; ERP =4%)2005 - cost of capital 7% to 8% (r=3%; ERP =4%)

20
Cummins and Cummins and PhillipsPhillips
Use firm wide beta estimates and full-Use firm wide beta estimates and full-information beta to estimate CoC by line of information beta to estimate CoC by line of businessbusiness
Favour Fama-French methodology – gives Favour Fama-French methodology – gives significantly higher CoC estimates than CAPMsignificantly higher CoC estimates than CAPM
Large variations by line of businessLarge variations by line of business
See session C1 at 11amSee session C1 at 11am
21
3) Turning cost of capital into 3) Turning cost of capital into performance targets…performance targets…
22
BackgroundBackground
1.1. An object continues in motion An object continues in motion unless acted on by an outside force.unless acted on by an outside force.
2.2. Have you ever met an object not Have you ever met an object not subject to outside forces?subject to outside forces?
3.3. Statement #1 useful nonetheless.Statement #1 useful nonetheless.
23
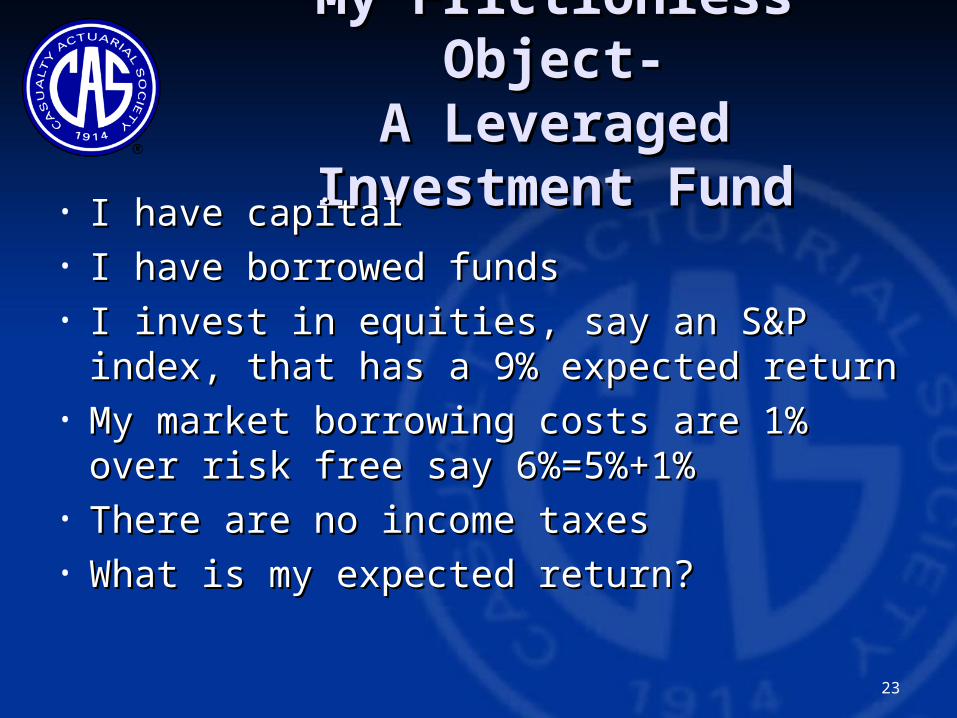
My Frictionless My Frictionless Object-Object-
A Leveraged A Leveraged Investment FundInvestment Fund
• I have capitalI have capital• I have borrowed fundsI have borrowed funds• I invest in equities, say an S&P I invest in equities, say an S&P
index, that has a 9% expected returnindex, that has a 9% expected return• My market borrowing costs are 1% My market borrowing costs are 1%
over risk free say 6%=5%+1%over risk free say 6%=5%+1%• There are no income taxesThere are no income taxes• What is my expected return?What is my expected return?
24
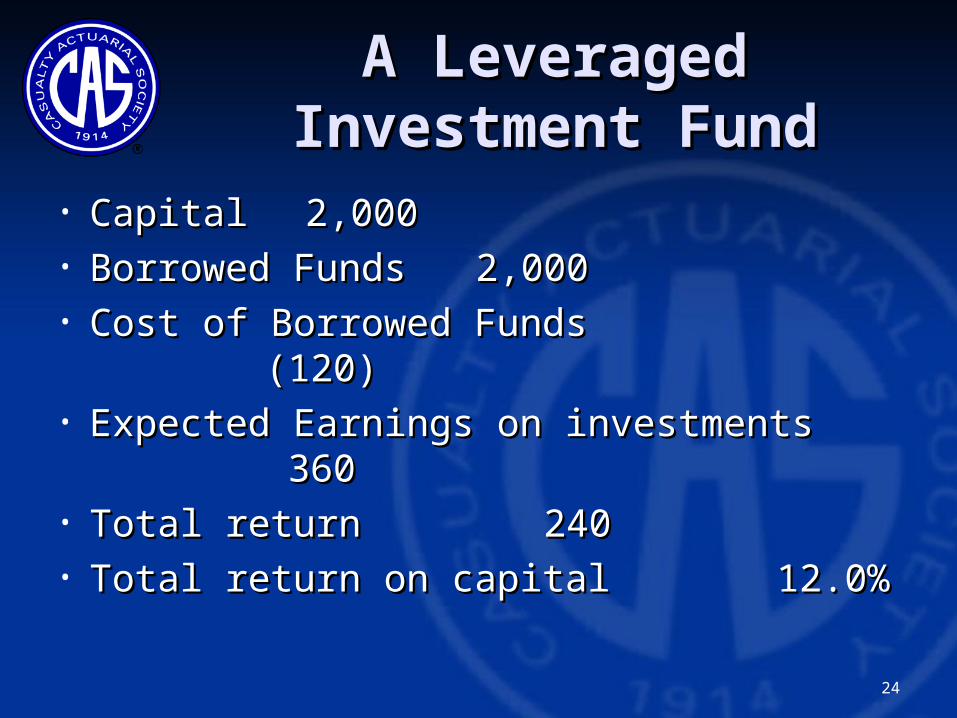
A Leveraged A Leveraged Investment FundInvestment Fund
• CapitalCapital 2,000 2,000• Borrowed FundsBorrowed Funds 2,000 2,000• Cost of Borrowed FundsCost of Borrowed Funds
(120)(120)• Expected Earnings on investments Expected Earnings on investments
360 360• Total returnTotal return 240 240• Total return on capitalTotal return on capital
12.0%12.0%

25
Frictionless Frictionless Insurance Insurance EnterpriseEnterprise
CapitalCapital 2,002,0000
Borrowed Funds-aka reservesBorrowed Funds-aka reserves 2,002,0000
Cost of Borrowed fundsCost of Borrowed funds xx
Expected earnings on Expected earnings on investmentsinvestments
360360
Total ReturnTotal Return 240240
Total return % CapitalTotal return % Capital 12%12%
No constraint on removing capital!!!No constraint on removing capital!!!
Back-solve so cost of borrowed funds is (120) or -Back-solve so cost of borrowed funds is (120) or -6% of reserves. Implies a 105% UW target, 6% of reserves. Implies a 105% UW target, undiscounted, if premium=2,500.undiscounted, if premium=2,500.

26
Frictionless Frictionless Insurance Insurance EnterpriseEnterprise
CapitalCapital 2,002,0000
2,0002,000
Borrowed Funds-aka reservesBorrowed Funds-aka reserves 2,002,0000
2,0002,000
Cost of Borrowed fundsCost of Borrowed funds xx (120)(120)
Expected earnings on Expected earnings on investmentsinvestments
360360
360360
Total ReturnTotal Return 240240
240240
Total return % CapitalTotal return % Capital 12%12%
12%12%
No constraint on removing capital!!!No constraint on removing capital!!!
Back-solve so cost of borrowed funds is (120) or -Back-solve so cost of borrowed funds is (120) or -6% of reserves. Implies a 105% UW target, 6% of reserves. Implies a 105% UW target, undiscounted, if premium=2,500.undiscounted, if premium=2,500.

27
Frictionless Frictionless Insurance Insurance
Enterprise – No Enterprise – No LeverageLeverageCapital in:Capital in:
StocStocksks
BondBondss
CapitalCapital 2,002,0000
2,002,0000
Reserves discounted. No Reserves discounted. No investor returninvestor return
00 00
Cost of Borrowed fundsCost of Borrowed funds 00 00
Expected earnings on Expected earnings on investmentsinvestments
180180 100100
Total ReturnTotal Return 180180 5%5%
Total return % CapitalTotal return % Capital 9%9% 5%5%No constraint on removing capital!!!No constraint on removing capital!!!UW target LR is 100% on discounted basis.UW target LR is 100% on discounted basis.

28
Sources of Sources of Insurance FrictionInsurance Friction
• Double taxation (A)Double taxation (A)• Market value > book value (B)Market value > book value (B)• Financial distress cost (C)Financial distress cost (C)• Agency risk cost (D)Agency risk cost (D)• Regulatory costs (E)Regulatory costs (E)
– PlusPlus• We need to consider whether borrowed We need to consider whether borrowed
funds and reserves have same effect on funds and reserves have same effect on CoC (F).CoC (F).

29
Base AssumptionsBase Assumptions
• Capital 2,000Capital 2,000• Taxes at 30%Taxes at 30%• Stocks expected to earn 9%Stocks expected to earn 9%• Risk free bonds expected to earn 5%Risk free bonds expected to earn 5%• Premium 2,500 if capital in stock; Premium 2,500 if capital in stock; • Premium 3,000 if capital in bondsPremium 3,000 if capital in bonds
30
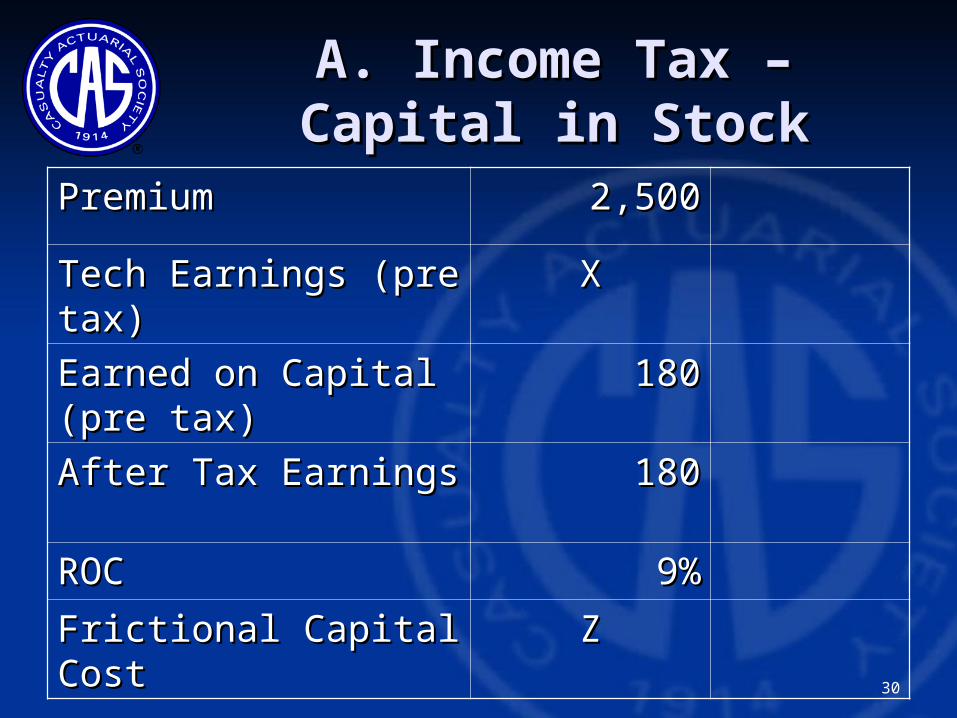
A. Income Tax – A. Income Tax – Capital in StockCapital in Stock
PremiumPremium 2,5002,500
Tech Earnings (pre Tech Earnings (pre tax)tax)
XX
Earned on Capital Earned on Capital (pre tax)(pre tax)
180180
After Tax EarningsAfter Tax Earnings 180180
ROCROC 9%9%
Frictional Capital Frictional Capital CostCost
ZZ

31
A. Income Tax – A. Income Tax – Capital in StockCapital in Stock
PremiumPremium 2,5002,500 2,5002,500
Tech Earnings (pre Tech Earnings (pre tax)tax)
XX 7878
Earned on Capital Earned on Capital (pre tax)(pre tax)
180180 180180
After Tax EarningsAfter Tax Earnings 180180 180180(=0.7*158)(=0.7*158)
ROCROC 9%9% 9%9%
Frictional Capital Frictional Capital CostCost% premium/% % premium/% capitalcapital
ZZ 3.1%/3.1%/3.9%3.9%
(=78/2500(=78/2500))
(=78/2000(=78/2000))
32
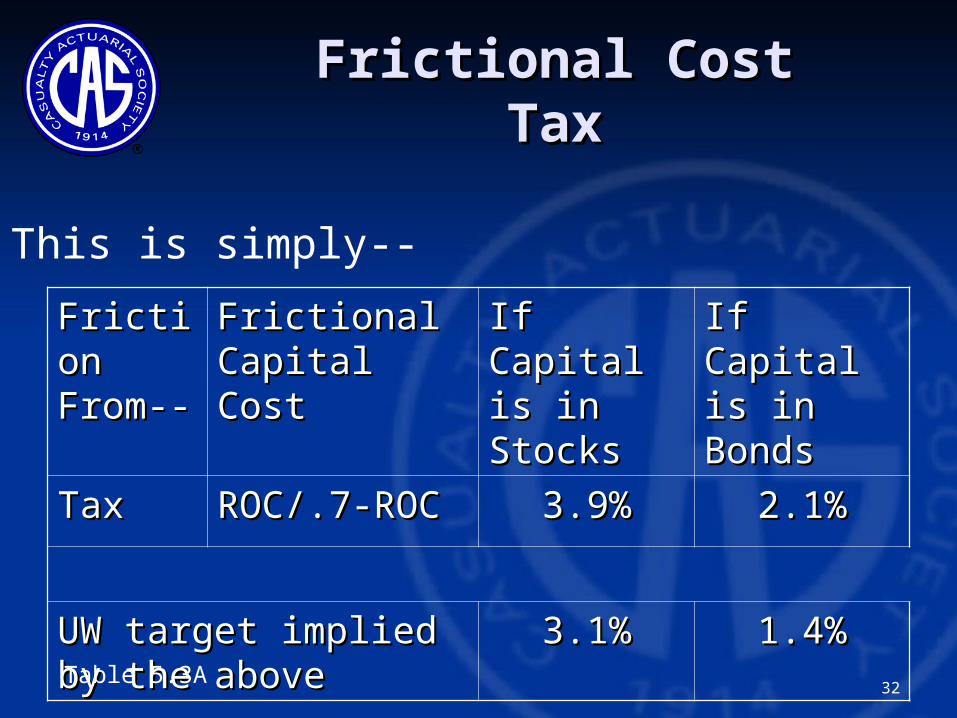
Frictional CostFrictional CostTaxTax
FrictioFriction n From--From--
Frictional Frictional Capital Cost Capital Cost
If Capital If Capital is in is in StocksStocks
If Capital If Capital is in is in BondsBonds
TaxTax ROC/.7-ROCROC/.7-ROC 3.9%3.9% 2.1%2.1%
UW target implied by UW target implied by the abovethe above
3.1%3.1% 1.4%1.4%
This is simply--
Table 5.3A

33
B. Market Value B. Market Value (Mk:BV=1.5)(Mk:BV=1.5)
Capital in StocksCapital in StocksPremiumPremium 2,5002,500 2,5002,500
Tech EarningsTech Earnings XX 205205
Earned on CapitalEarned on Capital 180180 180180
After Tax EarningsAfter Tax Earnings 270270 270270
Return on Market Return on Market ValueValue
9%9% 9%9%
Return on CapitalReturn on Capital 13.5%13.5% 13.5%13.5%
Frictional Capital Frictional Capital CostCost% capital% capital
ZZ 10.3%10.3%
34
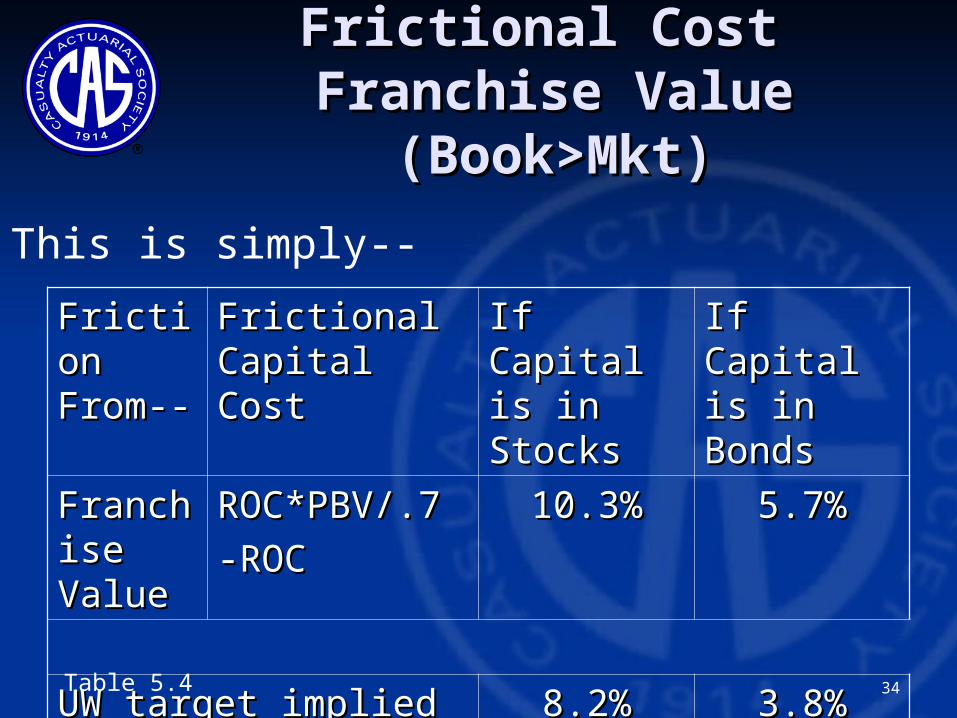
Frictional Cost Frictional Cost Franchise Value Franchise Value
(Book>Mkt)(Book>Mkt)
FrictioFriction n From--From--
Frictional Frictional Capital Cost Capital Cost
If Capital If Capital is in is in StocksStocks
If Capital If Capital is in is in BondsBonds
FranchFranchise ise ValueValue
ROC*PBV/.7ROC*PBV/.7
-ROC-ROC10.3%10.3% 5.7%5.7%
UW target implied by UW target implied by the abovethe above
8.2%8.2% 3.8%3.8%
This is simply--
Table 5.4
35
Cost of Financial Cost of Financial Distress-DescriptionDistress-Description
1.1. Normal avoidance costs– Normal avoidance costs– Compliance, reinsurance, risk Compliance, reinsurance, risk management management
2.2. Expected value of extra costs not Expected value of extra costs not included in #1included in #1
3.3. ““Mortality” or failure risk and other Mortality” or failure risk and other costs that affect franchise valuecosts that affect franchise value
36
Scale Based on Scale Based on SurvivorshipSurvivorship
• If If – 0.5% of companies fail,0.5% of companies fail,– Another 0.5% reach market value 0.Another 0.5% reach market value 0.– Investor wants 9% from all companiesInvestor wants 9% from all companies
• ThenThen– The investor needs 10.1% from the The investor needs 10.1% from the
survivors (0.99*10.1%+ .01*-100%=.09)survivors (0.99*10.1%+ .01*-100%=.09)• Thus – Failure rate increases before-the-Thus – Failure rate increases before-the-
fact earnings requirement to meet after-the fact earnings requirement to meet after-the fact targetfact target

37
Cost of Financial Cost of Financial Distress Distress
Scale based on bondsScale based on bonds• A-rated bonds have failure rates of 0.2%A-rated bonds have failure rates of 0.2%• Failure typically means 50% loss of valueFailure typically means 50% loss of value• Therefore expected failure cost = 0.1%Therefore expected failure cost = 0.1%
– But,But,• Market spread of A-rated over risk free is Market spread of A-rated over risk free is
1.0%, so1.0%, so• Market cost of risk is 0.9% added or 9 Market cost of risk is 0.9% added or 9
times the expected value!times the expected value!

38
Scale based on bondsScale based on bonds
• What is that 0.9%What is that 0.9%– Risk margin?Risk margin?– Provision for Great Depression Provision for Great Depression
type losses with probability of type losses with probability of about 1%?about 1%?
– Price of systematic risk?Price of systematic risk?– Agency costs? (we might say Agency costs? (we might say
adverse selection)adverse selection)
39
Scale from FF3F Scale from FF3F Cummins and Phillips Cummins and Phillips
(2005)(2005)• FF3F fro Phillips and Cummins says FF3F fro Phillips and Cummins says
financial distress worth 3% of financial distress worth 3% of market valuemarket value
40
Selected Financial Selected Financial Distress CostDistress Cost
• For our examples we select financial For our examples we select financial distress costs composed of--distress costs composed of--
• 0.5% for expected value of extra costs, 0.5% for expected value of extra costs, not included in financial projection, plusnot included in financial projection, plus
• 2% increase in cost of capital target2% increase in cost of capital target
• (Note – By adjusting the 2%, the model will (Note – By adjusting the 2%, the model will determine cost of capital by company rating. determine cost of capital by company rating. Table 5.6)Table 5.6)
41
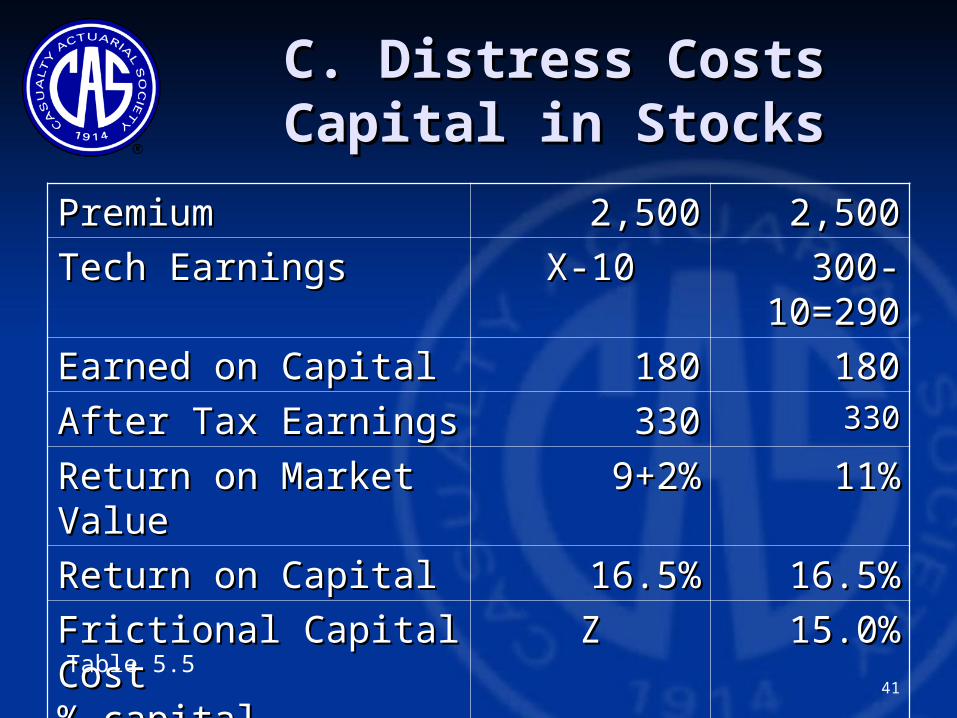
C. Distress CostsC. Distress CostsCapital in StocksCapital in Stocks
PremiumPremium 2,5002,500 2,5002,500
Tech EarningsTech Earnings X-10X-10 300-300-10=29010=290
Earned on CapitalEarned on Capital 180180 180180
After Tax EarningsAfter Tax Earnings 330330 330330
Return on Market Return on Market ValueValue
9+2%9+2% 11%11%
Return on CapitalReturn on Capital 16.5%16.5% 16.5%16.5%
Frictional Capital Frictional Capital CostCost% capital% capital
ZZ 15.0%15.0%Table 5.5

42
Frictional CostFrictional CostDistressDistress
FrictioFriction n From--From--
Frictional Frictional Capital Cost Capital Cost
If Capital If Capital is in is in StocksStocks
If Capital If Capital is in is in BondsBonds
DistresDistress Costss Costs
(ROC*PBV+ (ROC*PBV+ DistressDistressexpexp )/. )/.7+7+
DistressDistresscapcap--ROCROC
15.0%15.0% 10.5%10.5%
UW target implied by UW target implied by the abovethe above
12.0%12.0% 7.0%7.0%
This is simply--

43
Agency RiskAgency Risk
• Fear of investors costs if Fear of investors costs if management actions favor management actions favor management to the disadvantage of management to the disadvantage of investorsinvestors
• Sigma describes this in terms of:Sigma describes this in terms of:– TransparencyTransparency– Reputation (of management)Reputation (of management)– Incentives (for management)Incentives (for management)
44
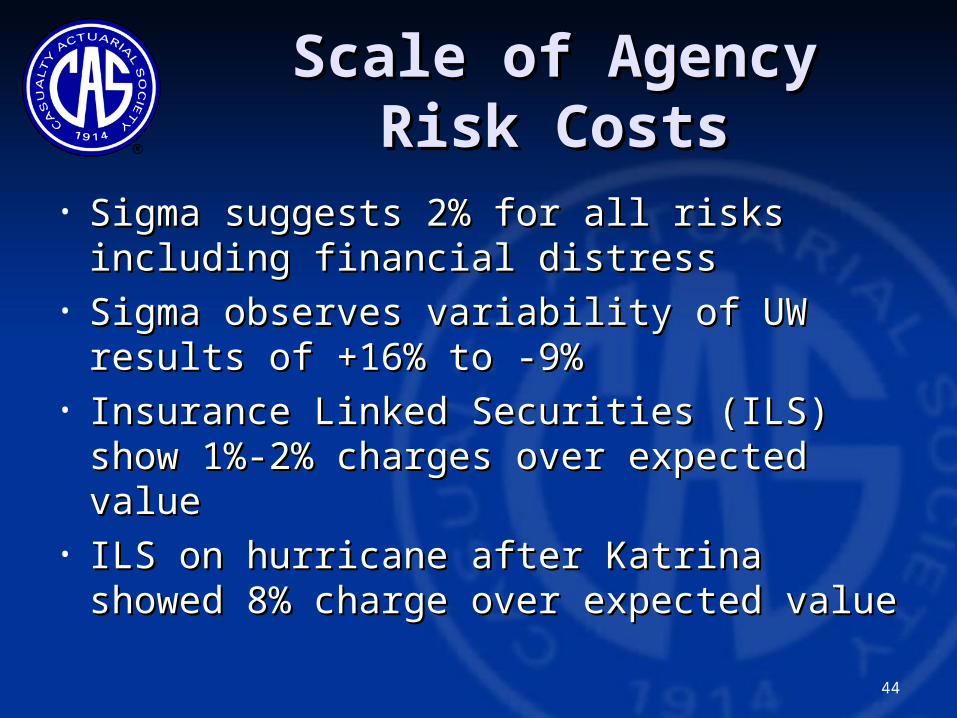
Scale of Agency Risk Scale of Agency Risk CostsCosts
• Sigma suggests 2% for all risks Sigma suggests 2% for all risks including financial distressincluding financial distress
• Sigma observes variability of UW Sigma observes variability of UW results of +16% to -9%results of +16% to -9%
• Insurance Linked Securities (ILS) show Insurance Linked Securities (ILS) show 1%-2% charges over expected value1%-2% charges over expected value
• ILS on hurricane after Katrina showed ILS on hurricane after Katrina showed 8% charge over expected value8% charge over expected value
45
What Should Reduce What Should Reduce Market Cost of Agency Market Cost of Agency
RiskRisk• A long term track record with no A long term track record with no
operational changes that need operational changes that need explanationexplanation
• Results consistent with the business Results consistent with the business plan, even if highly variableplan, even if highly variable
• Communication the investors believeCommunication the investors believe
46
Selected Agency Selected Agency CostCost
• Some is already included in the Some is already included in the projected resultsprojected results
• 1.0% that is not included in the 1.0% that is not included in the results but would affect the P&Lresults but would affect the P&L
• 2.0% that effects franchise value and 2.0% that effects franchise value and not the P&L (i.e., shareholder trust not the P&L (i.e., shareholder trust in management)in management)
47
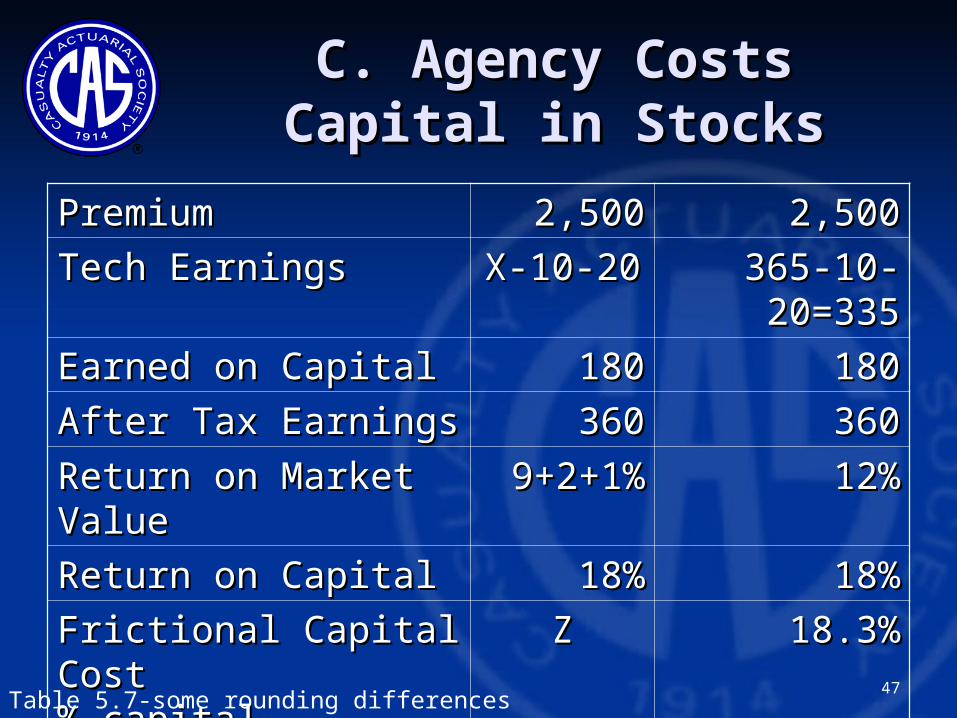
C. Agency CostsC. Agency CostsCapital in StocksCapital in Stocks
PremiumPremium 2,5002,500 2,5002,500
Tech EarningsTech Earnings X-10-20X-10-20 365-10-365-10-20=33520=335
Earned on CapitalEarned on Capital 180180 180180
After Tax EarningsAfter Tax Earnings 360360 360360
Return on Market Return on Market ValueValue
9+2+19+2+1%%
12%12%
Return on CapitalReturn on Capital 18%18% 18%18%
Frictional Capital Frictional Capital CostCost% capital% capital
ZZ 18.3%18.3%
Table 5.7-some rounding differences
48
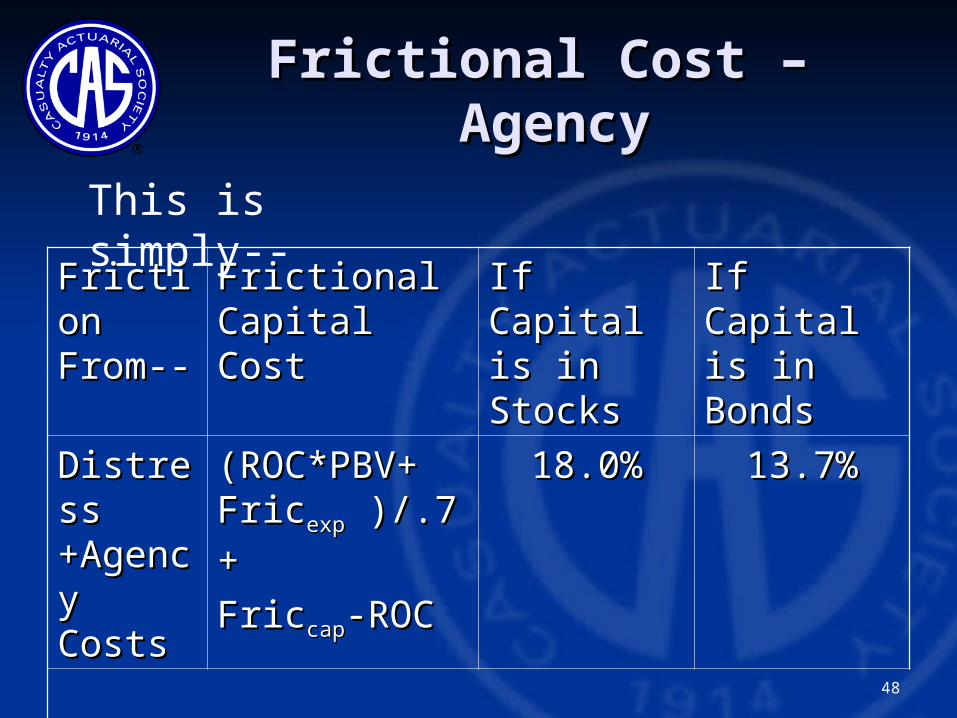
Frictional Cost – Frictional Cost – AgencyAgency
FrictioFriction n From--From--
Frictional Frictional Capital Cost Capital Cost
If Capital If Capital is in is in StocksStocks
If Capital If Capital is in is in BondsBonds
DistresDistress s +Agen+Agency cy CostsCosts
(ROC*PBV+ (ROC*PBV+ FricFricexpexp )/.7+ )/.7+
FricFriccapcap-ROC-ROC
18.0%18.0% 13.7%13.7%
UW target implied by UW target implied by the abovethe above
14.4%14.4% 9.1%9.1%
This is simply--
49
Regulatory CostsRegulatory Costs
• Compliance costsCompliance costs• Investment constraintsInvestment constraints• Limitation on the ability to pay Limitation on the ability to pay
dividends or otherwise move capitaldividends or otherwise move capital

50
Scale of Regulatory Scale of Regulatory CostsCosts
• Sigma reports that financial Sigma reports that financial instruments with reduced liquidity instruments with reduced liquidity require returns 0.5% higherrequire returns 0.5% higher

51
Selected Regulatory Selected Regulatory CostCost
• No impact on technical earnings, as No impact on technical earnings, as compliance and investment compliance and investment constraints are part of the existing constraints are part of the existing earnings projectionsearnings projections
• 0.5% cost of capital from reduction 0.5% cost of capital from reduction in liquidityin liquidity

52
C. Regulatory CostsC. Regulatory CostsCapital in StocksCapital in Stocks
PremiumPremium 2,5002,500 2,5002,500
Tech EarningsTech Earnings X-10-20X-10-20 385-10-385-10-20=35520=355
Earned on CapitalEarned on Capital 180180 180180
After Tax EarningsAfter Tax Earnings 375375 375375
Return on Market Return on Market ValueValue
9+2+1+9+2+1+0.5%0.5%
12.5%12.5%
Return on CapitalReturn on Capital 18.75%18.75% 18.75%18.75%
Frictional Capital Frictional Capital CostCost% capital% capital
ZZ 19.3%19.3%
Table 5.8

53
Frictional Cost – Frictional Cost – RegulatoryRegulatory
FrictioFriction n From--From--
Frictional Frictional Capital Cost Capital Cost
If Capital If Capital is in is in StocksStocks
If Capital If Capital is in is in BondsBonds
DistresDistress s +Agen+Agency cy +Reg +Reg CostsCosts
(ROC*PBV+ (ROC*PBV+ FricFricexpexp )/.7+ )/.7+
FricFriccapcap-ROC-ROC
19.3%19.3% 14.7%14.7%
UW target implied by UW target implied by the abovethe above
15.4%15.4% 9.8%9.8%
This is simply--
54
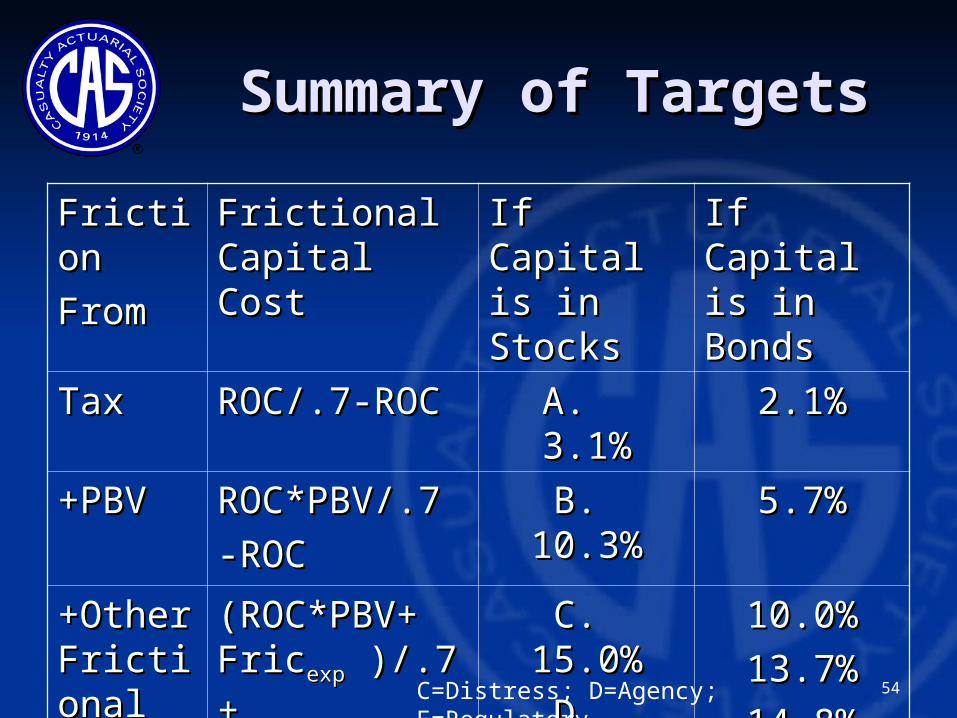
Summary of TargetsSummary of Targets
FrictioFrictionn
FromFrom
Frictional Frictional Capital Cost Capital Cost
If Capital If Capital is in is in StocksStocks
If Capital If Capital is in is in BondsBonds
TaxTax ROC/.7-ROCROC/.7-ROC A. 3.1%A. 3.1% 2.1%2.1%
+PBV+PBV ROC*PBV/.7ROC*PBV/.7
-ROC-ROCB. 10.3%B. 10.3% 5.7%5.7%
+Other +Other FrictioFrictional nal Costs Costs etc.etc.
(ROC*PBV+ (ROC*PBV+ FricFricexpexp )/.7+ )/.7+
FricFriccapcap-ROC-ROC
C. 15.0%C. 15.0%
D. 18.0%D. 18.0%
E. 19.3%E. 19.3%
10.0%10.0%
13.7%13.7%
14.8%14.8%C=Distress; D=Agency; E=Regulatory
55
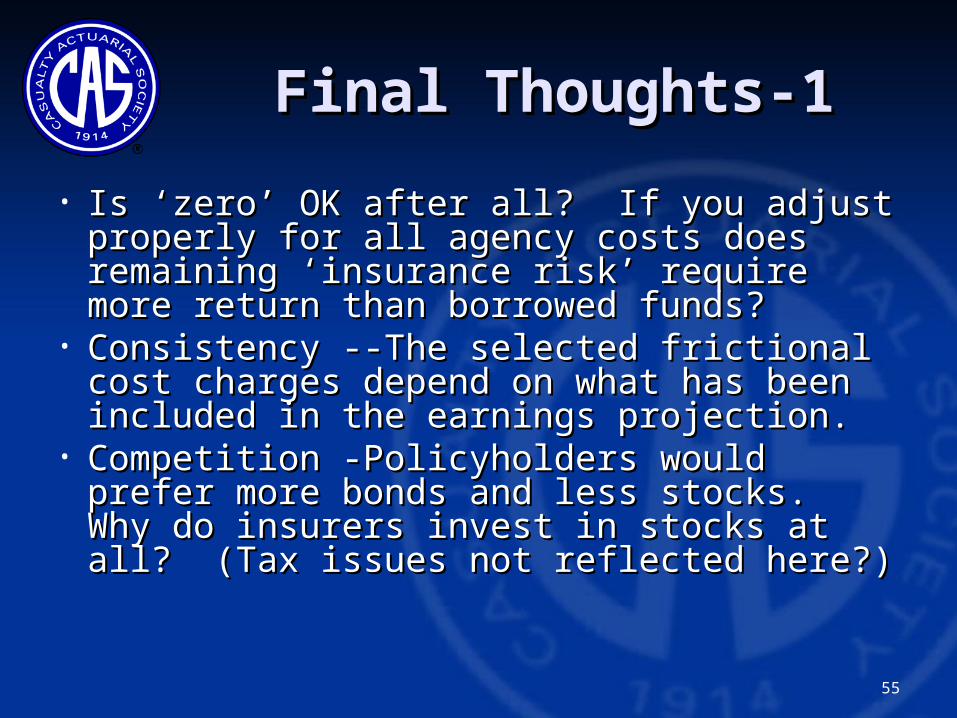
Final Thoughts-1Final Thoughts-1
• Is ‘zero’ OK after all? If you adjust Is ‘zero’ OK after all? If you adjust properly for all agency costs does properly for all agency costs does remaining ‘insurance risk’ require remaining ‘insurance risk’ require more return than borrowed funds?more return than borrowed funds?
• Consistency --The selected frictional Consistency --The selected frictional cost charges depend on what has been cost charges depend on what has been included in the earnings projection.included in the earnings projection.
• Competition -Policyholders would Competition -Policyholders would prefer more bonds and less stocks. prefer more bonds and less stocks. Why do insurers invest in stocks at all? Why do insurers invest in stocks at all? (Tax issues not reflected here?) (Tax issues not reflected here?)

56
Final Thoughts-2Final Thoughts-2
• Language - “Frictional costs” as used Language - “Frictional costs” as used by financial economists has by financial economists has implications nearly the same as “Risk” implications nearly the same as “Risk” as actuaries use the word. as actuaries use the word.
• Language - Terms like ROC, TSR are Language - Terms like ROC, TSR are ambiguousambiguous
• Illustrations - This paper consists of Illustrations - This paper consists of many wild guesses made to illustrate many wild guesses made to illustrate the issues.the issues.
57
DiscussionDiscussion

58