1. tanzania: growth acceleration and increased public...
TRANSCRIPT

1. Tanzania: Growth Acceleration and Increased Public Spending with Macroeconomic
Stability
David O. Robinson, Matthew Gaertner, and Chris Papageorgiou
Tanzania has experienced unprecedented sustained growth acceleration since 1996,
making it one of the fastest-growing countries in Sub-Saharan Africa. The country
remains poor, however, with per capita GDP of just $550 in 2009, and it is on track
to meet only about half of the Millennium Development Goals. To increase growth
and promote development in the coming years, policymakers will need to focus on
accelerating pro-poor growth, meeting macroeconomic challenges, and limiting
vulnerabilities but preparing for the worst.
In the space of a few decades, Tanzania moved from colonialism to independence—
including the union of two states (Tanganyika and Zanzibar)—to socialism to a market-
oriented developing economy. Each of these stages involved significant change, with
different economic institutions and economic incentives.
Tanzania has emerged from this period of significant economic transition as one of the most
rapidly growing economies in Sub-Saharan Africa. For the first time since independence, it
has broken out of the cycle of short-lived accelerations in growth that has characterized many
low-income countries, enjoying strong uninterrupted growth since the mid-1990s. During the
period 1992/93–2008/09, inflation remained in single digits; the debt burden fell
dramatically; the level of public spending increased significantly, permitting expansion of
public services; and international reserves rose sharply (annex figures A1 and A2).
Achieving and sustaining rapid growth while preserving macroeconomic stability represents
a major achievement, and significant improvements have taken place in many aspects of
development. But Tanzania remains a low-income country, with per capita GDP of only
$550 in 2009, and it is on track to meet only about half of the Millennium Development
Goals (MDGs). The challenge is to harness the country’s enormous potential to increase
growth in order to provide opportunities for all to enhance living standards.

- 2 -
This chapter is organized as follows. The first section describes the acceleration in economic
growth that has taken place since the mid-1990s and analyzes the key contributing factors.
The second section examines the roles of the external environment, fiscal policy, monetary
and exchange rate policies, and private banks. The third section reviews Tanzania’s
countercyclical policy response to the global financial crisis. The fourth section identifies
some of the challenges Tanzania needs to deal with if it is to continue to grow in a
sustainable manner. The last section provides some concluding remarks.
Tanzania’s Growth Take-Off
-2
0
2
4
6
8
10
Figure 3. Real GDP Growth, percent change
Source: Tanzanian authorities.
Sub-Saharan Africa enjoyed relatively rapid growth over the decade leading to the 2009
global financial crisis. After many years of poor performance, it grew faster than developed
countries between 1995 and 2005.
Tanzania experienced sustained growth acceleration over this period (figure 1). This section
examines when and why this acceleration occurred.

- 3 -
Most low-income countries exhibit frequent phases of growth, stagnation, and decline
(Pritchett 2000), even where key policies and country characteristics have been relatively
stable (Easterly and others 1993). A technique developed by Bai and Perron (1998) can be
employed to identify structural ―up‖ and ―down‖ breaks in economic growth trends,
capturing this ―stop and go‖ behavior of economic growth in low-income countries. A break
in growth is identified as the point after which the average growth rate is above or below the
previous average growth rate. Berg, Ostry, and Zettelmeyer (2008) extend this methodology
to identify ―growth spells‖ by modifying the procedure to determine sample-specific critical
values when the time dimension is 30 years or less, the typical time horizon in low-income
countries growth series. This methodology was used here to identify episodes of growth
acceleration for all countries in Sub-Saharan Africa for which sufficiently long data series
were available (table 1). The results reveal a large number of countries with growth
accelerations in the 1990s (11 of 25).1
Table 1. Countries in Sub-Saharan Africa Experiencing
"Growth Spells” in the 1990s
Country Year of acceleration
Burkina Faso 1998
Cameroon 1994
Djibouti 1998
Equatorial Guinea 1994
Ghana 1997
Liberia 1994
Mozambique 1995
Namibia 1998
Rwanda 1994
South Africa 1995
Tanzania 1996
Source: Authors’ compilation, based on data from Berg, Ostry, and Zettelmeyer 2008.
Tanzania’s growth take-off was spurred by several key factors, including the significant
structural changes that occurred as the basic institutions of a market economy—a private
banking system, the unification of the exchange rate, price liberalization—were introduced.
Relative to other countries that have experienced growth accelerations, Tanzania stands out
in two respects. First, the extent of the reforms was much broader and larger than the average
of other countries that saw growth accelerate. Second, there was a long lag between key
- 4 -
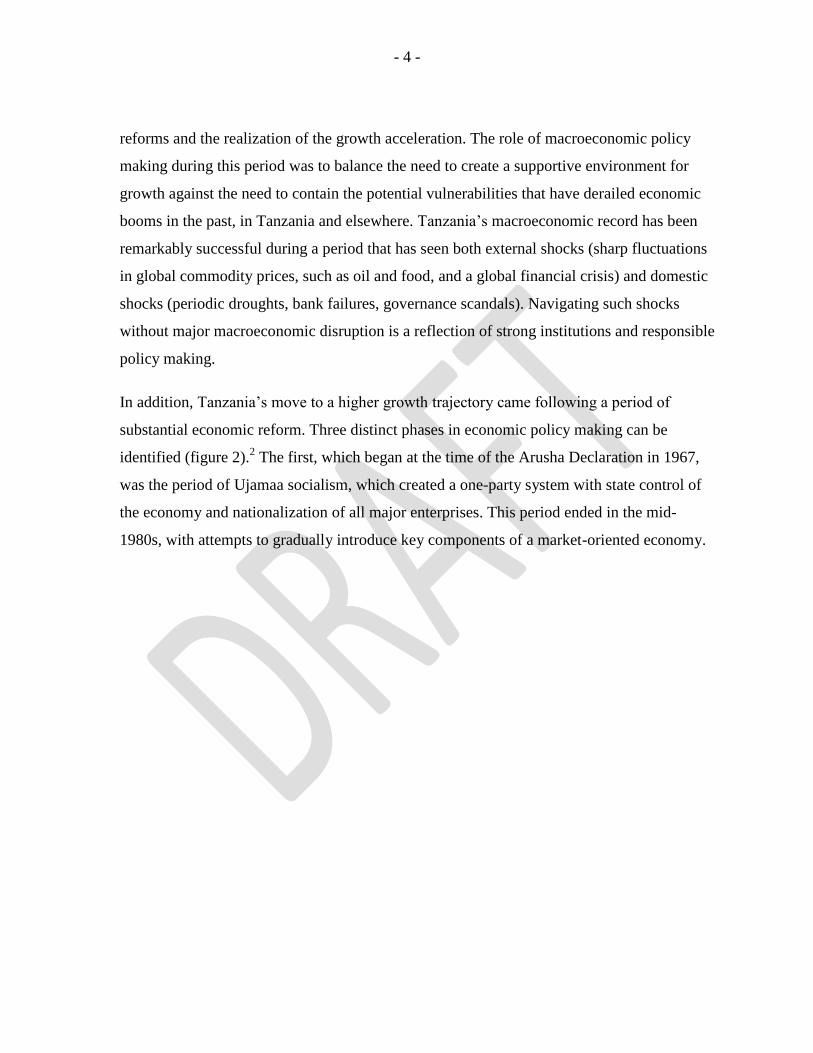
reforms and the realization of the growth acceleration. The role of macroeconomic policy
making during this period was to balance the need to create a supportive environment for
growth against the need to contain the potential vulnerabilities that have derailed economic
booms in the past, in Tanzania and elsewhere. Tanzania’s macroeconomic record has been
remarkably successful during a period that has seen both external shocks (sharp fluctuations
in global commodity prices, such as oil and food, and a global financial crisis) and domestic
shocks (periodic droughts, bank failures, governance scandals). Navigating such shocks
without major macroeconomic disruption is a reflection of strong institutions and responsible
policy making.
In addition, Tanzania’s move to a higher growth trajectory came following a period of
substantial economic reform. Three distinct phases in economic policy making can be
identified (figure 2).2 The first, which began at the time of the Arusha Declaration in 1967,
was the period of Ujamaa socialism, which created a one-party system with state control of
the economy and nationalization of all major enterprises. This period ended in the mid-
1980s, with attempts to gradually introduce key components of a market-oriented economy.
- 5 -
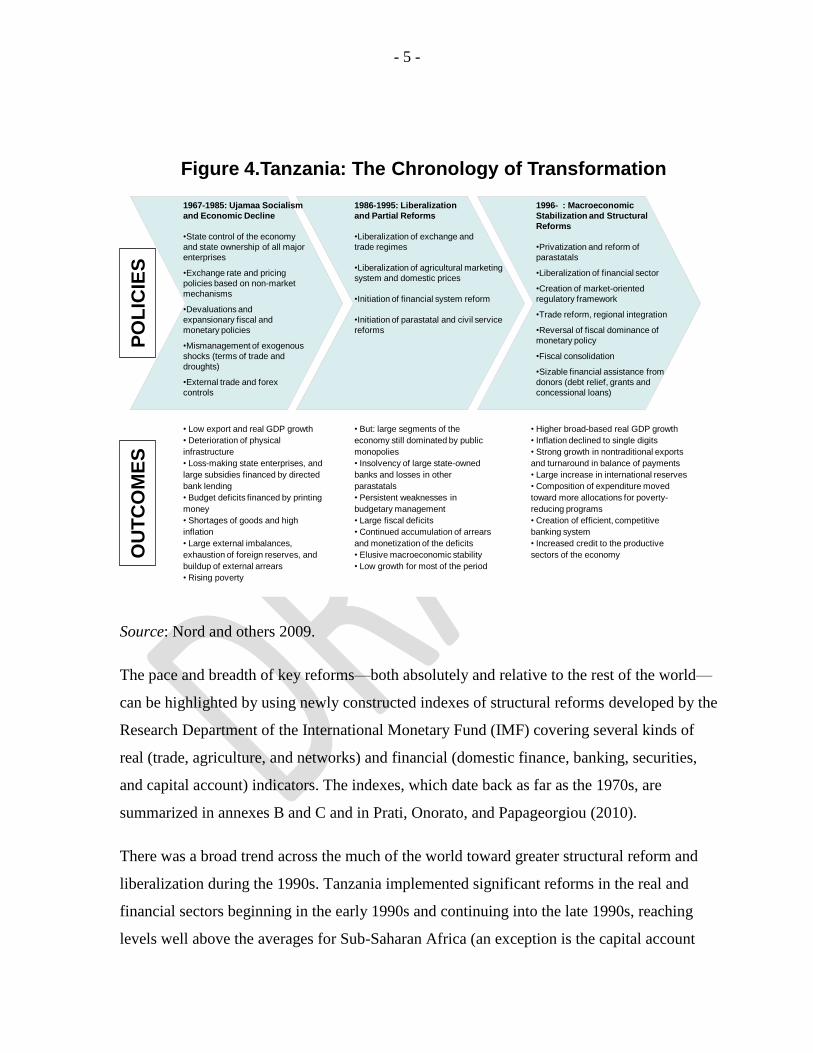
Figure 4.Tanzania: The Chronology of Transformation
• Low export and real GDP growth
• Deterioration of physical
infrastructure
• Loss-making state enterprises, and
large subsidies financed by directed
bank lending
• Budget deficits financed by printing
money
• Shortages of goods and high
inflation
• Large external imbalances,
exhaustion of foreign reserves, and
buildup of external arrears
• Rising poverty
• But: large segments of the
economy still dominated by public
monopolies
• Insolvency of large state-owned
banks and losses in other
parastatals
• Persistent weaknesses in
budgetary management
• Large fiscal deficits
• Continued accumulation of arrears
and monetization of the deficits
• Elusive macroeconomic stability
• Low growth for most of the period
• Higher broad-based real GDP growth
• Inflation declined to single digits
• Strong growth in nontraditional exports
and turnaround in balance of payments
• Large increase in international reserves
• Composition of expenditure moved
toward more allocations for poverty-
reducing programs
• Creation of efficient, competitive
banking system
• Increased credit to the productive
sectors of the economy OU
TC
OM
ES
P
OL
ICIE
S
1967-1985: Ujamaa Socialism
and Economic Decline
•State control of the economy
and state ownership of all major
enterprises
•Exchange rate and pricing
policies based on non-market
mechanisms
•Devaluations and
expansionary fiscal and
monetary policies
•Mismanagement of exogenous
shocks (terms of trade and
droughts)
•External trade and forex
controls
1986-1995: Liberalization
and Partial Reforms
•Liberalization of exchange and
trade regimes
•Liberalization of agricultural marketing
system and domestic prices
•Initiation of financial system reform
•Initiation of parastatal and civil service
reforms
1996- : Macroeconomic
Stabilization and Structural
Reforms
•Privatization and reform of
parastatals
•Liberalization of financial sector
•Creation of market-oriented
regulatory framework
•Trade reform, regional integration
•Reversal of fiscal dominance of
monetary policy
•Fiscal consolidation
•Sizable financial assistance from
donors (debt relief, grants and
concessional loans)
Source: Nord and others 2009.
The pace and breadth of key reforms—both absolutely and relative to the rest of the world—
can be highlighted by using newly constructed indexes of structural reforms developed by the
Research Department of the International Monetary Fund (IMF) covering several kinds of
real (trade, agriculture, and networks) and financial (domestic finance, banking, securities,
and capital account) indicators. The indexes, which date back as far as the 1970s, are
summarized in annexes B and C and in Prati, Onorato, and Papageorgiou (2010).
There was a broad trend across the much of the world toward greater structural reform and
liberalization during the 1990s. Tanzania implemented significant reforms in the real and
financial sectors beginning in the early 1990s and continuing into the late 1990s, reaching
levels well above the averages for Sub-Saharan Africa (an exception is the capital account

- 6 -
index, which lagged the region as a whole). Clear standouts are current account and domestic
financial reforms (annex figure D1), which show extraordinary improvements in a very short
period. Figures 3 and 4 document the association between reforms (especially in trade and
finance) and growth breaks.
Figure 3. Indexes of Real Sector Reform in Tanzania and Other Experiencing Growth
Acceleration
0.40
0.45
0.50
0.55
0.60
0.65
0.70
0.75
- 5 - 4 - 3 - 2 - 1 0 1 2 3 4 5
Liberalization index
(deviations from country means)
Years before and after growth break
Trade liberalization (tariff)
0.00 0.10 0.20 0.30 0.40 0.50 0.60 0.70 0.80 0.90
- 5 - 4 - 3 - 2 - 1 0 1 2 3 4 5
Liberalization index
(deviations from country means)
Years before and after growth break
Trade liberalization (current account)
b. Current account restrictions index
0.30
0.35
0.40
0.45
0.50
0.55
0.60
0.65
0.70
- 5 - 4 - 3 - 2 - 1 0 1 2 3 4 5
Liberalization index
(deviations from country means)
Years before and after growth break
Agriculture liberalization
c. Agriculture index
More liberalization
Average liberalization index
More liberalization
Less liberalization
More liberalization
Less liberalization
Less liberalization
a. Trade index
Tanzania's liberalization index

- 7 -
Figure 4. Indexes of Financial Sector Reforms in Tanzania and Other Countries Experiencing Growth
Acceleration
Source: Authors estimates using GDP data from WEO. Note: The number of countries used to compute each average varies across indexes, based on data availability.
0.34 0.36 0.38 0.40 0.42 0.44 0.46 0.48 0.50 0.52 0.54
- 5 - 4 - 3 - 2 - 1 0 1 2 3 4 5
Liberalization index
(deviations from country means)
Years before and after growth break
More liberalization
Less liberalization
0.20
0.30
0.40
0.50
0.60
0.70
0.80
- 5 - 4 - 3 - 2 - 1 0 1 2 3 4 5
Liberalization index
(deviations from country means)
Years before and after growth breaks
0.00 0.10 0.20 0.30 0.40 0.50 0.60 0.70 0.80 0.90 1.00
- 5 - 4 - 3 - 2 - 1 0 1 2 3 4 5
Liberalization index
(deviations from country means)
Years before and after growth breaks
b. Banking subindex
More liberalization
Less liberalization
a. Domestic finance index
c. Capital account index
More liberalization Less liberalization
Average liberalization index
Tanzania's liberalization index

- 8 -
Various factors may explain this pattern. First, given the nationalization of all private
property that occurred in 1967, a credibility gap probably existed regarding the irreversibility
of reforms. Second, given the physical size of Tanzania and the limited means of
communication, it took time to convey information on the reforms throughout the country
and to translate the legislative reforms into actual change on the ground. Third, as discussed
in Mwase and Ndulu (2008), failure to address key bottlenecks prevented the realization of
gains from other reforms. The exchange market was unified only in 1994, for example,
removing a severe obstacle to trade, including access to needed imports (figure 5).
Figure 5. Official and Parallel Market Exchange Rates in Tanzania, 1970–95
0
100
200
300
400
500
600
700
800
0
100
200
300
400
500
600
1970
1971
1972
1973
1974
1975
1976
1977
1978
1979
1980
1981
1982
1983
1984
1985
1986
1987
1988
1989
1990
1991
1992
1993
1994
Parallel Market Premium,
% (right scale)
Official Rate
Shilling / US$
(left scale)
Parallel Market Rate
Shilling / US$
(left scale)
Source: Authors’ compilation, based on data from IFS, Pick’s Currency Yearbook, and World Currency Yearbook

- 9 -
Sustaining Growth Following the Initial Acceleration
Tanzania’s economy has grown by
3.5–7.8 percent year since 1996,
averaging 6.0 percent, well above the
rates for Sub-Saharan Africa as a
whole. These rates represent a
substantial increase over earlier
growth rates in Tanzania, and unlike
previous accelerations in growth, has
been maintained over a sustained
period of time (figure 6).
Several patterns are evident from Tanzania’s growth performance (figures 7 and 8 and table
2):
Acceleration has been driven by domestic demand, not exports. Large increases in
both consumption and investment have been recorded, in both cases reflecting
significant increases in public spending.
The key sectors contributing to growth have been services and, to a lesser degree,
industry; agriculture has not contributed to growth. Within the service sector,
particularly rapid growth has been experienced in construction, telecommunications,
financial services, and mining—all subsectors that have been liberalized. The limited
contribution of agriculture—in a country where about three-quarters of the population
resides in rural areas, where poverty is concentrated—is a concern. It also represents
an opportunity, as international experience suggests that the sector can respond
rapidly if the right incentives and supporting infrastructure are put in place.
The acceleration in growth can be traced to a combination of higher investment and
increases in productivity. Growth decomposition is always subject to interpretation,
particularly regarding the estimation of the capital stock (and therefore the
0
1
2
3
4
5
6
7
8
Figure 9. Real GDP Growth, percent change
Tanzania
SSA

- 10 -
contribution of investment and the interpretation of the residual as productivity
growth). That said, it is clear that the acceleration in Tanzania was not driven by
greater use of labor.3 Studies of the agricultural sector during this period show little or
no improvement in yields for the sector as a whole, with increased output coming
from an increase in land under cultivation.
Figure 7. Contributions to Real GDP Growth in Tanzania by Type of Expenditure and Production, 1999–2009
-8
-4
0
4
8
12
16
20Contribution to Real GDP Growth, by Expenditure
(percentage points)
Consumption Investment
Net exports
0
3
6
9
12
15Contribution to Real GDP Growth, by Production
(percentage points)
Agriculture Industry Services

- 11 -
Contributions to Real GDP Growth, by Total Factor Productivity
(Percentage points)
Labor
Capital
TFP
0
1
2
3
4
5
6
7
8
9
1995 1996 1997 1998 1999 2000 2001 2002 2003 2004 2005 2006 2007 2008
(Est.)
Sources: Tanzanian authorities and IMF staff estimates.
Table 2. Factor Contributions to Real GDP Growth in Tanzania, 1986–2008 (percent)
Item 1986–90 1991–95 1996–2000 2001–08
Real GDP growth 5.3 1.8 4.3 7.1
Labor force 2.2 2.5 1.7 1.7
Capital 0.9 1.3 0.3 1.9
Total factor productivity 2.2 -2.0 2.3 3.5
Source: IMF staff calculations.
Although exports did not lead the growth acceleration—indeed at just 25 percent of GDP in
2008/09, they remain at a low level—the composition of exports has seen significant changes
(figure 9). Traditional exports
(cotton, coffee, and tea) have
declined significantly in importance,
partly reflecting the reorientation of
the sector toward meeting the
consumption needs of a rapidly
growing local population. At the
0
20
40
60
80
100
Figure 11. Composition of Exports of Goods and Services
Gold Traditional Other goods Other services Tourism

- 12 -
same time, gold exports went from zero in 1999 to $1.4 billion (nearly 40 percent of export
receipts) in 2009, making Tanzania the fourth-largest gold exporter in Africa after South
Africa ($6.3 billion), Ghana ($2.6 billion), and Mali ($2.0 billion). The service sector—
tourism and other services, such as transport—has also grown at a steady rate.
The External Environment
Tanzania’s growth acceleration coincided with a period of both unprecedented expansion in
the global economy and significant volatility in commodity prices and capital flows (private
and official, including both aid and debt relief) that have posed challenges for
macroeconomic management. Given its low level of exports, Tanzania has been insulated
from fluctuations in prices and demand for exports and the boom-bust cycles such
fluctuations have created in other commodity-dependent countries. However, significant
impacts have been felt on the import side. The sharp increase in oil prices during the 2000s
resulted in an oil import bill of $1.7 billion in 2007/08, almost 9 percent of GDP. Recent
spikes in the price of fertilizer, most of which is imported, have constrained the government’s
ability to stimulate agricultural production. Disruptions in the global rice market in 2008 hit
Zanzibar hard, contributing to inflation that reached 27 percent a year in September 2008
before declining to 5 percent a year later.
Fairly broad restrictions on capital account transactions remain in place—preventing, for
example, foreign portfolio inflows to the domestic government securities markets or private
capital outflows into neighboring securities markets. Private capital inflows are nevertheless
becoming an increasingly important source of financing for investment. Foreign direct
investment, most of it in the mining sector, averaged 3.5 percent of GDP during 1996-2008.
Before the global financial crisis, loan syndications were being used to finance investment,
mostly in the telecom sector.
Official capital inflows have been important sources of financing for Tanzania since
independence. Official development assistance peaked on average during 1986–92 (it
represented almost 25 percent of GDP in 1992) before declining through the 1990s and then

- 13 -
rising again, to about 17 percent of GDP in 2007. The component of aid that goes through the
budget has been rising, albeit with significant year-on-year variability (table 3).
Table 3. Gross External Program and Project Assistance in Tanzania, 1996/97–2007/08
Year
Program assistancea Project assistance Debt service relief
Total
assistance Grants Loans Grants Loans
1996/97 1.7 0.9 3.0 3.2 0.0 8.7
1997/98 1.7 1.3 2.6 2.2 0.0 7.8
1998/99 1.7 1.2 2.5 1.9 0.0 7.3
1999/00 1.7 0.7 2.8 2.8 0.0 8.1
2000/01 1.6 0.5 3.2 2.1 0.4 7.8
2001/02 2.4 0.9 2.8 1.1 0.6 7.8
2002/03 3.2 1.3 2.3 1.1 0.6 8.5
2003/04 3.4 1.7 2.6 2.0 0.6 10.2
2004/05 4.2 1.3 2.7 2.1 0.5 10.7
2005/06 3.5 2.0 2.0 1.9 0.7 10.1
2006/07 3.3 1.7 1.2 2.2 1.2 9.7
2007/08 3.5 2.4 3.0 2.2 0.9 12.1 Source: Tanzanian authorities and IMF staff estimates.
a. Includes both general budget support and basket funds.
In addition to the absolute level of aid inflows, two other aspects of aid have had
macroeconomic impacts. First, the composition of aid inflows has shifted. In line with the
government’s stated preferred modality, aid has increasingly been provided in the form of
general budget support—cash that goes directly into the budget—rather than project support.
Such aid gives the government more control over the use of resources provided by
development partners and can be used to better meet national rather than externally-driven
(foreign) priorities. However, the use of general budget support also places a heavier burden
on government processes to ensure the effective allocation of budgetary resources and
maintain a broad dialogue with development partners on results and use of funds to ensure
continued access to aid. Its use also complicates macroeconomic management, making it
critical to ensure that the spending of aid does not induce undesirable macroeconomic
consequences, such as a sharp appreciation of the exchange rate. An early evaluation of the
impact of general budget support in Tanzania noted that it facilitated the government’s ability
to implement policies to which it was committed without discernable adverse

- 14 -
macroeconomic consequences but that it was less effective in securing commitment to
policies (Lawson and others 2005).
Significant aid has been provided in the form of debt relief. Tanzania qualified for the
Heavily Indebted Poor Countries (HIPC) initiative in 2001, receiving debt relief of about $3
billion. In 2006 the IMF, the World Bank, and the African Development Bank implemented
the Multilateral Debt Reduction Initiative, providing debt relief of an additional $3.5 billion.
Debt relief has substantially reduced the debt burden in Tanzania, freeing up budgetary
resources for alternate uses. It has also left the country with a low level of debt—in absolute
and especially net present value terms, given the highly concessional nature of much of the
outstanding stock—generating a low risk of debt distress in conventional debt sustainability
analyses (see, for example, the joint Bank/Fund debt sustainability analysis in IMF 2010c)
and making Tanzania a potentially attractive destination for capital inflows. Cognizant of the
difficulties that arose from the very high debt burden, in 2004 lawmakers introduced a formal
minimum concessionality requirement in external borrowing by the government, initially
established at 50 percent but subsequently reduced to 35 percent.
0
5
10
15
20
25
30
Figure 12. Government Expenditure, % of GDP
0
5
10
15
20
25
30
Figure 13. Financing of Fiscal Expenditure, % of GDP
Revenue Grants Foreign Domestic
<<B>>Fiscal Policy
The most striking feature of fiscal policy between 1992/93 and 2008/09 was the expansion in
public spending. After falling to 15–17 percent of GDP in the mid-1990s as inflation was
brought under control, spending increased sharply in 2001/02, reaching more than 25 percent

- 15 -
of GDP in 2008/09 (even higher figures were budgeted for 2009/10 and 2010/11) (figure 10).
Government spending per capita increased from about $40 in 1998/99 to $150 in 2008/09.
How was this spending financed without endangering price stability or increasing debt
sustainability? Where did the money go? Expenditures are financed by increasing revenues,
obtaining financing from abroad (as loans or grants), or borrowing domestically. Tanzania
has used all three sources (figure 11).
0
5
10
15
20
25
30
Figure 12. Government Expenditure, % of GDP
Revenue performance has been striking. After an initial dip in the second half of the 1990s,
revenues increased strongly, from just 10 percent of GDP in 1999/2000 to almost 16 percent
in 2008/09. The improvement reflects a combination of tax policy and administration.
Tax policy has focused on reorienting the tax system to reflect the changing economic
structure, as parastatals were gradually privatized; trade (internal and external) was
liberalized; and a private sector, often informal, emerged. Key changes included the
following:
A valued added tax (VAT) was introduced in July 1998, providing about one-third of
government revenues. The rate was reduced to 16 percent in July 2009, bringing it
into line with most East African countries.
- 16 -
Income taxes, which also provide about one-third of government revenues, were
progressively modernized, with the maximum rates reduced to 30 percent, down from
70 percent rate in 1991.
The tax system was simplified, through restrictions on the range of taxes subnational
authorities can impose and the repeal of numerous low-yielding taxes.
Relative stability was achieved in key tax rates. Following initial reforms, the rates of
the major taxes were left largely unchanged, in part linked to regional tax
harmonization initiatives.4
Improvements in tax administration have been no less important. The first step in
strengthening administration came with the creation of the Tanzania Revenue Authority, in
1998/99. The Tanzania Revenue Authority has been able to progressively modernize tax
collections, by introducing self-assessment procedures and electronic filing and payments
and by carefully allocating its own human resources into high-return areas. Indeed the Large
Taxpayer Department introduced in 2003 now collects almost three-quarters of domestic
taxes, with the number of enterprises covered rising from 98 to more than 370.
There is still scope for improving tax policy. In addition to its revenue-raising role, tax policy
has been used as a component of the broader development strategy to provide incentives for
specific economic activities in an attempt to attract investment. Exemptions, such as tax
holidays, are provided for qualified investments and for companies established in designated
export-processing zones or special economic zones. A special regime was also created for
mining activities, based on a tax/royalty regime but with additional relief from VAT and
other taxes, such as the fuel levy. The efficacy of such incentive regimes for attracting
investment is the subject of a fierce debate and beyond the scope of this chapter. Recent
budgets have also introduced VAT exemptions for specific industries or products, thereby
eroding the tax base and complicating tax administration.

- 17 -
0
10
20
30
40
50
60
70
80
90
100
Figure 14. Financing of Fiscal Expenditure, % of Expenditure
Revenue Grants Foreign Domestic
Reliance on domestic financing—initially largely from the central bank, later from
commercial banks and social security funds—has decreased significantly, in part out of a
desire to contain the rate of monetary growth to bring down inflation. For several years in the
mid-2000s, budgets were anchored on a zero net domestic financing target, which provided
continued support for inflation stabilization, eased interest rate pressures, and increased room
for banks to lend to the private sector. Where there were shortfalls in foreign financing,
limited resort was made to domestic financing in order to avoid disruptions in expenditure
programs.5
Even with this dramatic improvement in revenues, donor dependency has not declined.
Government revenues still cover only about 50–60 percent of government expenditures—less
than the level of recurrent spending (see figure 11). Weak domestic revenue perpetuates
reliance on foreign support,
potentially adding both
uncertainty and volatility to
the government’s ability to
deliver its programs.
Alternatively, the low share
of government revenues to
expenditures can be
interpreted as an effort by
the government to exploit
the availability of cheap
financing sources to expand
delivery of public services beyond the level possible from domestic resources alone. The key
is to ensure that efforts are underway to build a broad tax base capable of sustaining the
desired level of public services in the event that donor funds diminish over time, that these
efforts are not reduced by the presence of aid inflows, and that the additional public spending
is used wisely.

- 18 -
The higher spending has appropriately been focused on priorities related to the National
Strategy for Growth and Reduction of Poverty (known by its Swahili acronym,
MKUKUTA). The 2009/10 budget allocates 71 percent of expenditures to MKUKUTA
priorities. At the sectoral level, the two sectors receiving the largest budget allocations are
education and health, which together account for about 30 percent of budgetary spending.
The impact of the spending is difficult to gauge. In education, for example, substantial
investment in construction of new classrooms has supported an expansion in primary school
enrollment to about 95 percent, up from about 60 percent a decade earlier. But issues remain
with unfilled vacancies for teachers, particularly in rural communities; uneven financial
transfers; and concerns about the quality of education, with pass rates in standardized
examinations declining (Claussen and Assad 2010). In the health sector, a recent value for
money study identified sharp regional differences in activity levels and performance, with no
linkage to resource allocations (National Audit Office 2010).
Monetary and Exchange Rate Policies
The primary objective of the Bank of Tanzania is to maintain domestic price stability
conducive to balanced and sustainable growth of the national economy. A secondary
objective is to support the integrity of the financial system. With inflation reduced to single
digits and a financial system that has grown rapidly in recent years, the Bank of Tanzania
appears on track to meeting both objectives.
It has not been an easy transition. In the late 1980s, Tanzania had one of the least developed
financial systems in the world. Credit was allocated centrally, all of the major financial
institutions were state owned, there were no capital or money markets, the Bank of Tanzania
simply printed money to finance the fiscal deficit and provide liquidity to insolvent banks,
and foreign exchange was rationed, with a substantial spread between the official and black
market rates.
Interest rates and foreign exchange markets were progressively liberalized starting in 1991,
but the initial distortions—the legacy constraints—took time to resolve and served to shape

- 19 -
economic policy options for most of the decade. In particular, with minimal foreign exchange
reserves, central bank interventions in the market were initially targeted at accumulating
reserves while smoothing seasonal volatility in the exchange rate. As the government was
able to rein in its domestic financing needs and donors increasingly moved to providing
budget support, the availability of foreign exchange increased, allowing the Bank of
Tanzania to accumulate reserves, reducing upward pressure on the exchange rate (figure 12).
It did so at the cost of assigning the burden of liquidity management to Treasury bill sales,
however, resulting in rising domestic debt and upward pressure on nominal interest rates.
This unbalanced monetary policy
mix, with high yields on government
securities, low inflation, and
exchange rate stability, proved
difficult to sustain, however,
particularly given the shallow
domestic financial market with a
small number of key players (Abbas,
Ali, and Sobolev 2008). In late 2007
the central bank issued a press
release indicating that its foreign exchange operations were limited to smoothing short-term
volatility and that the exchange rate
could appreciate. Only thereafter did
markets become more balanced.
Private Banks
Private banks were formally
permitted in 1992, but none began
operations until 1994. All of the
large state-owned banks were 0
2
4
6
8
10
12
14
16
18
Figure 16. Private sector credit/GDP
0
500
1000
1500
2000
2500
3000
3500
Figure 15. Foreign Exchange Reserves, $mn

- 20 -
privatized, but the process was lengthy and the former state-owned banks—CRDB
(privatized in 1996), NBC (privatized in 2000), and NMB (privatized in 2005)—continue to
dominate the financial system. Indeed, only since about 2000 has the private sector been able
to access credit from the banking system.
Credit has grown rapidly since then (figure 13). Entry of new banks has accelerated in recent
years, with 41 banks licensed as of the end of June 2010. Access to financial services remains
limited, however—only 11 percent of adult Tanzanians held a bank account at end-2009—
with financial services in rural areas increasingly shifting to mobile telephone systems.
Financial sector supervision has evolved along with the changing role of Tanzania’s financial
institutions. The government and the Bank of Tanzania developed a risk-based supervisory
framework that provides sufficient authority to the body responsible for supervising and
regulating the banking system sufficient authority. A bank intervention and resolution
framework is in place, supported by a deposit insurance scheme. These institutions facilitated
the closure of four private banking institutions, including two foreign owned, without major
disruptions to the banking system and with full compensation for individual depositors.6 The
legislative foundation for supervision of the broader financial system—chiefly pension funds
and insurance companies—has been put in place, but implementation needs to be enhanced
in order to guard against the buildup of potentially large fiscal liabilities.
Using the Newfound Policy Space: Countercyclical Policy Response to the Global
Financial Crisis
The degree to which Tanzania, and many other countries in Africa, have changed in terms of
both economic structures and macroeconomic policy space was clearly demonstrated during
the global financial crisis. Past global slowdowns have been very difficult for Africa: as
documented in IMF (2010a), in previous global slowdowns, Africa suffered both a deeper
slowdown and a more gradual recovery. This crisis has been different, with Sub-Saharan
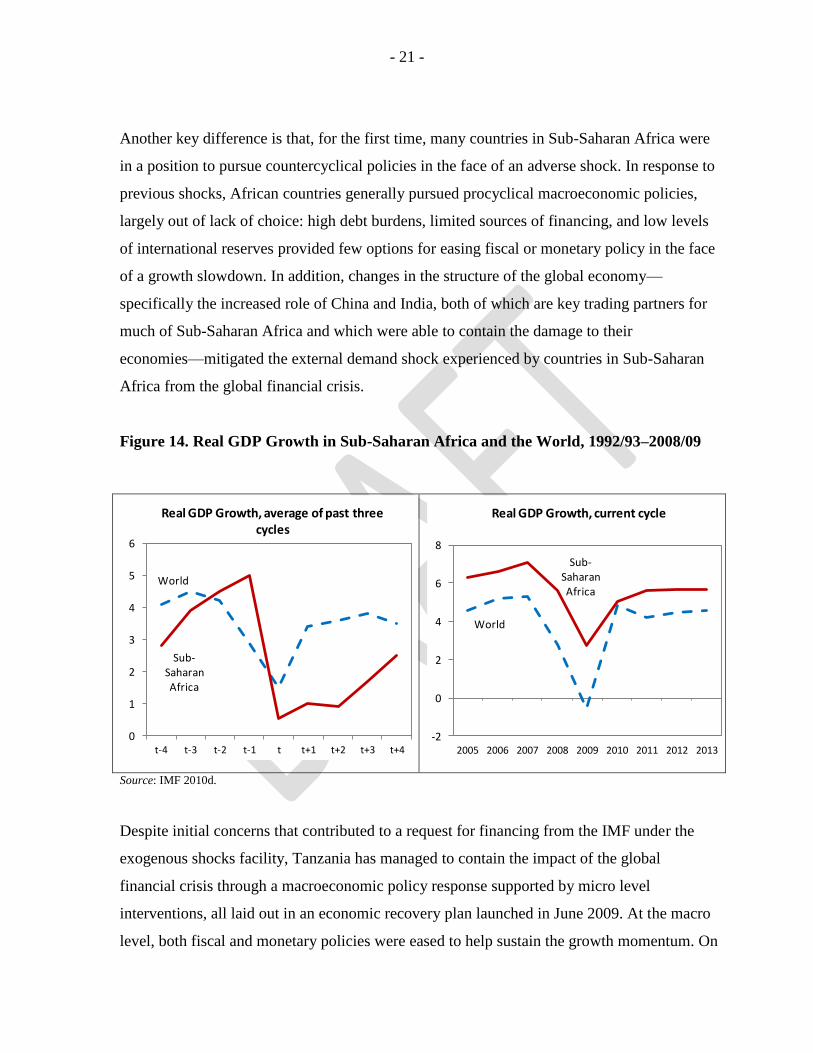
Africa as a whole seeing a large but short-lived dip in economic growth (figure 14).
- 21 -
Another key difference is that, for the first time, many countries in Sub-Saharan Africa were
in a position to pursue countercyclical policies in the face of an adverse shock. In response to
previous shocks, African countries generally pursued procyclical macroeconomic policies,
largely out of lack of choice: high debt burdens, limited sources of financing, and low levels
of international reserves provided few options for easing fiscal or monetary policy in the face
of a growth slowdown. In addition, changes in the structure of the global economy—
specifically the increased role of China and India, both of which are key trading partners for
much of Sub-Saharan Africa and which were able to contain the damage to their
economies—mitigated the external demand shock experienced by countries in Sub-Saharan
Africa from the global financial crisis.
Figure 14. Real GDP Growth in Sub-Saharan Africa and the World, 1992/93–2008/09
World
Sub-Saharan Africa
0
1
2
3
4
5
6
t-4 t-3 t-2 t-1 t t+1 t+2 t+3 t+4
Real GDP Growth, average of past three cycles
World
Sub-Saharan Africa
-2
0
2
4
6
8
2005 2006 2007 2008 2009 2010 2011 2012 2013
Real GDP Growth, current cycle
Source: IMF 2010d.
Despite initial concerns that contributed to a request for financing from the IMF under the
exogenous shocks facility, Tanzania has managed to contain the impact of the global
financial crisis through a macroeconomic policy response supported by micro level
interventions, all laid out in an economic recovery plan launched in June 2009. At the macro
level, both fiscal and monetary policies were eased to help sustain the growth momentum. On

- 22 -
the fiscal side, easing of more than 2 percent of GDP was envisaged, including a reduction in
the VAT rate from 20 percent to 18 percent, partial government guarantees for loan
restructurings in troubled sectors, expanded agricultural input subsidies, expanded
investments in energy and road sectors, and temporary exemptions from royalties for
tanzanite and diamond miners. The interventions were specifically targeted to sectors
expected to be hardest hit by the crisis. The fiscal easing was financed in part by
development partners, several of which were able to advance funding from future years, but
also in part from domestic sources, with a modest increase in the volume of sales of Treasury
bills and exceptional direct credits from the central bank. As elsewhere, commercial banks
became more risk averse, with credit growth to the private sector falling sharply and high
demand for government obligations serving to push down interest rates to record lows.
Although the crisis is not yet over, preliminary estimates for 2009 point to growth slowing to
6.0, rising to 6.5 percent in 2010.
What’s Next ?
Tanzania has managed to achieve and sustain rapid growth while preserving macroeconomic
stability for the past 15 years. Despite this achievement, it is on track to achieve only about
half of the MDGs (table 4) (United Republic of Tanzania 2009b). What needs to be done in
the years ahead? What macroeconomic policies would be beneficial?
Table 4. Projected Progress toward Selected MDG Targets by Tanzania
Target 1990 2000 2008 2015 Likely to achieved target?
Population below basic needs poverty line (percent)
39.0 36.0 33.6 19.5 No
Under-five underweight (percent) 28.5 29.5 22.0 14.4 No
Under-five stunted (percent) 46.6 44.4 38.0 23.3 No
Primary school net enrollment rate 54.2 58.7 97.2 100.0 Yes
Under-five mortality rate (per 1,000 live births) 191.0 153.0 112.0 64.0 Yes
Infant mortality rate (per 1,000 live births) 115.0 99.0 68.0 38.0 Yes
Maternal mortality rate (per 100,000 live births) 529.0 — 578.0 133.0 No
Births attended by skilled health personnel percent (percent)
43.9 35.8 63.0 90.0 No
HIV prevalence, 15–24 (percent) 6.0 — 2.5 < 6.0 Yes

- 23 -
Access to potable water (percent of rural population)
51.0 42.0 57.1 74.0 No
Access to potable water (percent of urban population)
68.0 85.0 83.0 84.0 Yes
Source: United Republic of Tanzania 2009a. Note: — Not available.
<<B>Accelerating Pro-Poor Growth
Constraints to growth in Tanzania are similar to those seen in most countries: inadequate
infrastructure, regulatory bottlenecks, skill shortages, and deficiencies in the legal
environment. These weaknesses constrain the realization of income opportunities at all
levels—from the smallholder farmer trying to get surplus crops to market to the large foreign
investor.
The past few years have seen little progress in several indicators of the business environment.
Tanzania’s rank in the Doing Business Index has been slipping, reaching 131 in 2010, as
other countries have taken more determined strides to make their economies more business
friendly. Tanzania scores particularly poorly on basic bureaucratic requirements involving
numbers of procedures/permits and the time spent to receive them. The importance of
addressing this slowdown in these broader areas of structural reform is reinforced by a key
result of the literature on growth spells: although macroeconomic and financial reforms can
drive a growth up-break, they are not sufficient in isolation to sustain one (Hausmann and
others 2005).
Infrastructure is a constraint across Africa. But Tanzania lags even other countries in Africa
(table 5).
Table 5. Infrastructure Indicators in Selected Countries in Sub-Saharan Africa
Country or country group
Households with fixed telephone (percent of
households)a
Mobile phones
(subscribers per 100 people)
b
Households with
electricity (percent
connected to network)
a
Roads (km per
1,000 km2 of
land)c
Access to improved sanitation
(percent of the population)
a
Access to improved
water source (percent of
the population)
a
Ghana 8 32 44 187 10 80
Kenya 12 30 13 111 42 57
Rwanda 1 7 5 568 23 65

- 24 -
South Africa 27 92 63 300 59 93
Tanzania 10 21 11 62 33 55
Uganda 3 18 8 385 33 64
Zambia 4 21 20 50 52 58
Sub-Saharan Africa
7 16 29 — 31 58
Sub-Saharan Africa low income
d
6 19 26 — 15 25
Sub-Saharan Africa middle income
d
19 36 55 — 41 66
Source: World Bank Africa Infrastructure Country Diagnostic Database and World Bank various years. Note: — Not available.
a. Data are from Demographic and Health Surveys, latest available year for 2001–08.
b. Data are for 2006.
c. Data are for latest available year 2001–08.
d. Income groups are based on World Bank classification
Where will growth come from? Studies of potential growth drivers for Tanzania (Mbelle and
others 2010, for example) highlight a combination of agriculture, tourism, transport, and
mining, with a focus on developing manufacturing/value addition activities. The identified
sectors largely reflect physical/geographical endowments, with existing activities in these
sectors fairly nascent—only a small portion of Tanzania’s natural resource endowments are
being exploited—and often characterized by low productivity. In many countries developing
agriculture has been key to ensuring sustained progress toward the MDGs (World Bank
2005). Tanzania has decided to emphasize agriculture, having launched the Kilimo Kwanza
(Agriculture First) campaign designed to accelerate reforms in the sector, including
expanding input subsidy programs and significant investments in irrigation.
Meeting Macroeconomic Challenges
Addressing the infrastructure deficit will be expensive and will likely require funding beyond
that likely to be available on the highly concessional terms at which Tanzania has been
borrowing. The additional funds could come from many potential sources, including donor-
financed projects, local or international bonds, and public-private partnerships (see Ter-
Minassian, Hughes, and Hajdenberg 2008). Countries in Sub-Saharan Africa are increasingly

- 25 -
accessing international capital markets, in several cases in the context of IMF–supported
programs (see Redifer 2010). Whatever the source of financing, it will be critical to ensure
strong government processes for project selection, planning, and implementation and
effective debt management to maximize the probability of a strong economic return while
containing macroeconomic risks. Additional capacity to monitor risks in public-private
parternships will also be important to avoid the emergence of potentially significant
contingent liabilities (the track record of such parternships in Tanzania and more generally in
Sub-Saharan Africa is littered with examples of projects in which the host government ended
up either simply taking over the project or having to renegotiate in order to provide better
terms for the private sector partner) (see Gratwick and Eberhard 2008).
Fiscal pressures—not just from infrastructure spending but also from growing demand for
public services as a result of high population growth—could be eased by mobilizing
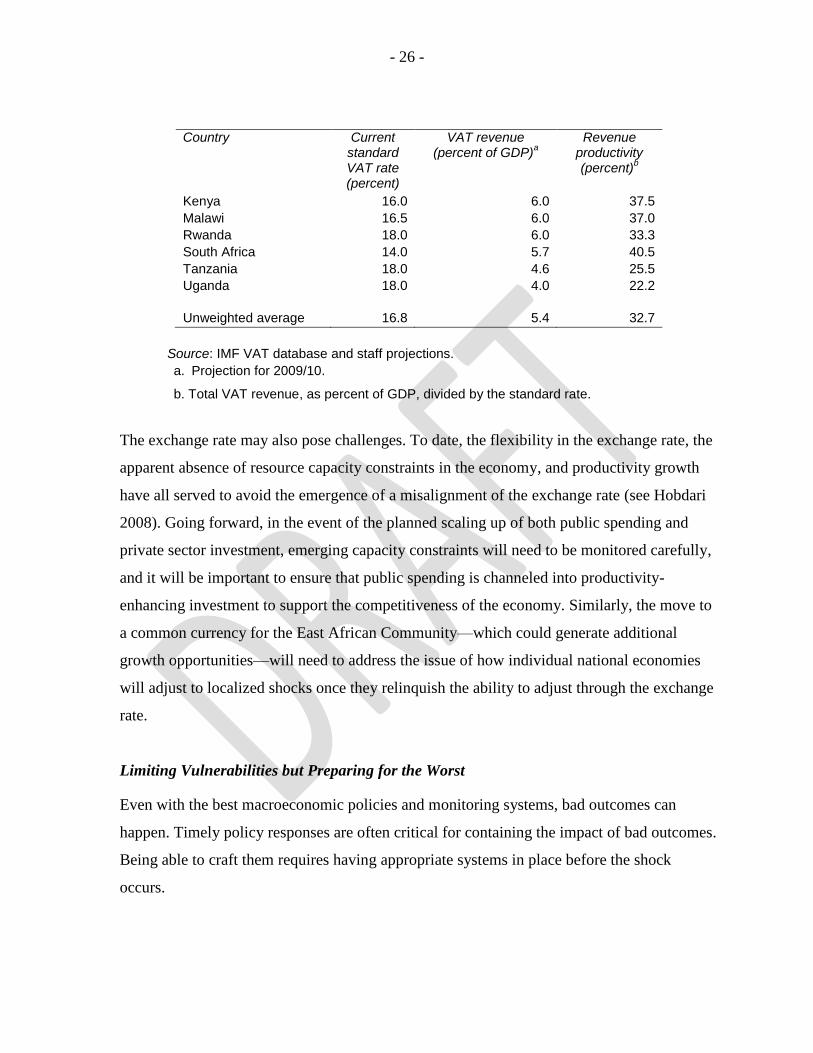
additional domestic resources. Estimates of tax potential suggest that revenues could reach
21 percent of GDP, almost 5 percentage points more than current collections (IMF 2010c).7
A big part of the revenue loss stems from exemptions, which amounted to 30 percent of tax
collections (3.5 percent of GDP) in 2007/08, according to estimates by the Tanzania
Revenue, making Tanzania’s VAT one of the least efficient in the region (table 6). A
possibly substantial upside is natural resource revenues: the mining sector is expanding
rapidly and, as exemptions are reined in and those for the more established mines expire, the
tax take can be expected to increase significantly. Close cooperation and transparency in the
granting of exemptions will also need to be tackled in the context of regional integration
efforts, in order to avoid a race to the bottom, with potential investors able to induce
neighboring governments to compete against one another on the physical location of
activities resulting in the erosion of the tax base.
Table 6. VAT Revenue and Revenue Productivity in Selected Countries in Sub-Saharan
Africa, 2009/10
- 26 -
Country Current standard VAT rate (percent)
VAT revenue (percent of GDP)
a
Revenue productivity (percent)
b
Kenya 16.0 6.0 37.5
Malawi 16.5 6.0 37.0
Rwanda 18.0 6.0 33.3
South Africa 14.0 5.7 40.5
Tanzania 18.0 4.6 25.5
Uganda 18.0 4.0 22.2
Unweighted average 16.8 5.4 32.7
Source: IMF VAT database and staff projections.
a. Projection for 2009/10.
b. Total VAT revenue, as percent of GDP, divided by the standard rate.
The exchange rate may also pose challenges. To date, the flexibility in the exchange rate, the
apparent absence of resource capacity constraints in the economy, and productivity growth
have all served to avoid the emergence of a misalignment of the exchange rate (see Hobdari
2008). Going forward, in the event of the planned scaling up of both public spending and
private sector investment, emerging capacity constraints will need to be monitored carefully,
and it will be important to ensure that public spending is channeled into productivity-
enhancing investment to support the competitiveness of the economy. Similarly, the move to
a common currency for the East African Community—which could generate additional
growth opportunities—will need to address the issue of how individual national economies
will adjust to localized shocks once they relinquish the ability to adjust through the exchange
rate.
Limiting Vulnerabilities but Preparing for the Worst
Even with the best macroeconomic policies and monitoring systems, bad outcomes can
happen. Timely policy responses are often critical for containing the impact of bad outcomes.
Being able to craft them requires having appropriate systems in place before the shock
occurs.
- 27 -
In the financial sector, Tanzania’s basic crisis resolution framework, together with a deposit
insurance scheme, was able to handle failures of individual banks. It should be continuously
reviewed to ensure that it can meet potential risks; there is room to further strengthen
banking supervision, including risk analysis and enforcement of prudential requirements,
while addressing staffing constraints (IMF 2010b).
The absence of effective oversight of pension funds is a critical deficiency in the current
regulatory framework. Little information is available on the financial position of pension
funds, their role in capital markets, and potentially large fiscal liabilities.
With the increasing integration of the financial system of the East African Community, there
is also a need to ensure that a coordinated policy response/intervention can be orchestrated in
the event of, say, pressure on a systemic institution. The initial difficulty in agreeing on a
coordinated response was perhaps one of the key features of the global financial crisis.
More generally, a well-defined social safety net can help protect the most vulnerable in the
event of economic downturns. All of these responses require policy flexibility. Retaining the
policy buffers that were used to such good effect during the global financial crisis is critical
for the conduct of countercyclical policy and the ability to prevent an adverse shock from
derailing the economy’s growth momentum.
Conclusion
Tanzania has seen unprecedented sustained growth acceleration since 1996. Several major
(real and financial) reforms played a pivotal role in the take-off. Maintaining macroeconomic
stability was a critical component in sustaining growth. Navigating the post–1996 period has
involved the development of new policy instruments, as the nature of the economy changed
and legacy constraints have been eased.

- 28 -
Is another 15 years of uninterrupted growth likely? Untapped growth potential clearly
remains, and the policy space that has been developed over the last decade or so can provide
needed support.

- 29 -
References
Abbas, S., M. Ali, and Y. Sobolev. 2008. ―High and Volatile Treasury Yields in Tanzania:
The Role of Strategic Bidding and Auction Microstructure.‖ IMF Working Paper 08/81,
International Monetary Fund, Washington, DC.
Bai, J., and P. Perron. 1998. ―Estimating and Testing Linear Models with Multiple Structural
Changes.‖ Econometrica 66: 47–78.
Berg, A., D., J. Ostry, and J. Zettelmeyer. 2008. ―What Makes Growth Sustained?‖ IMF
Working Paper 08/59, International Monetary Fund, Washington, DC.
Drummond, Paulo, A. Mrema, S. Roudet, and M. Saito. 2009. Foreign Exchange Reserve
Adequacy in East African Community Countries. African Departmental Paper 09/01,
International Monetary Fund, Washington, DC.
Easterly, W., M. Kremer, L. Pritchett, and L. H. Summers. 1993. ―Good Policy or Good
Luck? Country Growth Performance and Temporary Shocks.‖ Journal of Monetary
Economics 32 (3): 459–483.
Gratwick, K. N., and A. Eberhard. 2008. ―An Analysis of Independent Power Projects in
Africa: Understanding Development and Investment Outcomes.‖ Development Policy
Review 26 (3): 309-38.
Hausmann, R., L. Prichett, and D. Rodrik. 2005. ―Growth Accelerations.‖ Journal of
Economic Growth 10 (4): 303–29.
Hobdari, Niko. 2008. ―Tanzania’s Equilibrium Real Exchange Rate.‖ IMF Working Paper
08/138, International Monetary Fund, Washington, DC.
IMF (International Monetary Fund). 2004. ―Advancing Structural Reforms.‖ World
Economic Outlook (April), Washington, DC.
———. 2009. Structural Reforms and Economic Performance in Advanced and Developing
Countries. Occasional Paper 268, Washington, DC.
———. 2010a. ―Sub-Saharan Africa: Back to High Growth?‖ Regional Economic Outlook,
April, Washington, DC.
———. 2010b. Tanzania: Financial System Stability Assessment Update. IMF Country
Report 10/177.
———. 2010c. Tanzania: Seventh Review under the Policy Support Instrument, Second
Review under the Exogenous Shocks Facility, and Request for a New Three-Year Policy
Support Instrument. IMF Country Report 10/173, Washington, DC.
———. 2010d. World Economic Outlook, April. Washington, DC.
Lawson, A., D. Booth, M. Msuya, S. Wangwe, and T. Williamson. 2005. Does General
Budget Support Work? Evidence from Tanzania. Overseas Development Institute,
London.
Maliyamkono, T. L., and H. Mason. 2006. The Promise. Dar es Salaam: TEMA Publishers.

- 30 -
Mbelle, A. V. Y., L. Rutasitra, B. Makenda, R. Lokina, A. Naho, and Y. Aikaeli. 2010.
Analytical Study on the Drivers of Growth and Implications for Growth Strategy for
Mainland Tanzania. Mtei, Edwin. 2009. From Goatherd to Governor. Dar es Salaam:
Mkuki na Nyota Publishers.
Mwase, Nkunde, and Benno Ndulu. 2008. ―Tanzania: Explaining Four Decades of Episodic
Growth.‖ In The Political Economy of Economic growth in Africa 1960–2000, vol 2.,
Country Case Studies, ed. Ndulu, B, S. O’Connell, J. P. Azam, R. Bates, A. Fosu, J.
Gunning, and D. Njinkeu. Cambridge: Cambridge University Press.
National Audit Office. 2010. A Performance Audit Report on Health Care Centres Efficiency
in Tanzania. www.nao.go.tz
Nord, Roger, Yuri Sobolev, David Dunn, Alejandro Hajdenberg, Niko Hobdari, Samar
Maziad, and Stephane Roudet. 2009. Tanzania: The Story of an African Transition.
International Monetary Fund, Washington, DC.
Ostry, J. D., A. Prati, and A. Spilimbergo. 2009. Structural Reforms and Economic
Performance in Advanced and Developing Countries. IMF Occasional Paper 268,
Washington, DC.
Prati, Alessandro, Massimiliano Onorato, and Chris Papageorgiou. 2010. ―Which Reforms
Work and under What Institutional Environment? Evidence from a New Dataset on
Structural Reforms.‖ International Monetary Fund, Washington, DC.
Pritchett, Lance. 2000. ―Understanding Patterns of Economic Growth: Searching for Hills
among Plateaus, Mountains, and Plains.‖ World Bank Economic Review 14 (2): 221–50.
Redifer, Laure. 2010. ―New Financing Sources for Africa’s Infrastructure Deficit.‖ IMF
Survey July 21, Washington, DC.
Selassie, Abebe Aemro. 2008. ―Beyond Macroeconomic Stability: The Quest for
Industrialization in Uganda.‖ IMF Working Paper 08/231, International Monetary Fund,
Washington, DC.
Ter-Minassian, Teresa, Richard Hughes, and Alejandro Hajdenberg. 2008. ―Creating
Sustainable Fiscal Space for Infrastructure: The Case of Tanzania.‖ IMF Working Paper
08/256, International Monetary Fund, Washington, DC.
United Republic of Tanzania. 2009a.‖Millennium Development Goals Report, Mid-Way
Evaluation: 2000–2008.‖ www.tzdpg.or.tz/external/mkukuta-mkuza-review/studies-tors-
cvs.html.
———. 2009b. MKUKUTA Annual Implementation Report 2008/2009, Success in the Midst
of Turbulence. Dar es Salaam.
———. 2010. Public Expenditure Tracking Survey for Primary and Secondary Education in
Mainland Tanzania. Dar es Salaam.
World Bank. Various years. World Development Indicators. Washington, DC: World Bank.
2005. Agriculture and Achieving the Millennium Development Goals. Report 32729-GLB,
Agriculture and Rural Development Department, Washington, DC.

- 31 -
———. 2007. Tanzania: Sustaining and Sharing Economic Growth. Country Economic
Memorandum, Washington, DC.
———. 2009. Doing Business 2010, Tanzania. Washington, DC: World Bank.
<<A>>Notes
This chapter draws heavily on Nord and others (2009). The authors are grateful to Daehaeng Kim,
Saul Lizondo, Roger Nord, Laure Redifer, and World Bank reviewers for helpful comments.
1. To the authors’ knowledge, this is the first time Tanzania has been formally shown to have had an
―up-break‖ in 1996. Previous studies (Hausmann, Prichett, and Rodrik 2005; Berg, Ostry, and
Zettelmeyer 2008) failed to identify a break, probably because they used shorter time series.
2. Excellent descriptions of the reforms undertaken during these periods from varying perspectives
can be found in Maliyamkono and Mason (2006), Mtei (2010), Mwase and Ndulu (2008), and Nord
and others (2009).
3. A World Bank (2007) study identifies increases in higher education attainment as an important
contributor to growth.
4. The tax system has not been fully predictable for investors, because of fairly frequent changes in
administration—often designed to close loopholes—and the existence of a large number of tax
exemptions granted to particular sectors, subcategories of investors, and specific enterprises.
5. Government programs during this period, supported by the IMF (first under the Poverty Reduction
and Growth Facility, subsequently under the Policy Support Instrument), were designed in such a way
that a shortfall in foreign program financing automatically triggered the possibility of resort to high
domestic financing subject to a pre-agreed upper limit; in the event that foreign program financing
exceeded targets, the government was unconstrained in its ability to spend the additional financing
received.
6. The bank closures were Meridien Bank (in 1995), Tanzania Housing Bank (in 1995), Greenland
Bank (in 1999), and Delphis Bank (in 2003). Depositors were fully compensated in all cases, with the
resolutions of both Meridien Bank and Delphis Bank facilitated by the transfers of deposits to other
banks operating in Tanzania.
7. The models predict tax potential through a regression of the tax to GDP ratio on observable
structural characteristics of the economy, such as the size of the agricultural sector.