1 state of utah annual report on homelessness2018 · operation rio grande 5 the intersection of...
TRANSCRIPT

1
State of Utah Annual Report on
HOMELESSNESS2018
2
TABLE OF CONTENTSINTRODUCTION 3
HOMELESS DATA DASHBOARD 4
OPERATION RIO GRANDE 5
THE INTERSECTION OF INTERGENERATIONAL POVERTY AND HOMELESSNESS 6
UTILIZATION OF HOUSING RESOURCES 7Bed Utilization 7
Length of Stay in Emergency Shelter 8
HOUSING AFFORDABILITY 9
PERFORMANCE MEASURES 11
POINT-IN-TIME COUNT 21State Of Utah 22
Bear River Association of Governments (BRAG) LHCC 24
Carbon-Emery Counties LHCC 28
Davis County LHCC 32
Grand County LHCC 34
Iron County LHCC 36
Mountainland Association of Governments LHCC 40
Salt Lake County LHCC 44
San Juan County LHCC 46
Six County Association of Governments LHCC 48
Tooele County LHCC 52
Uintah Basin Association of Governments (UBAOG) LHCC 54
Washington County LHCC 58
Weber-Morgan County LHCC 60

3
INTRODUCTIONEach year the Housing and Community Development Division of the Utah Department of Workforce Services releases a report on the latest data related to people experiencing homelessness in the state. Current and accurate data is essential for making wise policy and service decisions. It helps to ensure that resources are being used effectively and that programs and initiatives are meeting goals and enhancing the opportunities for success.
This is never more true than when major changes are being made to services. Utah is in the midst of a significant shift in the delivery of homeless services, as the large, centralized downtown Salt Lake City emergency shelter is scheduled to close June 2019 and be replaced with three, smaller, population-specific homeless resource centers. The new centers will house essential services under one roof and will provide safe, secure facilities that fit into the neighborhoods where they are located. The system as a whole will refocus efforts on moving individuals and families out of emergency shelter and into a more stable housing situation as quickly as possible.
We hope that policy makers, homeless services providers and the regular citizens of Utah will use this report as a resource to become further engaged in issues surrounding homelessness. We want everyone to have the facts that they need to be informed participants in the discussion, as they help to shape their communities and serve those who are less fortunate. Utah is widely recognized as a state where people are service-oriented and give back to their neighborhoods and communities. Although not without their challenges, the three new homeless resource centers provide ample opportunity to provide input, give service and to support the self-sufficiency of Utahns experiencing homelessness.
Jonathan HardyDirector, Housing and Community Development DivisionUtah Department of Workforce Services
To learn more about how homelessness is measured and Utah’s programs and systems for addressing homelessness,
see Utah’s Approach to Homelessness at:
housing.utah.gov/reports
1
WORKFORCE
SERVICES HOUSING & COMMUNITY
DEVELOPMENT
Utah’s Approach toHOMELESSNESS
August 2018
4
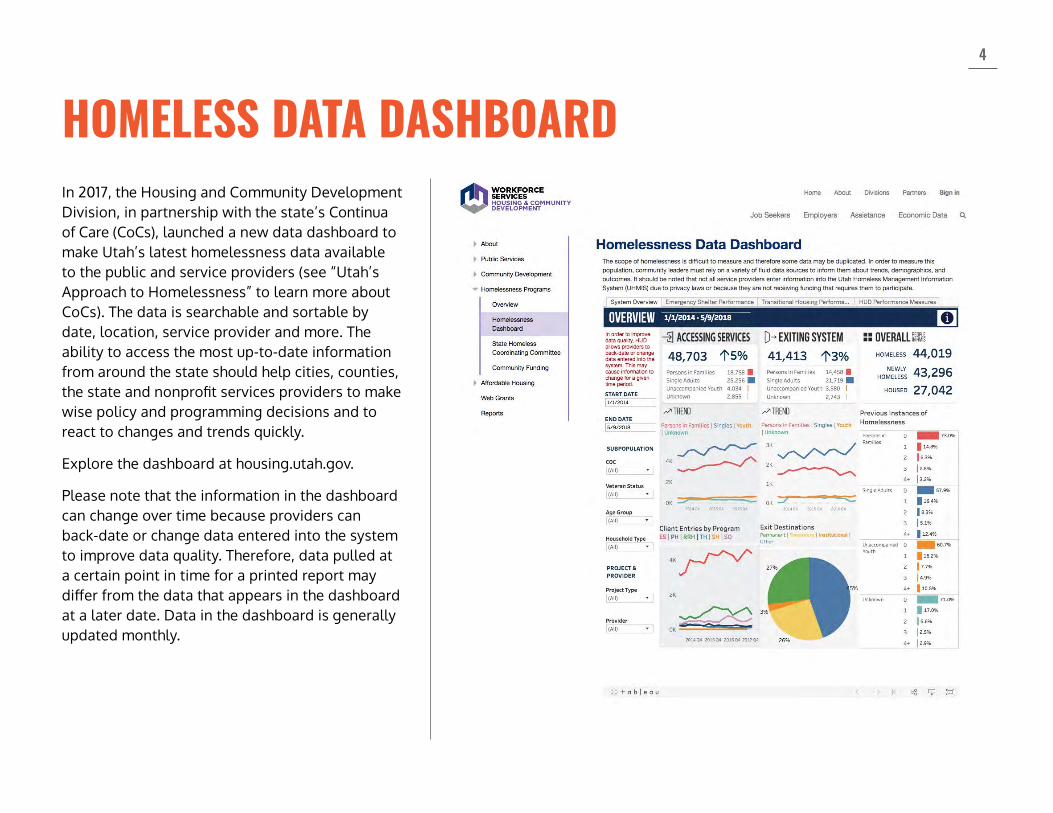
HOMELESS DATA DASHBOARDIn 2017, the Housing and Community Development Division, in partnership with the state’s Continua of Care (CoCs), launched a new data dashboard to make Utah’s latest homelessness data available to the public and service providers (see “Utah’s Approach to Homelessness” to learn more about CoCs). The data is searchable and sortable by date, location, service provider and more. The ability to access the most up-to-date information from around the state should help cities, counties, the state and nonprofit services providers to make wise policy and programming decisions and to react to changes and trends quickly.
Explore the dashboard at housing.utah.gov.
Please note that the information in the dashboard can change over time because providers can back-date or change data entered into the system to improve data quality. Therefore, data pulled at a certain point in time for a printed report may differ from the data that appears in the dashboard at a later date. Data in the dashboard is generally updated monthly.
5
OPERATION RIO GRANDEOperation Rio Grande launched August 14, 2017, with a three-phase plan to restore public safety in the Rio Grande District of Salt Lake City, after drug use and violence reached a tipping point in July 2017. As each phase progresses, the environment in the Rio Grande area improves for the individuals seeking supportive services to overcome homelessness. A dashboard report, updated monthly, is found at operationriogrande.utah.gov and tracks the outcomes for each phase.
The common goal to prevent and minimize homelessness is measured in two key areas.
1. Reduce the length of time people need shelter from the SFY 2017 baseline of 48.5 days
• Reduced to 43.5 days as of July 2018
2. Increase the number of successful exits from the shelter to housing from the SFY 2017 baseline of 119
• Increased to 138 as of July 2018
PHASE 1: PUBLIC SAFETY AND RESTORING ORDER is measured by comparing part one offenses (serious or frequent crimes) to a three-year average. By June 2018, part one crimes in the Rio Grande area were down 43 percent compared to the three-year average.
PHASE 2: ASSESSMENT AND TREATMENT supports people struggling with mental illness and drug addiction so they can return to a path of self-reliance. From August 2017 to June 2018:
• 243 treatment beds have been added
• 192 behavioral health assessments have been completed
• 105 individuals have pled into the Drug Court program
• 66 sober living residential beds have been added
• 92 individuals were placed in sober living
PHASE 3: DIGNITY OF WORK prepares and connects individuals to income that supports housing. From November 2017 to June 2018:
• 92 individuals became employed
• 309 job seekers developed an employment plan
Funding for short-term and long-term housing supports have achieved the following from August 2017 to June 2018:
• 352 individuals diverted from emergency shelter to immediate alternate housing arrangements
• 265 individuals have been housed
See the latest results at: operationriogrande.utah.gov

6
THE INTERSECTION OF INTERGENERATIONAL POVERTY AND HOMELESSNESSIn 2017, the Utah Legislature amended the Intergenerational Poverty Mitigation Act to include evaluation of the intersection between child homelessness and intergenerational poverty (IGP). The following data reflects that connection through housing mobility, utilization of homeless services and use of emergency shelter services among IGP families.
0%
2%
4%
6%
8%
IGP ADULTS IGP YOUNG ADULTS IGP KIDS
2014
2015
2016
2017
IGP USE OF HOMELESS SERVICESPeople in IGP Using Services Tracked in HMIS, 2014-2017
0%
10%
20%
30%
40%
EMERGENCY SHELTER HOMELESS PREVENTION PH-RAPID RE-HOUSING
2015 2016 2017
IGP USE OF SHELTER SERVICESPercent of Children in IGP Utilizing Shelter, 2015-2017
78%
41%
31%
22%
19%
4%
Frequent mobility from school to school
Inability to complete school assignmentsdue to lack of appropriate study area
Poor health/inadequate medical careresulting in poor school attendance
Behavior programs
Lack of awareness and sensitivity amongschool administrators and teachers to the
specific educational needs ofhomeless students
Lack of adequate school supplies
TOP CHALLENGES HOMELESS CHILDREN FACE IN ATTENDING SCHOOL
1
UTAH’S SIXTH ANNUAL REPORT
ON INTERGENERATIONAL POVERTY, WELFARE DEPENDENCY
AND THE USE OF PUBLIC ASSISTANCE • 2017
U TA H I N T E R G E N E R AT I O N A L W E L F A R E R E F O R M C O M M I S S I O N 2 0 1 7 R E P O RTTo learn more about intergenerational poverty, see the latest Intergenerational Poverty annual report at:
intergenerationalpoverty.utah.gov

7
UTILIZATION OF HOUSING RESOURCESBED UTILIZATIONOn January 24, 2018, each of Utah’s Continua of Care carried out the HUD-mandated Housing Inventory Count (HIC). The HIC compares the number of individuals spending the night in homeless services programs to the number of beds available in those programs on a specific night. This enables communities to generate a snapshot of their homeless service system’s capacity and the extent to which those resources are being utilized.
For more information on the HIC, please see “Utah’s Approach to Homelessness.”
2018 BED UTILIZATION RATESJANUARY 24, 2018
Number of beds and units available on the night of the Point-in-Time Count, including domestic violence providers:
• Emergency Shelters
• Transitional Housing
• Safe Havens
• Permanent Supportive Housing
• Rapid Re-Housing
• Other Permanent Housing
SALT LAKE COUNTY COC
40
84%
85%
100%
93%
66%
100%
100%
90%
66%
88%
100%
74%
Emergency Shelter
Transitional Housing
Rapid Re-Housing
Permanent Supportive Housing
Emergency Shelter
Transitional Housing
Rapid Re-Housing
Permanent Supportive Housing
Emergency Shelter
Transitional Housing
Rapid Re-Housing
Permanent Supportive Housing
MOUNTAINLAND COC
BALANCE OF STATE COC
WHAT IS COUNTED IN THE HIC:

8
UTILIZATION OF HOUSING RESOURCES
Emergency shelter programs are designed to provide overnight sleeping accommodations for the homeless. These accommodations may exist in a dedicated building or be provided by paying for motel stays. As emergency shelter is intended to provide short-term relief of a housing crisis, Utah emphasizes reducing the length of time that individuals and families spend in shelter and seeks to move individuals into more permanent housing as soon as possible. According to HMIS data from October 1, 2016 to September 30, 2017, 70 percent of homeless individuals and 51 percent of homeless families in Utah exit emergency shelter within one month of entering the shelter,
while only five percent of homeless individuals and five percent of homeless families stay in shelter for six or more months.
For more information on emergency shelter programs, please see “Utah’s Approach to Homelessness.”
LENGTH OF STAY IN EMERGENCY SHELTER
1 - 3 months
3 - 6 months
1 week or less
1 week - 1 month
6 - 9 months
9 - 12 months
Length of Stay
Individuals in Emergency Shelter
Persons in Families in Emergency Shelter
LENGTH OF STAY IN EMERGENCY SHELTER — OCTOBER 1, 2016 - SEPTEMBER 30, 2017
48%
28%
22%
23%
17%
32%
8%
13%
3%
4%
2%
1%
51% of homeless families exit emergency shelter within one month.

9
HOUSING AFFORDABILITYUtah has a shortage of affordable housing. Creating a sufficient supply of affordable units alleviates pressure on the homeless system by those who simply cannot afford rent. Affordable rent, as defined by HUD, is 30 percent of income. The average Fair Market Rent (FMR) in Utah for a two-bedroom apartment, as established by HUD for 2018, is $924 per month. The hourly wage needed to afford that rent was $17.77 per hour, but the average renter wage was $13.92 per hour (National Low Income Housing Coalition, “Out of Reach” 241). An affordability gap exists even among those employed at average renter wage. Most homeless individuals earn far less than this average renter wage. Many simply receive Supplemental Security Income, and affordability becomes that much more of a challenge. Unit affordability and availability is not an issue exclusive to the Wasatch Front but is a challenge faced by communities statewide. The credit and criminal histories that challenge many experiencing homelessness further limit unit availability.
See Utah’s complete report on affordable housing at housing.utah.gov/reports.
FAIR MARKET RENT BY METRO AREAMONTHLY FMR FOR A TWO-BEDROOM APARTMENT, FY 2018
METROPOLITAN AREA FMR FOR 2BDRM/MONTH
Box Elder County HMFA $697
Logan MSA $702
Ogden-Clearfield HMFA $882
Provo-Orem MSA $836
Salt Lake City HMFA $1,035
St. George MSA $863
Tooele County HMFA $849

10
HOUSING AFFORDABILITYUTAH FAIR MARKET RENT BY COUNTYMONTHLY FMR FOR A TWO-BEDROOM APARTMENT, FY 2018
AFFORDABILITY OF A TWO-BEDROOM APARTMENT
WAGES AND AFFORDABILITY OF FAIR MARKET RENT FORTWO BDRM/MONTH
Rent cost for two-bedroom apartment atFair Market Rent $924
Rent affordable with full-time job payingminimum wage $377
Rent affordable with full-time job payingmean renter wage $724
Rent affordable to household at 30%Area Median Income (AMI) $568
Rent affordable to SSI recipient $233
$697
$882$882
$882
$805
$849
$843$704
$863
$697
$1,035
$697
$702
$836
$836
$1,044
$1,177
$859
$805
$744
$697
$898
$697
$851
$953
$697
$720
$697
$715
11
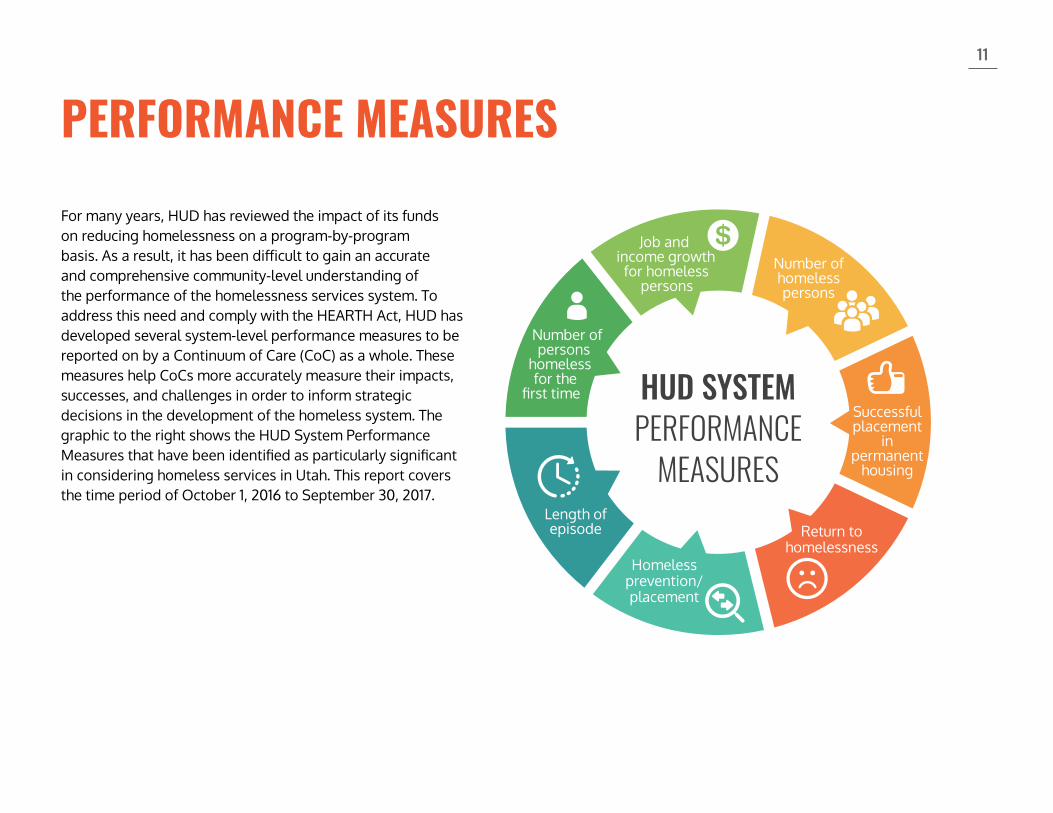
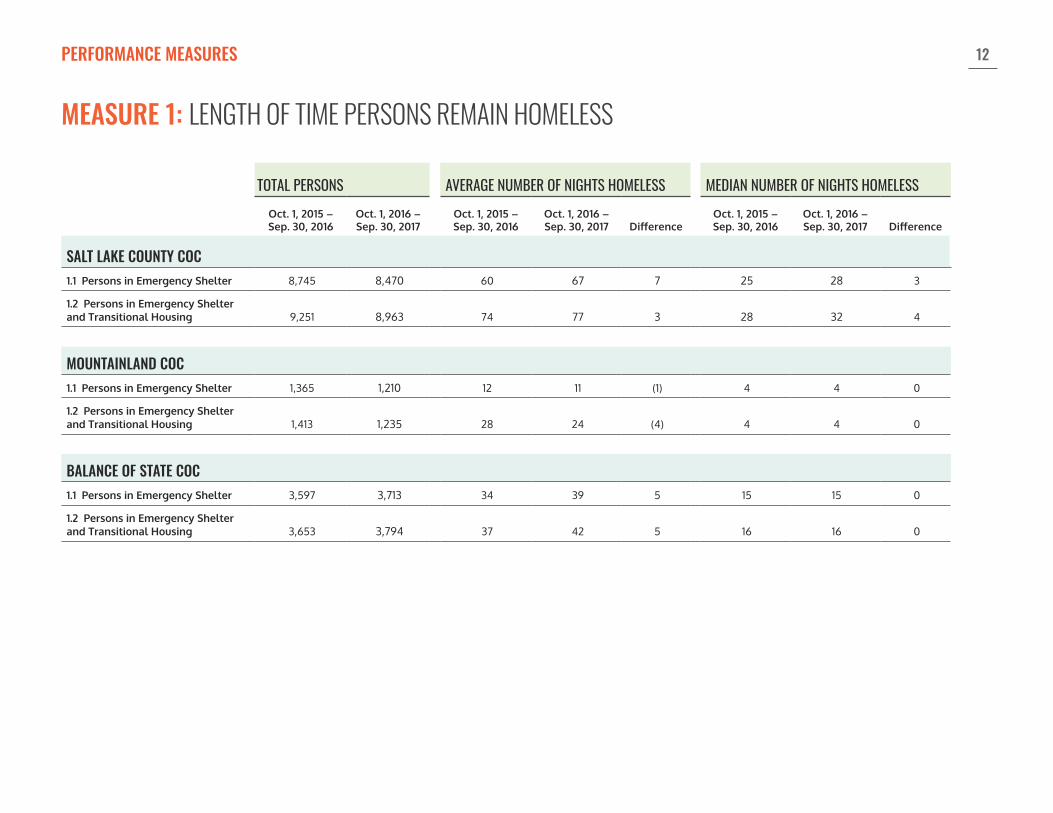
PERFORMANCE MEASURESFor many years, HUD has reviewed the impact of its funds on reducing homelessness on a program-by-program basis. As a result, it has been difficult to gain an accurate and comprehensive community-level understanding of the performance of the homelessness services system. To address this need and comply with the HEARTH Act, HUD has developed several system-level performance measures to be reported on by a Continuum of Care (CoC) as a whole. These measures help CoCs more accurately measure their impacts, successes, and challenges in order to inform strategic decisions in the development of the homeless system. The graphic to the right shows the HUD System Performance Measures that have been identified as particularly significant in considering homeless services in Utah. This report covers the time period of October 1, 2016 to September 30, 2017.
HUD SYSTEM PERFORMANCE
MEASURESLength of episode Return to
homelessness
Number of homeless persons
Job and income growth
for homeless persons
Number of persons
homeless for the
first time
Homeless prevention/placement
Successful placement
in permanent
housing
12
TOTAL PERSONS AVERAGE NUMBER OF NIGHTS HOMELESS MEDIAN NUMBER OF NIGHTS HOMELESSOct. 1, 2015 – Sep. 30, 2016
Oct. 1, 2016 – Sep. 30, 2017
Oct. 1, 2015 – Sep. 30, 2016
Oct. 1, 2016 – Sep. 30, 2017 Difference
Oct. 1, 2015 – Sep. 30, 2016
Oct. 1, 2016 – Sep. 30, 2017 Difference
SALT LAKE COUNTY COC1.1 Persons in Emergency Shelter 8,745 8,470 60 67 7 25 28 3
1.2 Persons in Emergency Shelter and Transitional Housing 9,251 8,963 74 77 3 28 32 4
MOUNTAINLAND COC1.1 Persons in Emergency Shelter 1,365 1,210 12 11 (1) 4 4 0
1.2 Persons in Emergency Shelter and Transitional Housing 1,413 1,235 28 24 (4) 4 4 0
BALANCE OF STATE COC1.1 Persons in Emergency Shelter 3,597 3,713 34 39 5 15 15 0
1.2 Persons in Emergency Shelter and Transitional Housing 3,653 3,794 37 42 5 16 16 0
MEASURE 1: LENGTH OF TIME PERSONS REMAIN HOMELESS
PERFORMANCE MEASURES

13
PERSONS WHO EXITED TO A PERMANENT HOUSING DESTINATION IN THE 2 YEARS PRIOR
RETURNS TO HOMELESSNESS IN LESS THAN 6 MONTHS(0 - 180 DAYS)
RETURNS TO HOMELESSNESS FROM 6 TO 12 MONTHS(181 - 365 DAYS)
RETURNS TO HOMELESSNESS FROM 13 TO 24 MONTHS(366 - 730 DAYS)
NUMBER OF RETURNSIN 2 YEARS
# of Returns % of Returns # of Returns % of Returns # of Returns % of Returns # of Returns % of Returns
SALT LAKE COUNTY COCExit was from street outreach 33 19 58% 5 15% 3 9% 27 82%Exit was from emergency shelter 816 156 19% 122 15% 91 11% 369 45%Exit was from transitional housing 472 84 18% 38 8% 28 6% 150 32%Exit was from safe haven 9 2 22% 2 22% 1 11% 5 56%Exit was from permanent housing 1,237 263 21% 101 8% 92 7% 456 37%TOTAL Returns to Homelessness 2,567 524 20% 268 10% 215 8% 1,007 39%
MOUNTAINLAND COCExit was from street outreach 1 0 0% 1 100% 0 0% 1 100%Exit was from emergency shelter 398 102 26% 37 9% 40 10% 179 45%Exit was from transitional housing 33 4 12% 1 3% 2 6% 7 21%Exit was from safe haven 0 0 - 0 - 0 - 0 -Exit was from permanent housing 112 10 9% 5 4% 8 7% 23 21%TOTAL Returns to Homelessness 544 116 21% 44 8% 50 9% 210 39%
BALANCE OF STATE COCExit was from street outreach 13 0 0% 0 0% 1 8% 1 8%Exit was from emergency shelter 998 197 20% 72 7% 75 8% 344 34%Exit was from transitional housing 35 0 0% 4 11% 0 0% 4 11%Exit was from safe haven 0 0 - 0 - 0 - 0 -Exit was from permanent housing 698 15 2% 20 3% 37 5% 72 10%TOTAL Returns to Homelessness 1744 212 12% 96 6% 113 6% 421 24%
MEASURE 2: THE EXTENT TO WHICH PERSONS WHO EXIT HOMELESSNESS TO PERMANENT HOUSING DESTINATIONS RETURN TO HOMELESSNESSThis measures clients who exited street outreach, emergency shelter, transitional housing, safe haven, or permanent housing program to a permanent housing destination in the date range two years prior to the report date range. Of those clients, the measure reports on how many of them returned to homelessness as indicated in the HMIS for up to two years after their initial exit.
PERFORMANCE MEASURES

14PERFORMANCE MEASURES
JANUARY 2016 PIT COUNT JANUARY 2017 PIT COUNT JANUARY 2018 PIT COUNT 2017-2018 DIFFERENCE
SALT LAKE COUNTY COCTotal PIT Count of sheltered and unsheltered persons 1,891 2,047 1,804 (243)
Emergency Shelter Total 1,434 1,621 1,356 (265)
Safe Haven Total 0 0 0 0
Transitional Housing Total 400 265 312 47
Total Sheltered Count 1,834 1,886 1,668 (218)
Unsheltered Count 57 161 136 (25)
MOUNTAINLAND COCTotal PIT Count of sheltered and unsheltered persons 178 171 173 2
Emergency Shelter Total 76 67 64 (3)
Safe Haven Total 0 0 0 0
Transitional Housing Total 61 63 64 1
Total Sheltered Count 137 130 128 (2)
Unsheltered Count 41 41 45 4
BALANCE OF STATE COCTotal PIT Count of sheltered and unsheltered persons 738 647 899 252
Emergency Shelter Total 474 477 526 49
Safe Haven Total 0 0 0 0
Transitional Housing Total 126 81 134 53
Total Sheltered Count 600 558 660 102
Unsheltered Count 138 89 239 150
MEASURE 3: NUMBER OF HOMELESS PERSONSCHANGE IN PIT COUNTSThis measures the change in PIT counts of sheltered and unsheltered homeless persons as reported on the PIT, not from HMIS (see page 21 for more information on the PIT count).

15PERFORMANCE MEASURES
OCTOBER 1, 2015 TO SEPTEMBER 30, 2016
OCTOBER 1, 2016 TO SEPTEMBER 30, 2017 DIFFERENCE
SALT LAKE COUNTY COCUnduplicated Total sheltered homeless persons 9,382 9,081 (301)
Emergency Shelter Total 8,858 8,743 (115)
Safe Haven Total 1 0 (1)
Transitional Housing Total 650 404 (246)
MOUNTAINLAND COCUnduplicated Total sheltered homeless persons 1,455 1,272 (183)
Emergency Shelter Total 1,410 1,247 (163)
Safe Haven Total 0 0 0
Transitional Housing Total 115 86 (29)
BALANCE OF STATE COCUnduplicated Total sheltered homeless persons 3,783 3,892 109
Emergency Shelter Total 3,728 3,829 101
Safe Haven Total 0 0 0
Transitional Housing Total 65 79 14
MEASURE 3: NUMBER OF HOMELESS PERSONSCHANGE IN ANNUAL COUNTS This measures the change in annual counts of sheltered homeless persons in HMIS.

16PERFORMANCE MEASURES
OCTOBER 1, 2015 TO SEPTEMBER 30, 2016
OCTOBER 1, 2016 TO SEPTEMBER 30, 2017 DIFFERENCE
SALT LAKE COUNTY COCNumber of adults who remained enrolled in CoC-funded projects 335 380 45
Number of adults with increased total income 84 103 19
Percentage of adults who increased total income 25% 27% 2%
MOUNTAINLAND COCNumber of adults who remained enrolled in CoC-funded projects 74 51 -23
Number of adults with increased total income 14 25 11
Percentage of adults who increased total income 19% 49% 30%
BALANCE OF STATE COCNumber of adults who remained enrolled in CoC-funded projects 77 56 -21
Number of adults with increased total income 7 3 -4
Percentage of adults who increased total income 9% 5% -4%
MEASURE 4: EMPLOYMENT AND INCOME GROWTH FOR HOMELESS PERSONS IN COC PROGRAM-FUNDED PROJECTS CHANGE IN TOTAL INCOME FOR ADULT SYSTEM STAYERS

17PERFORMANCE MEASURES
OCTOBER 1, 2015 TO SEPTEMBER 30, 2016
OCTOBER 1, 2016 TO SEPTEMBER 30, 2017 DIFFERENCE
SALT LAKE COUNTY COCNumber of adults who exited CoC-funded projects 379 161 -218
Number of adults who exited with increased total income 142 54 -88
Percentage of adults who increased total income 37% 34% -3%
MOUNTAINLAND COCNumber of adults who exited CoC-funded projects 134 93 -41
Number of adults who exited with increased total income 58 44 -14
Percentage of adults who increased total income 43% 47% 4%
BALANCE OF STATE COCNumber of adults who exited CoC-funded projects 250 192 -58
Number of adults who exited with increased total income 84 81 -3
Percentage of adults who increased total income 34% 42% 8%
MEASURE 4: EMPLOYMENT AND INCOME GROWTH FOR HOMELESS PERSONS IN COC PROGRAM-FUNDED PROJECTS CHANGE IN TOTAL INCOME FOR ADULT SYSTEM LEAVERS

18PERFORMANCE MEASURES
OCTOBER 1, 2015 TO SEPTEMBER 30, 2016
OCTOBER 1, 2016 TO SEPTEMBER 30, 2017 DIFFERENCE
SALT LAKE COUNTY COCPersons entering emergency shelter, transitional housing, or permanent housing programs who did not have entries in emergency shelter, safe haven, transitional housing, or permanent housing projects in the previous 24 months.
5,899 5,457 -442
MOUNTAINLAND COCPersons entering emergency shelter, transitional housing, or permanent housing programs who did not have entries in emergency shelter, safe haven, transitional housing, or permanent housing projects in the previous 24 months.
1,246 1,110 -136
BALANCE OF STATE COCPersons entering emergency shelter, transitional housing, or permanent housing programs who did not have entries in emergency shelter, safe haven, transitional housing, or permanent housing projects in the previous 24 months.
3,720 3,566 -154
MEASURE 5: NUMBER OF PERSONS WHO BECOME HOMELESS FOR THE FIRST TIMEChange in the number of persons entering ES, SH, TH, and PH projects with no prior enrollments in HMIS

19PERFORMANCE MEASURES
OCTOBER 1, 2015 TO SEPTEMBER 30, 2016
OCTOBER 1, 2016 TO SEPTEMBER 30, 2017 DIFFERENCE
SALT LAKE COUNTY COCPercent of exits from street outreach programs to temporary, some institutional destinations, or permanent housing 10% 2% -8%
Percent of successful exits from emergency shelter, safe haven, transitional housing, and permanent housing: rapid re-housing programs to permanent housing 23% 17% -6%
Percentage of successful exits to or retention of permanent housing in permanent housing programs other than rapid re-housing 94% 94% 0%
MOUNTAINLAND COCPercent of exits from street outreach programs to temporary, some institutional destinations, or permanent housing 0% 0% 0%
Percent of successful exits from emergency shelter, safe haven, transitional housing, and permanent housing: rapid re-housing programs to permanent housing 43% 39% -4%
Percentage of successful exits to or retention of permanent housing in permanent housing programs other than rapid re-housing 81% 86% 5%
BALANCE OF STATE COCPercent of exits from street outreach programs to temporary, some institutional destinations, or permanent housing 26% 30% 4%
Percent of successful exits from emergency shelter, safe haven, transitional housing, and permanent housing: rapid re-housing programs to permanent housing 45% 43% -2%
Percentage of successful exits to or retention of permanent housing in permanent housing programs other than rapid re-housing 85% 87% 2%
MEASURE 7: SUCCESSFUL PLACEMENT FROM STREET OUTREACH AND SUCCESSFUL PLACEMENT IN OR RETENTION OF PERMANENT HOUSINGThis measures positive movement out of the homeless system and is divided into three tables: movement off the streets from Street Outreach (Metric 7a.1); movement into permanent housing situations from ES, SH, TH, and RRH(Metric 7b.1); and retention or exits to permanent housing situations from PH (other than PH-RRH).
The construction of measure 7b.1 has been updated per HUD’s specifications to include persons in any PH project type who exited without moving into housing(i.e. had a project start date, but no housing move -in date). HUD is aware that this may impact the change between these two years.
CHANGE IN EXIT TO OR RETENTION OF PERMANENT HOUSING

20

21
POINT-IN-TIME COUNTOn January 24, 2018, each of Utah’s Continua of Care carried out the HUD-mandated Point-in-Time Count (PIT). The PIT is a massive effort to count everyone who meets the HUD definition of literal homelessness in a community on a specific night. As a result, the PIT captures people who spent the night in an emergency shelter, transitional housing, or in a place not meant for human habitation. While many factors, from the weather to the way the count is organized and performed, influence the results of any given PIT count, the PIT is a useful tool in calculating the community’s need for homeless services on any given night. It is also one of the only tools available for measuring the number of homeless individuals who are not enrolled in homeless service programs. For more information on the PIT, please see “Utah’s Approach to Homelessness.”
HUD periodically updates the criteria it uses to determine who is included in specific subpopulations of the overall homeless population, such as youth and chronically homeless, counted in the PIT. The 2018 PIT guidance made a major change in the way HUD counted survivors of domestic violence. Where in past years HUD had communities report all individuals who identified as having experienced domestic violence in the past, HUD only included individuals who were currently fleeing a domestic violence situation in the 2018 PIT count of survivors. This redefinition resulted in Utah CoC’s reporting a much lower domestic violence count than in previous years, but does not necessarily indicate a reduction in the number of domestic violence survivors experiencing homelessness on that night.
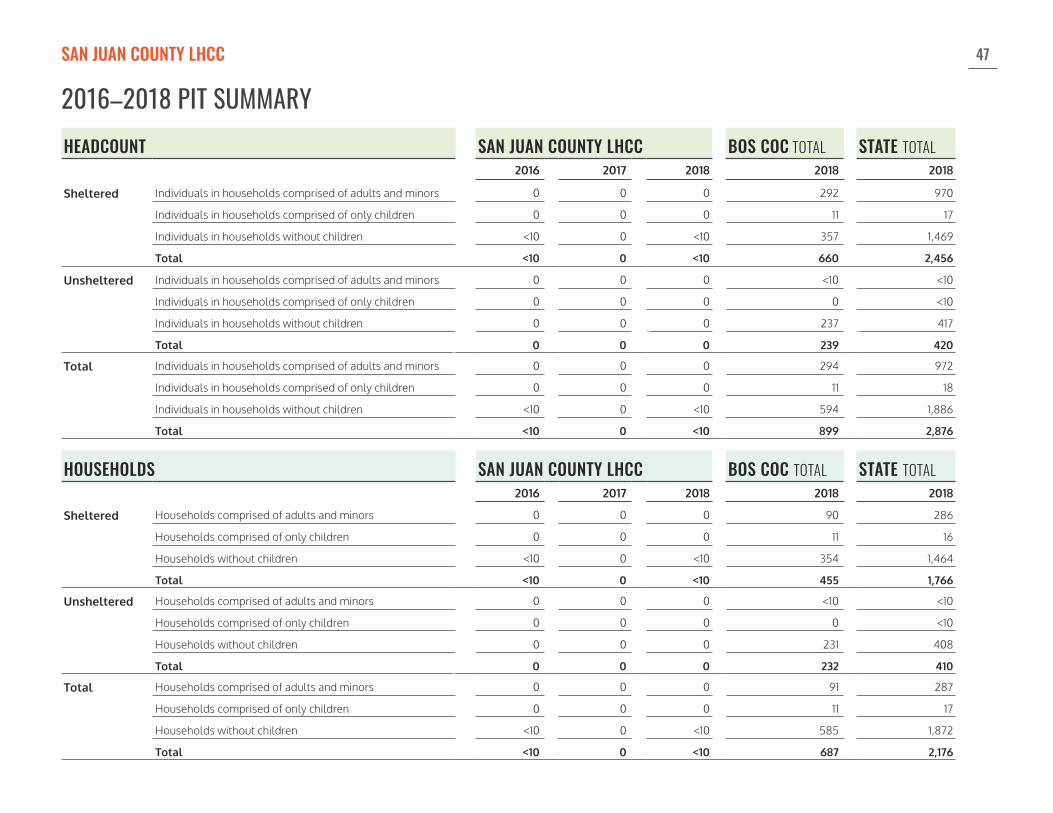
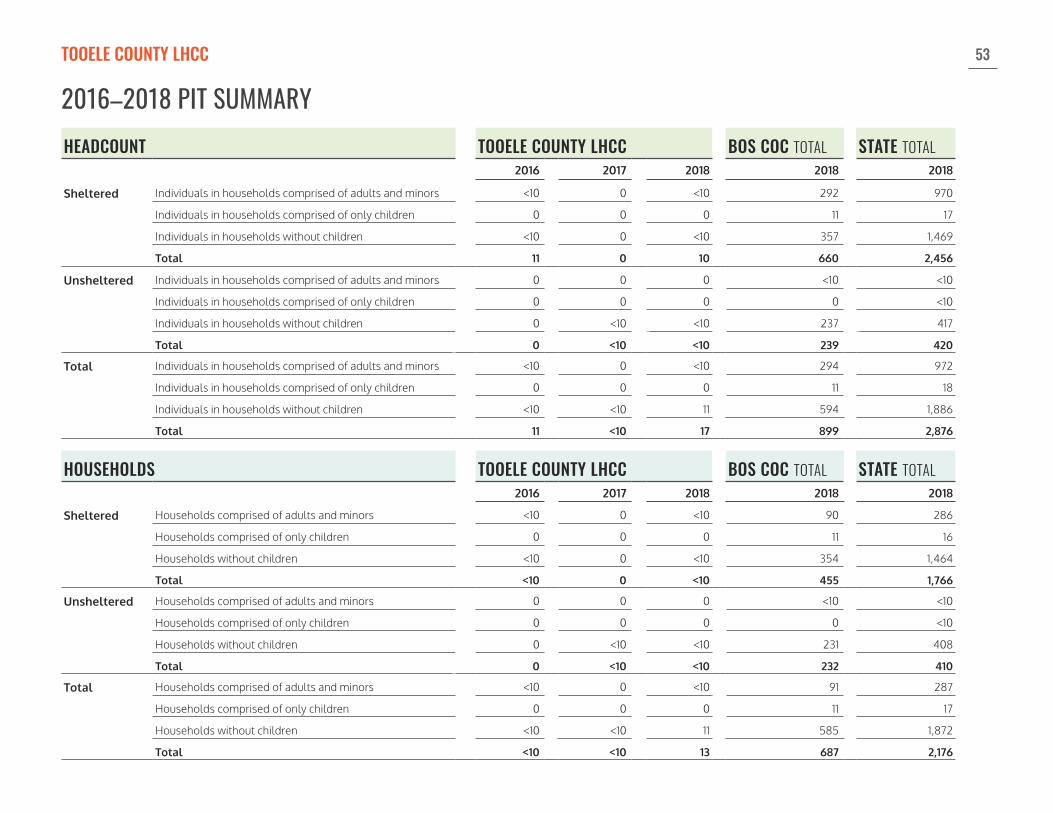
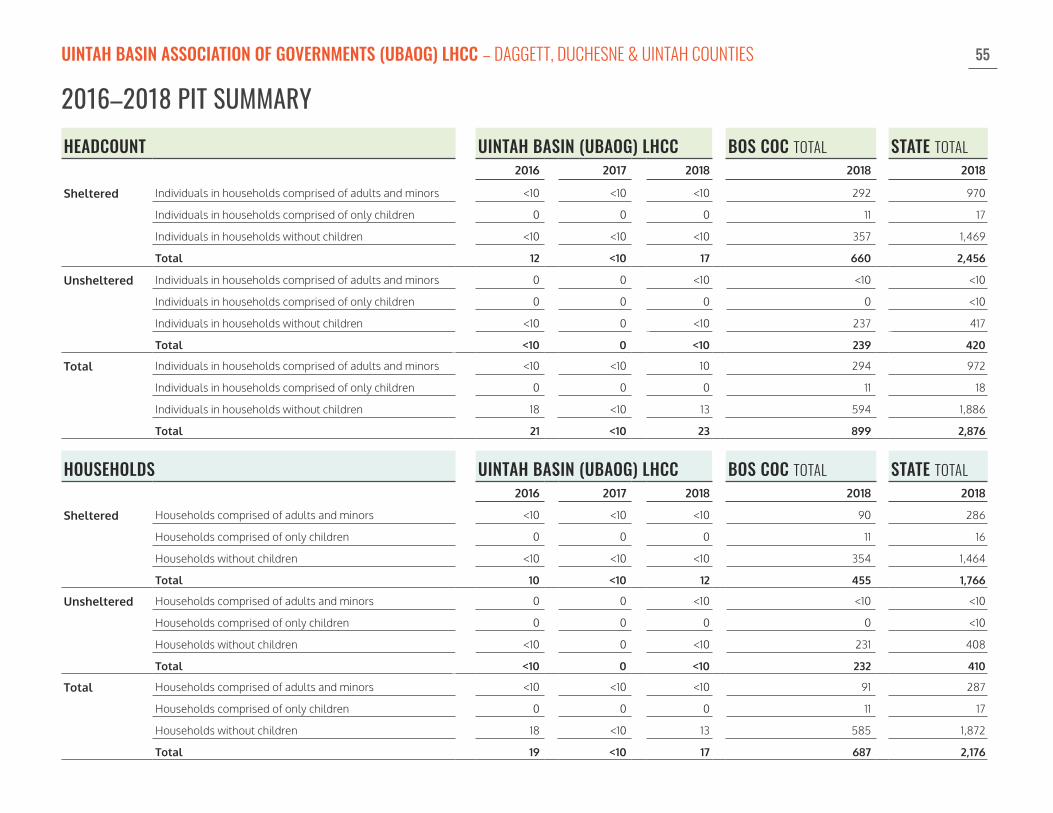
The following pages display the results of the PIT for the State of Utah as a whole, for each Local Homeless Coordinating Committee (LHCC), and then for each county. The state of Utah and LHCC profiles include data from the 2016, 2017, and 2018 PIT counts in order to provide some historical context. However, only 2018 PIT data is available for the county profiles, as this is the first year that data has been provided at that level. Results in any category that include less than 10 people are represented as <10 rather than the exact number. This has been done in order to protect the identities of those included in the count and prevent efforts to identify a specific individual or household from the aggregate data.
WHAT IS COUNTED IN THE PIT:
PERSONS IN:• Emergency Shelters
• Transitional Housing
• Safe Havens
• Unsheltered Persons (people who are staying in public or private places not designated for or ordinarily used as a regular sleeping accommodation for human beings, including cars, parks, abandoned buildings, bus or train stations, airports or camping grounds during the hours between sunset and sunrise)

22
HOMELESS SUBPOPULATIONS:2018 PIT COUNT
2018 HOUSING INVENTORY:NUMBER OF BEDS
NUMBER OF PERSONS
SUBPOPULATION Sheltered Unsheltered
Total Survivors of Domestic Violence 561 74
Adult Survivors of Domestic Violence 301 73
Adults with HIV/AIDS 15 <10
Adults with Substance Abuse Disorders 522 176
Adults with Mental Illness 747 184
Veterans 222 17
Chronically Homeless Veterans 16 <10
Chronically Homeless Persons in Households of Adults and Minors <10 0
Total Chronically Homeless Persons 219 87
Unaccompanied Youth(Under Age 24) 157 34
Youth Parent (Under Age 24) 37 <10
Children of a Youth Parent 51 <10
2,472
2,626
1,409
589
State of Utah
DATA SOURCES2016-2018 Utah Housing Inventory Counts
2016-2018 Utah Housing Inventory Counts
Utah Department of Workforce Services, Housing and Community Development Division, Homelessness Programs Office
STATE OF UTAH
TYPE OF HOUSINGEmergency Shelter
Transitional Housing
Permanent Supportive HousingRapid Re-Housing
23
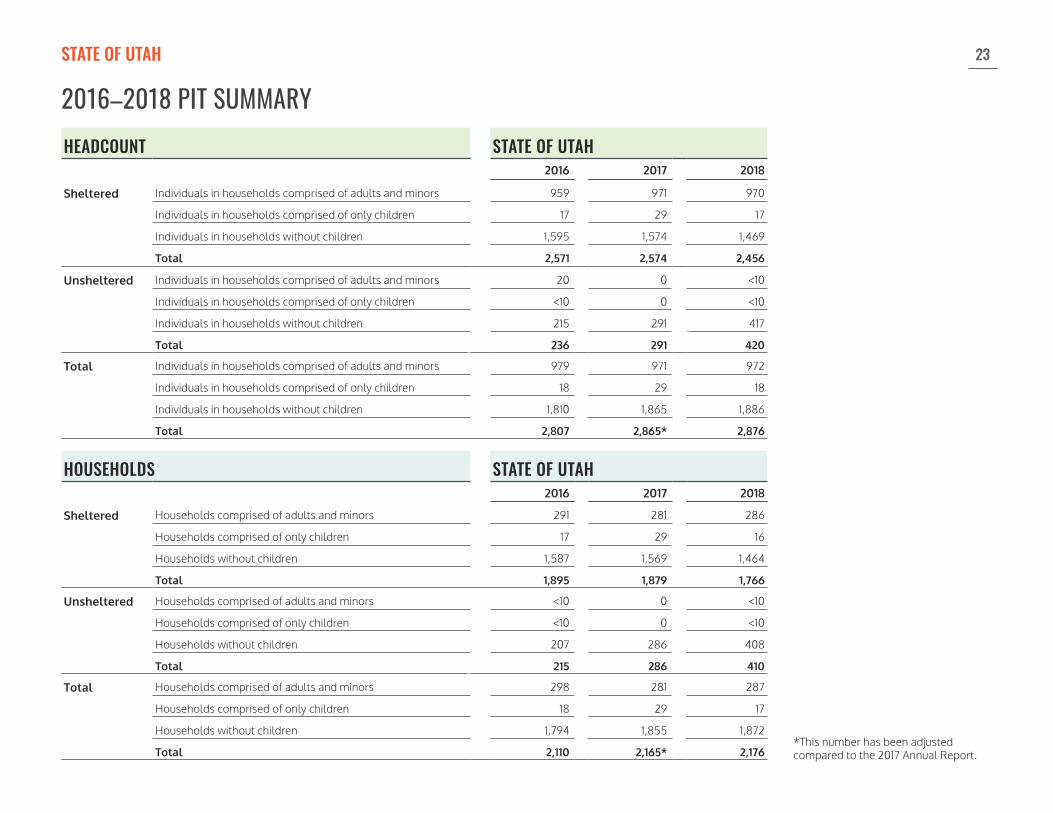
HEADCOUNT STATE OF UTAH2016 2017 2018
Sheltered Individuals in households comprised of adults and minors 959 971 970
Individuals in households comprised of only children 17 29 17
Individuals in households without children 1,595 1,574 1,469
Total 2,571 2,574 2,456
Unsheltered Individuals in households comprised of adults and minors 20 0 <10
Individuals in households comprised of only children <10 0 <10
Individuals in households without children 215 291 417
Total 236 291 420
Total Individuals in households comprised of adults and minors 979 971 972
Individuals in households comprised of only children 18 29 18
Individuals in households without children 1,810 1,865 1,886
Total 2,807 2,865* 2,876
HOUSEHOLDS STATE OF UTAH2016 2017 2018
Sheltered Households comprised of adults and minors 291 281 286
Households comprised of only children 17 29 16
Households without children 1,587 1,569 1,464
Total 1,895 1,879 1,766
Unsheltered Households comprised of adults and minors <10 0 <10
Households comprised of only children <10 0 <10
Households without children 207 286 408
Total 215 286 410
Total Households comprised of adults and minors 298 281 287
Households comprised of only children 18 29 17
Households without children 1,794 1,855 1,872
Total 2,110 2,165* 2,176
2016–2018 PIT SUMMARYSTATE OF UTAH
*This number has been adjusted compared to the 2017 Annual Report.

24
HOMELESS SUBPOPULATIONS:2018 PIT COUNT
2018 HOUSING INVENTORY:NUMBER OF BEDS
NUMBER OF PERSONSSUBPOPULATION Sheltered Unsheltered
Total Survivors of Domestic Violence 79 0
Adult Survivors of Domestic Violence 30 0
Adults with HIV/AIDS 0 0
Adults with Substance Abuse Disorders <10 <10
Adults with Mental Illness <10 <10
Veterans 0 0
Chronically Homeless Veterans 0 0
Chronically Homeless Persons in Households of Adults and Minors 0 0
Total Chronically Homeless Persons 0 0
Unaccompanied Youth(Under Age 24) <10 <10
Youth Parent (Under Age 24) 0 0
Children of a Youth Parent 0 0
71
51
49
BRAG LHCCBRAG LHCC
HOMELESS SHELTER & HOUSING PROVIDERSBear River Association of Governments (BRAG)
CAPSA
New Hope Crisis Shelter
BEAR RIVER ASSOCIATION OF GOVERNMENTS (BRAG) LHCC — BOX ELDER, CACHE & RICH COUNTIES
TYPE OF HOUSINGEmergency Shelter
Transitional Housing
Permanent Supportive HousingRapid Re-Housing

25
HEADCOUNT BRAG LHCC BOS COC TOTAL STATE TOTAL2016 2017 2018 2018 2018
Sheltered Individuals in households comprised of adults and minors 41 18 71 292 970
Individuals in households comprised of only children 0 0 0 11 17
Individuals in households without children <10 <10 <10 357 1,469
Total 50 22 79 660 2,456
Unsheltered Individuals in households comprised of adults and minors 0 0 0 <10 <10
Individuals in households comprised of only children 0 0 0 0 <10
Individuals in households without children <10 0 <10 237 417
Total <10 0 <10 239 420
Total Individuals in households comprised of adults and minors 41 18 71 294 972
Individuals in households comprised of only children 0 0 0 11 18
Individuals in households without children 11 <10 13 594 1,886
Total 52 22 84 899 2,876
HOUSEHOLDS BRAG LHCC BOS COC TOTAL STATE TOTAL2016 2017 2018 2018 2018
Sheltered Households comprised of adults and minors 12 6 19 90 286
Households comprised of only children 0 0 0 11 16
Households without children <10 <10 <10 354 1,464
Total 20 10 27 455 1,766
Unsheltered Households comprised of adults and minors 0 0 0 <10 <10
Households comprised of only children 0 0 0 0 <10
Households without children <10 0 <10 231 408
Total <10 0 <10 232 410
Total Households comprised of adults and minors 12 <10 19 91 287
Households comprised of only children 0 0 0 11 17
Households without children <10 <10 12 585 1,872
Total 21 10 31 687 2,176
2016–2018 PIT SUMMARYBEAR RIVER ASSOCIATION OF GOVERNMENTS (BRAG) LHCC – BOX ELDER, CACHE & RICH COUNTIES

26
HOMELESS SUBPOPULATIONS: 2018 PIT COUNT
2018 HOUSING INVENTORY: NUMBER OF BEDS
TYPE OF HOUSINGEmergency Shelter
Transitional Housing
Permanent Supportive Housing
Rapid Re-Housing
BOX ELDER NUMBER OF PERSONS CACHE NUMBER OF PERSONS RICH NUMBER OF PERSONSSUBPOPULATION Sheltered Unsheltered Sheltered Unsheltered Sheltered Unsheltered
Total Survivors of Domestic Violence 17 0 62 0 0 0
Adult Survivors of Domestic Violence <10 0 25 0 0 0
Adults with HIV/AIDS 0 0 0 0 0 0
Adults with Substance Abuse Disorders 0 0 <10 <10 0 0
Adults with Mental Illness <10 0 <10 <10 0 0
Veterans 0 0 0 0 0 0
Chronically Homeless Veterans 0 0 0 0 0 0
Chronically Homeless Persons in Households of Adults and Minors 0 0 0 0 0 0
Total Chronically Homeless Persons 0 0 0 0 0 0
Unaccompanied Youth (Under Age 24) 0 0 <10 <10 0 0
Youth Parent (Under Age 24) 0 0 0 0 0 0
Children of a Youth Parent 0 0 0 0 0 0
BOX ELDER, CACHE & RICH COUNTIES
17
Box elder
BOX ELDER
71
51
32
cache
CACHE
rich
0
RICH
27
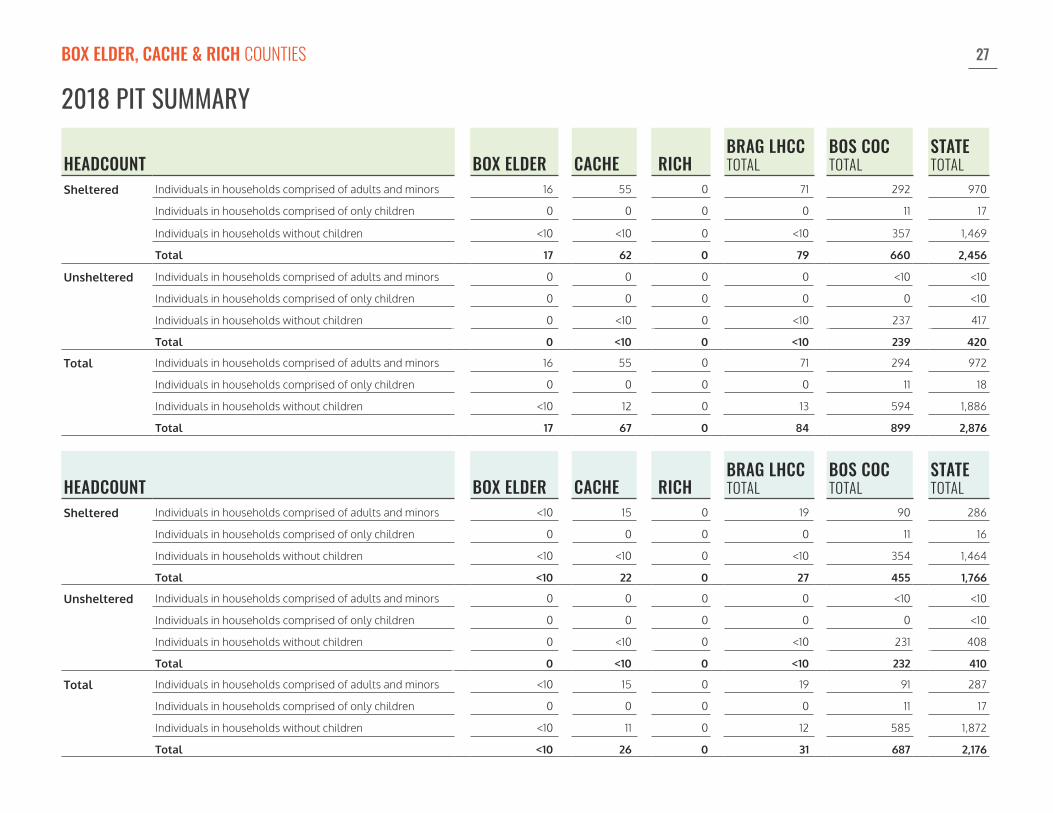
HEADCOUNT BOX ELDER CACHE RICHBRAG LHCC TOTAL
BOS COC TOTAL
STATE TOTAL
Sheltered Individuals in households comprised of adults and minors 16 55 0 71 292 970
Individuals in households comprised of only children 0 0 0 0 11 17
Individuals in households without children <10 <10 0 <10 357 1,469
Total 17 62 0 79 660 2,456
Unsheltered Individuals in households comprised of adults and minors 0 0 0 0 <10 <10
Individuals in households comprised of only children 0 0 0 0 0 <10
Individuals in households without children 0 <10 0 <10 237 417
Total 0 <10 0 <10 239 420
Total Individuals in households comprised of adults and minors 16 55 0 71 294 972
Individuals in households comprised of only children 0 0 0 0 11 18
Individuals in households without children <10 12 0 13 594 1,886
Total 17 67 0 84 899 2,876
HEADCOUNT BOX ELDER CACHE RICHBRAG LHCC TOTAL
BOS COC TOTAL
STATE TOTAL
Sheltered Individuals in households comprised of adults and minors <10 15 0 19 90 286
Individuals in households comprised of only children 0 0 0 0 11 16
Individuals in households without children <10 <10 0 <10 354 1,464
Total <10 22 0 27 455 1,766
Unsheltered Individuals in households comprised of adults and minors 0 0 0 0 <10 <10
Individuals in households comprised of only children 0 0 0 0 0 <10
Individuals in households without children 0 <10 0 <10 231 408
Total 0 <10 0 <10 232 410
Total Individuals in households comprised of adults and minors <10 15 0 19 91 287
Individuals in households comprised of only children 0 0 0 0 11 17
Individuals in households without children <10 11 0 12 585 1,872
Total <10 26 0 31 687 2,176
2018 PIT SUMMARYBOX ELDER, CACHE & RICH COUNTIES

28
HOMELESS SUBPOPULATIONS:2018 PIT COUNT
2018 HOUSING INVENTORY:NUMBER OF BEDS
NUMBER OF PERSONS
SUBPOPULATION Sheltered Unsheltered
Total Survivors of Domestic Violence <10 <10
Adult Survivors of Domestic Violence <10 <10
Adults with HIV/AIDS 0 0
Adults with Substance Abuse Disorders 0 <10
Adults with Mental Illness 0 <10
Veterans 0 0
Chronically Homeless Veterans 0 0
Chronically Homeless Persons in Households of Adults and Minors 0 0
Total Chronically Homeless Persons 0 0
Unaccompanied Youth (Under Age 24) 0 0
Youth Parent (Under Age 24) 0 0
Children of a Youth Parent 0 0
3
9
carbon emery LHCC
HOMELESS SHELTER & HOUSING PROVIDERSSoutheastern Utah Association of Local Governments
CARBON-EMERY COUNTIES LHCC
TYPE OF HOUSINGEmergency Shelter
Transitional Housing
Permanent Supportive HousingRapid Re-Housing

29
HEADCOUNT CARBON-EMERY COUNTIES LHCC BOS COC TOTAL STATE TOTAL2016 2017 2018 2018 2018
Sheltered Individuals in households comprised of adults and minors 0 0 <10 292 970
Individuals in households comprised of only children 0 0 0 11 17
Individuals in households without children <10 0 0 357 1,469
Total <10 0 <10 660 2,456
Unsheltered Individuals in households comprised of adults and minors 0 0 0 <10 <10
Individuals in households comprised of only children 0 0 0 0 <10
Individuals in households without children <10 0 <10 237 417
Total <10 0 <10 239 420
Total Individuals in households comprised of adults and minors 0 0 <10 294 972
Individuals in households comprised of only children 0 0 0 11 18
Individuals in households without children <10 0 <10 594 1,886
Total <10 0 <10 899 2,876
HOUSEHOLDS CARBON-EMERY COUNTIES LHCC BOS COC TOTAL STATE TOTAL2016 2017 2018 2018 2018
Sheltered Households comprised of adults and minors 0 0 <10 90 286
Households comprised of only children 0 0 0 11 16
Households without children <10 0 0 354 1,464
Total <10 0 <10 455 1,766
Unsheltered Households comprised of adults and minors 0 0 0 <10 <10
Households comprised of only children 0 0 0 0 <10
Households without children <10 0 <10 231 408
Total <10 0 <10 232 410
Total Households comprised of adults and minors 0 0 <10 91 287
Households comprised of only children 0 0 0 11 17
Households without children <10 0 <10 585 1,872
Total <10 0 <10 687 2,176
2016–2018 PIT SUMMARYCARBON-EMERY COUNTIES LHCC

30
HOMELESS SUBPOPULATIONS: 2018 PIT COUNT
2018 HOUSING INVENTORY: NUMBER OF BEDS
TYPE OF HOUSINGEmergency Shelter
Transitional Housing
Permanent Supportive Housing
Rapid Re-Housing
CARBON NUMBER OF PERSONS EMERY NUMBER OF PERSONSSUBPOPULATION Sheltered Unsheltered Sheltered Unsheltered
Total Survivors of Domestic Violence <10 <10 0 0
Adult Survivors of Domestic Violence <10 <10 0 0
Adults with HIV/AIDS 0 0 0 0
Adults with Substance Abuse Disorders 0 <10 0 0
Adults with Mental Illness 0 <10 0 0
Veterans 0 0 0 0
Chronically Homeless Veterans 0 0 0 0
Chronically Homeless Persons in Households of Adults and Minors 0 0 0 0
Total Chronically Homeless Persons 0 0 0 0
Unaccompanied Youth (Under Age 24) 0 0 0 0
Youth Parent (Under Age 24) 0 0 0 0
Children of a Youth Parent 0 0 0 0
CARBON & EMERY COUNTIES
3
9
carbon emery LHCC
CARBON
emery
0
EMERY
31
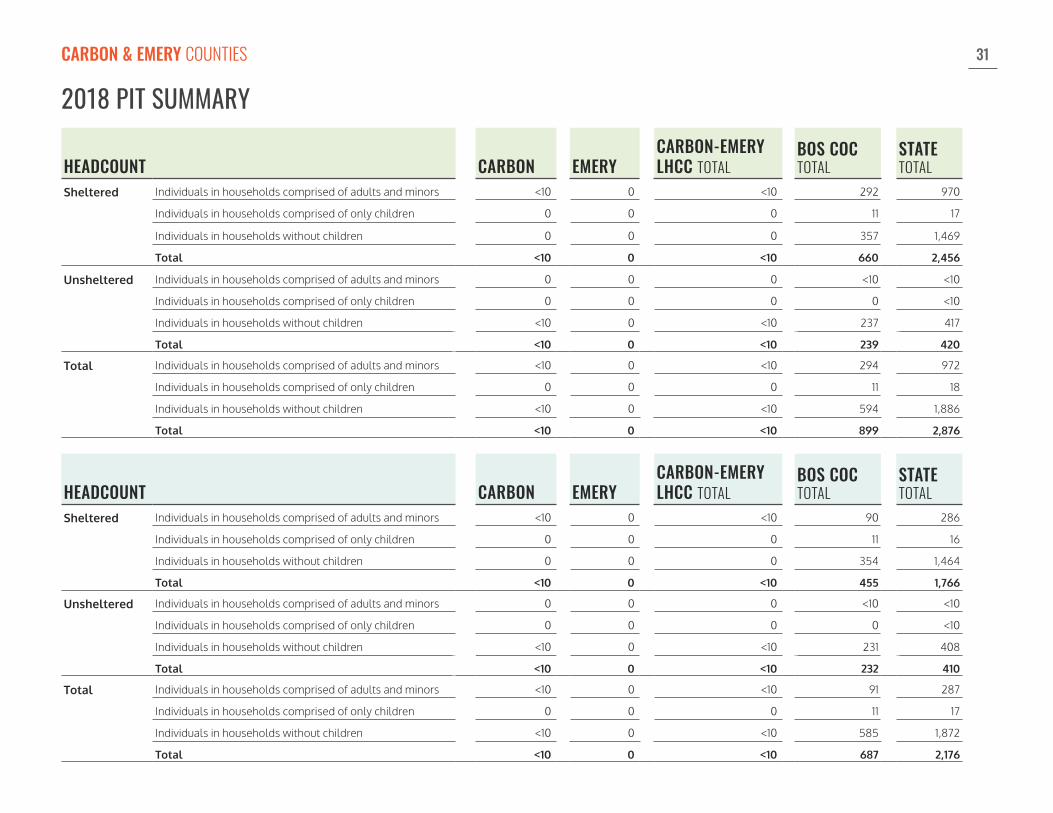
HEADCOUNT CARBON EMERYCARBON-EMERY LHCC TOTAL
BOS COC TOTAL
STATE TOTAL
Sheltered Individuals in households comprised of adults and minors <10 0 <10 292 970
Individuals in households comprised of only children 0 0 0 11 17
Individuals in households without children 0 0 0 357 1,469
Total <10 0 <10 660 2,456
Unsheltered Individuals in households comprised of adults and minors 0 0 0 <10 <10
Individuals in households comprised of only children 0 0 0 0 <10
Individuals in households without children <10 0 <10 237 417
Total <10 0 <10 239 420
Total Individuals in households comprised of adults and minors <10 0 <10 294 972
Individuals in households comprised of only children 0 0 0 11 18
Individuals in households without children <10 0 <10 594 1,886
Total <10 0 <10 899 2,876
HEADCOUNT CARBON EMERYCARBON-EMERY LHCC TOTAL
BOS COC TOTAL
STATE TOTAL
Sheltered Individuals in households comprised of adults and minors <10 0 <10 90 286
Individuals in households comprised of only children 0 0 0 11 16
Individuals in households without children 0 0 0 354 1,464
Total <10 0 <10 455 1,766
Unsheltered Individuals in households comprised of adults and minors 0 0 0 <10 <10
Individuals in households comprised of only children 0 0 0 0 <10
Individuals in households without children <10 0 <10 231 408
Total <10 0 <10 232 410
Total Individuals in households comprised of adults and minors <10 0 <10 91 287
Individuals in households comprised of only children 0 0 0 11 17
Individuals in households without children <10 0 <10 585 1,872
Total <10 0 <10 687 2,176
2018 PIT SUMMARYCARBON & EMERY COUNTIES

32
HOMELESS SUBPOPULATIONS:2018 PIT COUNT
2018 HOUSING INVENTORY:NUMBER OF BEDS
NUMBER OF PERSONS
SUBPOPULATION Sheltered Unsheltered
Total Survivors of Domestic Violence 54 <10
Adult Survivors of Domestic Violence 26 <10
Adults with HIV/AIDS 0 0
Adults with Substance Abuse Disorders <10 <10
Adults with Mental Illness 12 <10
Veterans 0 0
Chronically Homeless Veterans 0 0
Chronically Homeless Persons in Households of Adults and Minors 0 0
Total Chronically Homeless Persons 0 <10
Unaccompanied Youth (Under Age 24) <10 <10
Youth Parent (Under Age 24) <10 0
Children of a Youth Parent <10 0
54
4436
32
davis county
HOMELESS SHELTER & HOUSING PROVIDERSDavis Community Housing Authority
Open Doors
Safe Harbor
DAVIS COUNTY LHCC
TYPE OF HOUSINGEmergency Shelter
Transitional Housing
Permanent Supportive HousingRapid Re-Housing
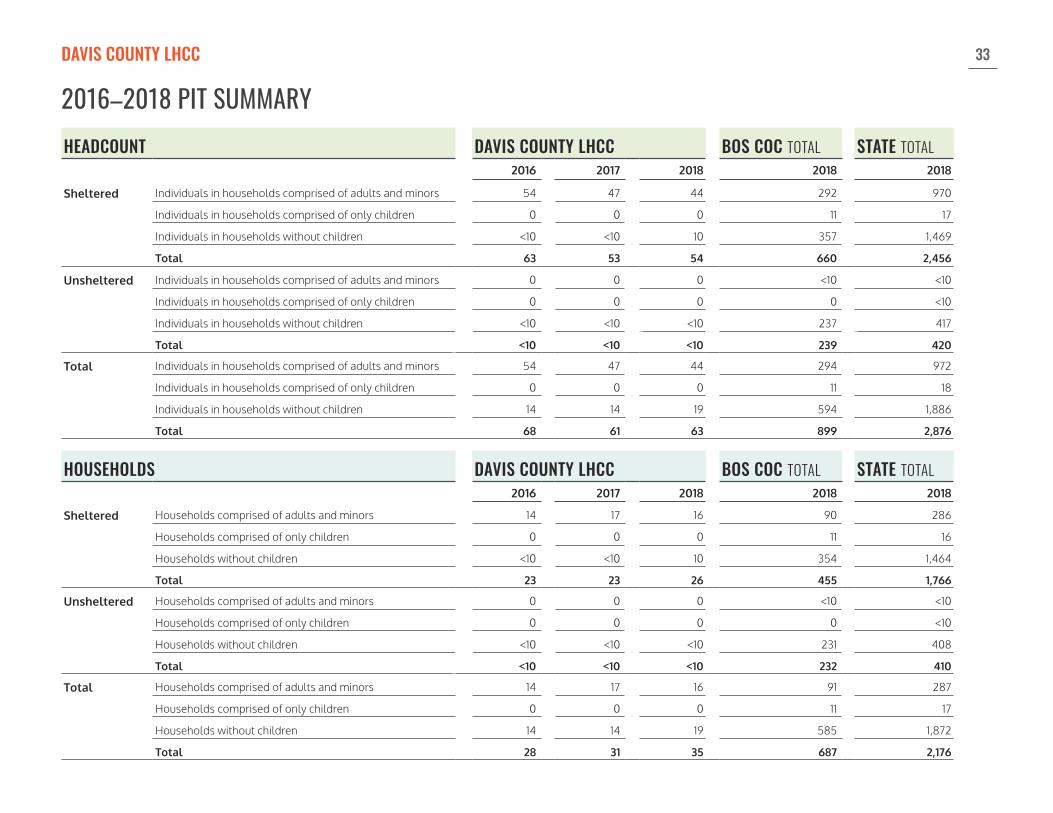
33
HEADCOUNT DAVIS COUNTY LHCC BOS COC TOTAL STATE TOTAL2016 2017 2018 2018 2018
Sheltered Individuals in households comprised of adults and minors 54 47 44 292 970
Individuals in households comprised of only children 0 0 0 11 17
Individuals in households without children <10 <10 10 357 1,469
Total 63 53 54 660 2,456
Unsheltered Individuals in households comprised of adults and minors 0 0 0 <10 <10
Individuals in households comprised of only children 0 0 0 0 <10
Individuals in households without children <10 <10 <10 237 417
Total <10 <10 <10 239 420
Total Individuals in households comprised of adults and minors 54 47 44 294 972
Individuals in households comprised of only children 0 0 0 11 18
Individuals in households without children 14 14 19 594 1,886
Total 68 61 63 899 2,876
HOUSEHOLDS DAVIS COUNTY LHCC BOS COC TOTAL STATE TOTAL2016 2017 2018 2018 2018
Sheltered Households comprised of adults and minors 14 17 16 90 286
Households comprised of only children 0 0 0 11 16
Households without children <10 <10 10 354 1,464
Total 23 23 26 455 1,766
Unsheltered Households comprised of adults and minors 0 0 0 <10 <10
Households comprised of only children 0 0 0 0 <10
Households without children <10 <10 <10 231 408
Total <10 <10 <10 232 410
Total Households comprised of adults and minors 14 17 16 91 287
Households comprised of only children 0 0 0 11 17
Households without children 14 14 19 585 1,872
Total 28 31 35 687 2,176
2016–2018 PIT SUMMARYDAVIS COUNTY LHCC
34
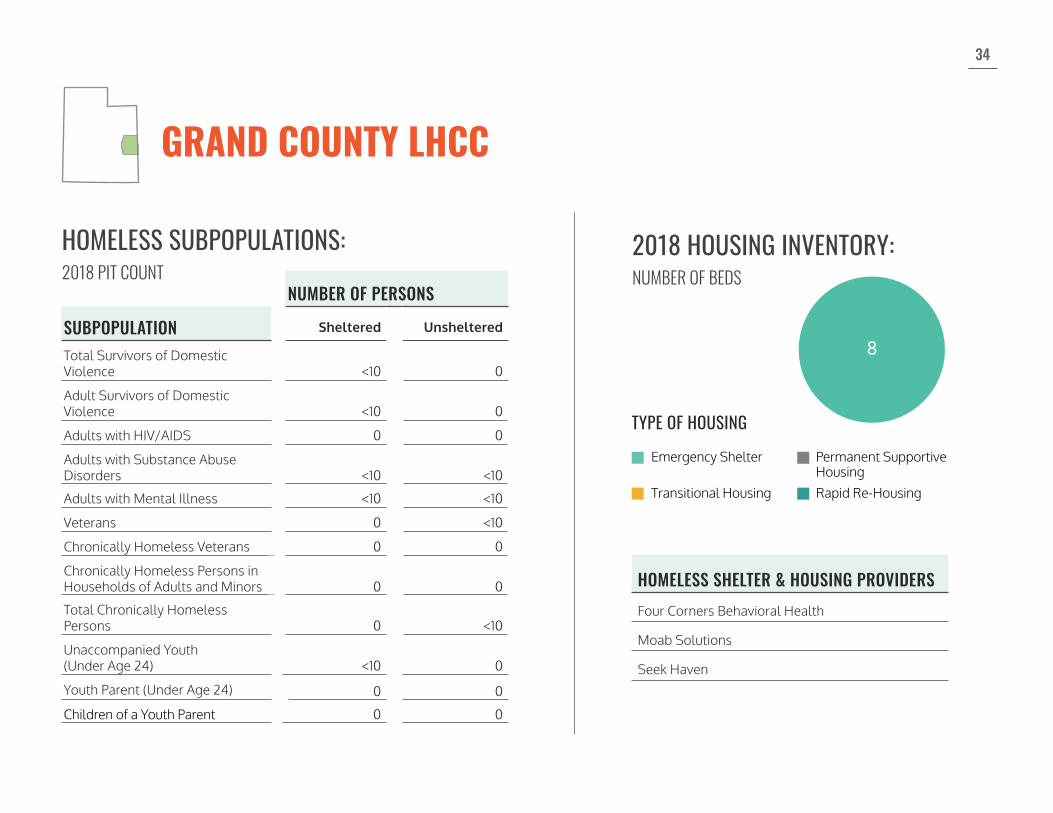
HOMELESS SUBPOPULATIONS:2018 PIT COUNT
2018 HOUSING INVENTORY:NUMBER OF BEDS
NUMBER OF PERSONS
SUBPOPULATION Sheltered Unsheltered
Total Survivors of Domestic Violence <10 0
Adult Survivors of Domestic Violence <10 0
Adults with HIV/AIDS 0 0
Adults with Substance Abuse Disorders <10 <10
Adults with Mental Illness <10 <10
Veterans 0 <10
Chronically Homeless Veterans 0 0
Chronically Homeless Persons in Households of Adults and Minors 0 0
Total Chronically Homeless Persons 0 <10
Unaccompanied Youth(Under Age 24) <10 0
Youth Parent (Under Age 24) 0 0
Children of a Youth Parent 0 0
grand
8
HOMELESS SHELTER & HOUSING PROVIDERSFour Corners Behavioral Health
Moab Solutions
Seek Haven
GRAND COUNTY LHCC
TYPE OF HOUSINGEmergency Shelter
Transitional Housing
Permanent Supportive HousingRapid Re-Housing
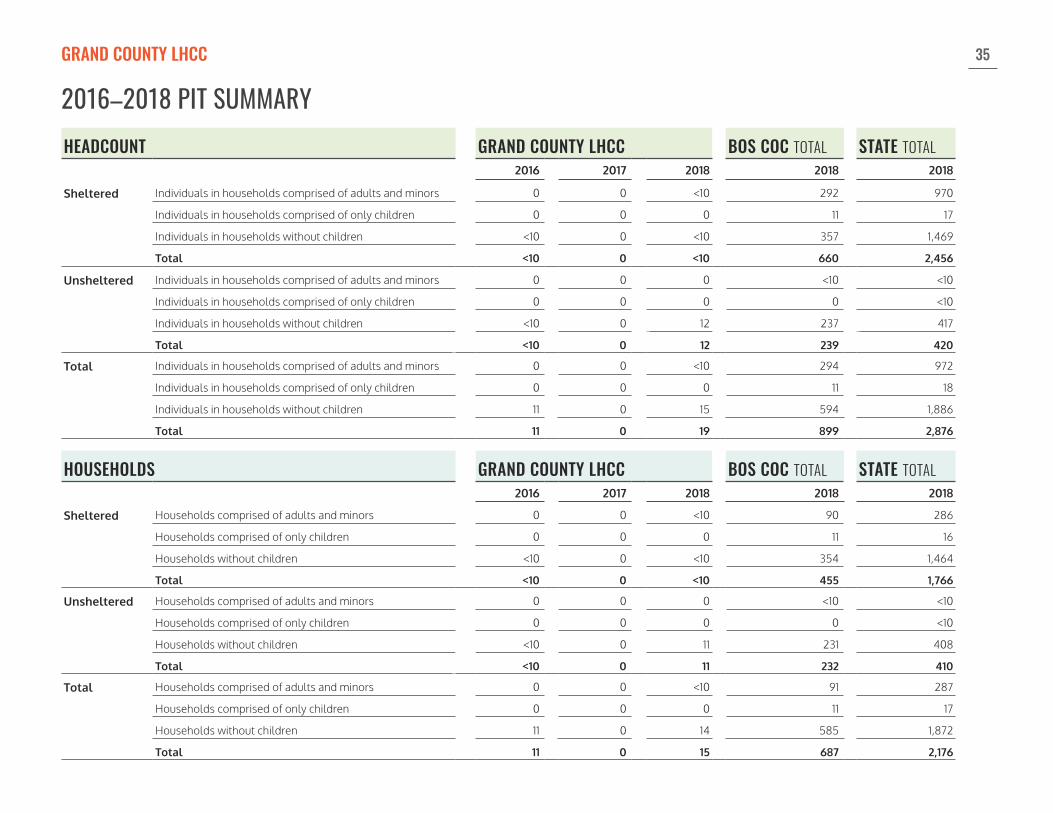
35
HEADCOUNT GRAND COUNTY LHCC BOS COC TOTAL STATE TOTAL2016 2017 2018 2018 2018
Sheltered Individuals in households comprised of adults and minors 0 0 <10 292 970
Individuals in households comprised of only children 0 0 0 11 17
Individuals in households without children <10 0 <10 357 1,469
Total <10 0 <10 660 2,456
Unsheltered Individuals in households comprised of adults and minors 0 0 0 <10 <10
Individuals in households comprised of only children 0 0 0 0 <10
Individuals in households without children <10 0 12 237 417
Total <10 0 12 239 420
Total Individuals in households comprised of adults and minors 0 0 <10 294 972
Individuals in households comprised of only children 0 0 0 11 18
Individuals in households without children 11 0 15 594 1,886
Total 11 0 19 899 2,876
HOUSEHOLDS GRAND COUNTY LHCC BOS COC TOTAL STATE TOTAL2016 2017 2018 2018 2018
Sheltered Households comprised of adults and minors 0 0 <10 90 286
Households comprised of only children 0 0 0 11 16
Households without children <10 0 <10 354 1,464
Total <10 0 <10 455 1,766
Unsheltered Households comprised of adults and minors 0 0 0 <10 <10
Households comprised of only children 0 0 0 0 <10
Households without children <10 0 11 231 408
Total <10 0 11 232 410
Total Households comprised of adults and minors 0 0 <10 91 287
Households comprised of only children 0 0 0 11 17
Households without children 11 0 14 585 1,872
Total 11 0 15 687 2,176
2016–2018 PIT SUMMARYGRAND COUNTY LHCC
36
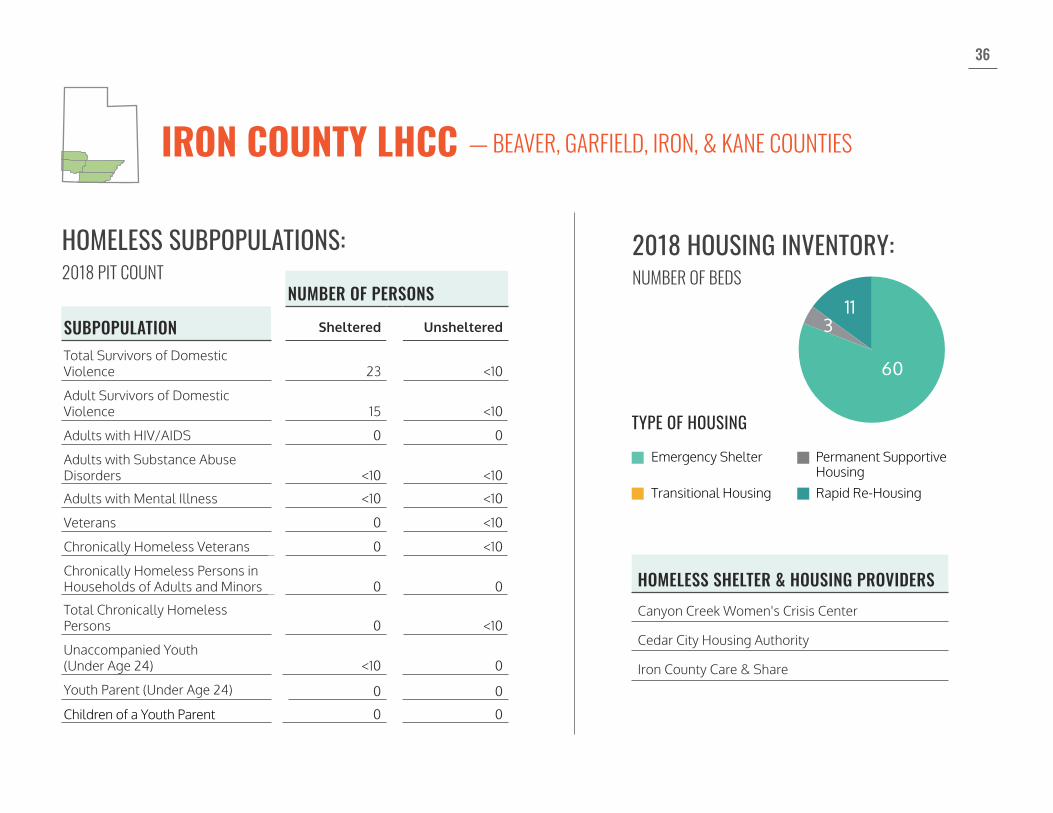
HOMELESS SUBPOPULATIONS:2018 PIT COUNT
2018 HOUSING INVENTORY:NUMBER OF BEDS
NUMBER OF PERSONS
SUBPOPULATION Sheltered Unsheltered
Total Survivors of Domestic Violence 23 <10
Adult Survivors of Domestic Violence 15 <10
Adults with HIV/AIDS 0 0
Adults with Substance Abuse Disorders <10 <10
Adults with Mental Illness <10 <10
Veterans 0 <10
Chronically Homeless Veterans 0 <10
Chronically Homeless Persons in Households of Adults and Minors 0 0
Total Chronically Homeless Persons 0 <10
Unaccompanied Youth(Under Age 24) <10 0
Youth Parent (Under Age 24) 0 0
Children of a Youth Parent 0 0
3
60
11
iron lhcc
HOMELESS SHELTER & HOUSING PROVIDERSCanyon Creek Women's Crisis Center
Cedar City Housing Authority
Iron County Care & Share
IRON COUNTY LHCC — BEAVER, GARFIELD, IRON, & KANE COUNTIES
TYPE OF HOUSINGEmergency Shelter
Transitional Housing
Permanent Supportive HousingRapid Re-Housing

37
HEADCOUNT IRON COUNTY LHCC BOS COC TOTAL STATE TOTAL2016 2017 2018 2018 2018
Sheltered Individuals in households comprised of adults and minors 19 14 12 292 970
Individuals in households comprised of only children 0 0 0 11 17
Individuals in households without children 24 15 20 357 1,469
Total 43 29 32 660 2,456
Unsheltered Individuals in households comprised of adults and minors 0 0 0 <10 <10
Individuals in households comprised of only children 0 0 0 0 <10
Individuals in households without children <10 0 10 237 417
Total <10 0 10 239 420
Total Individuals in households comprised of adults and minors 19 14 12 294 972
Individuals in households comprised of only children 0 0 0 11 18
Individuals in households without children 28 15 30 594 1,886
Total 47 29 42 899 2,876
HOUSEHOLDS IRON COUNTY LHCC BOS COC TOTAL STATE TOTAL2016 2017 2018 2018 2018
Sheltered Households comprised of adults and minors <10 <10 <10 90 286
Households comprised of only children 0 0 0 11 16
Households without children 24 15 20 354 1,464
Total 30 19 24 455 1,766
Unsheltered Households comprised of adults and minors 0 0 0 <10 <10
Households comprised of only children 0 0 0 0 <10
Households without children <10 0 <10 231 408
Total <10 0 <10 232 410
Total Households comprised of adults and minors <10 <10 <10 91 287
Households comprised of only children 0 0 0 11 17
Households without children 28 15 29 585 1,872
Total 34 19 33 687 2,176
2016–2018 PIT SUMMARYIRON COUNTY LHCC – BEAVER, GARFIELD, IRON & KANE COUNTIES
38
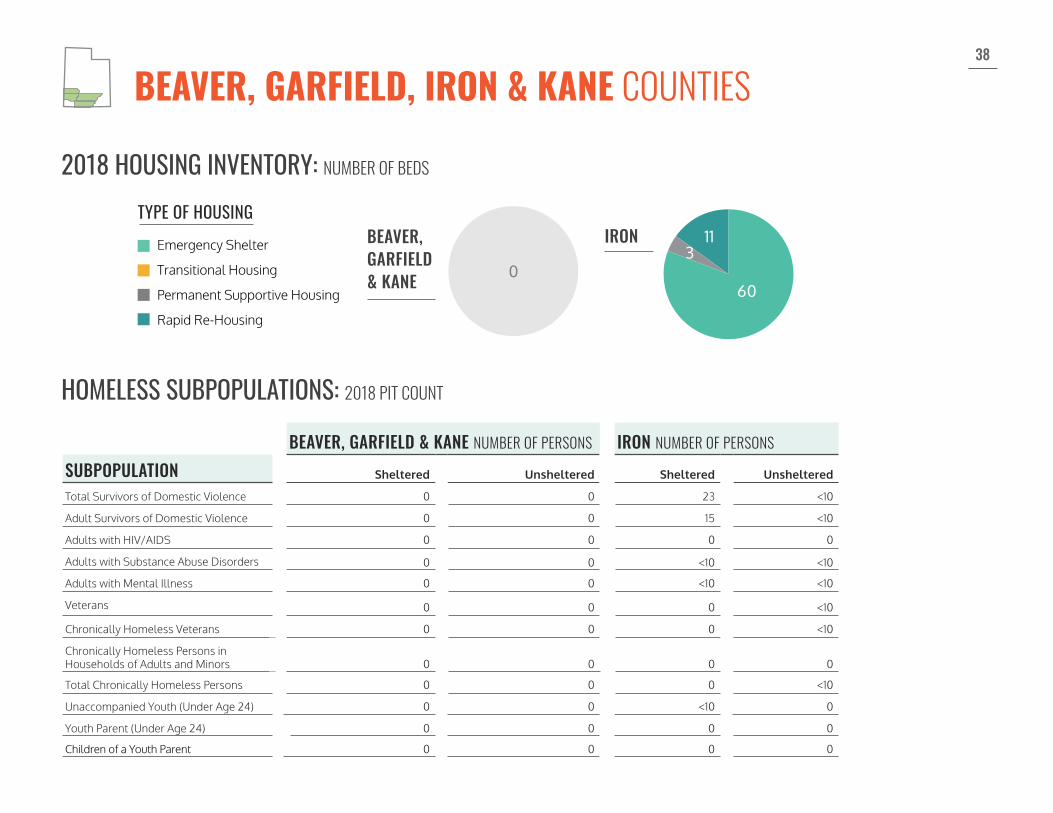
HOMELESS SUBPOPULATIONS: 2018 PIT COUNT
2018 HOUSING INVENTORY: NUMBER OF BEDS
TYPE OF HOUSINGEmergency Shelter
Transitional Housing
Permanent Supportive Housing
Rapid Re-Housing
BEAVER, GARFIELD & KANE NUMBER OF PERSONS IRON NUMBER OF PERSONSSUBPOPULATION Sheltered Unsheltered Sheltered Unsheltered
Total Survivors of Domestic Violence 0 0 23 <10
Adult Survivors of Domestic Violence 0 0 15 <10
Adults with HIV/AIDS 0 0 0 0
Adults with Substance Abuse Disorders 0 0 <10 <10
Adults with Mental Illness 0 0 <10 <10
Veterans 0 0 0 <10
Chronically Homeless Veterans 0 0 0 <10
Chronically Homeless Persons in Households of Adults and Minors 0 0 0 0
Total Chronically Homeless Persons 0 0 0 <10
Unaccompanied Youth (Under Age 24) 0 0 <10 0
Youth Parent (Under Age 24) 0 0 0 0
Children of a Youth Parent 0 0 0 0
BEAVER, GARFIELD, IRON & KANE COUNTIESiron
3
60
11IRON
beaver kane gar�eld
0
BEAVER, GARFIELD & KANE

39
HEADCOUNTBEAVER, GARFIELD & KANE IRON
IRON COUNTY LHCC TOTAL
BOS COC TOTAL
STATE TOTAL
Sheltered Individuals in households comprised of adults and minors 0 12 12 292 970
Individuals in households comprised of only children 0 0 0 11 17
Individuals in households without children 0 20 20 357 1,469
Total 0 32 32 660 2,456
Unsheltered Individuals in households comprised of adults and minors 0 0 0 <10 <10
Individuals in households comprised of only children 0 0 0 0 <10
Individuals in households without children 0 10 10 237 417
Total 0 10 10 239 420
Total Individuals in households comprised of adults and minors 0 12 12 294 972
Individuals in households comprised of only children 0 0 0 11 18
Individuals in households without children 0 30 30 594 1,886
Total 0 42 42 899 2,876
HEADCOUNTBEAVER, GARFIELD & KANE IRON
IRON COUNTY LHCC TOTAL
BOS COC TOTAL
STATE TOTAL
Sheltered Individuals in households comprised of adults and minors 0 <10 <10 90 286
Individuals in households comprised of only children 0 0 0 11 16
Individuals in households without children 0 20 20 354 1,464
Total 0 24 24 455 1,766
Unsheltered Individuals in households comprised of adults and minors 0 0 0 <10 <10
Individuals in households comprised of only children 0 0 0 0 <10
Individuals in households without children 0 <10 <10 231 408
Total 0 <10 <10 232 410
Total Individuals in households comprised of adults and minors 0 <10 <10 91 287
Individuals in households comprised of only children 0 0 0 11 17
Individuals in households without children 0 29 29 585 1,872
Total 0 33 33 687 2,176
2018 PIT SUMMARYBEAVER, GARFIELD, IRON & KANE COUNTIES

40
HOMELESS SUBPOPULATIONS:2018 PIT COUNT
2018 HOUSING INVENTORY:NUMBER OF BEDS
NUMBER OF PERSONS
SUBPOPULATION Sheltered Unsheltered
Total Survivors of Domestic Violence 58 13
Adult Survivors of Domestic Violence 25 13
Adults with HIV/AIDS 0 0
Adults with Substance Abuse Disorders 22 13
Adults with Mental Illness 45 24
Veterans <10 <10
Chronically Homeless Veterans <10 <10
Chronically Homeless Persons in Households of Adults and Minors 0 0
Total Chronically Homeless Persons <10 16
Unaccompanied Youth(Under Age 24) <10 <10
Youth Parent (Under Age 24) <10 0
Children of a Youth Parent <10 0
117
20072
97
mountainland
HOMELESS SHELTER & HOUSING PROVIDERSCenter for Women and Children in Crisis Peace House
Community Action Services and Food Bank Provo City Housing Authority
Food and Care Coalition/Friends of the Coalition Transient Services Office
Golden Spike United Way - Utah County
Housing Authority of Utah County Wasatch Mental Health
Mountainlands Community Housing Trust
MOUNTAINLAND ASSOCIATION OF GOVERNMENTS LHCC — SUMMIT, UTAH & WASATCH COUNTIES
TYPE OF HOUSINGEmergency Shelter
Transitional Housing
Permanent Supportive Housing
Rapid Re-Housing
2018 HOUSING INVENTORY:NUMBER OF BEDS
41
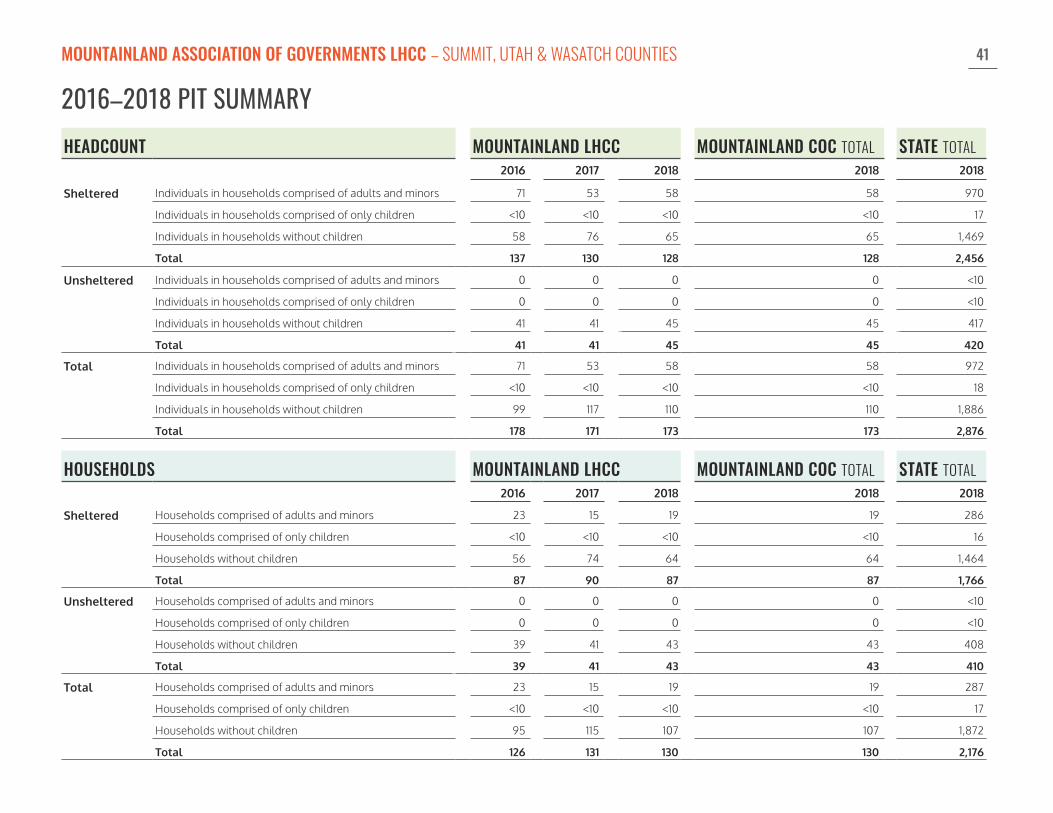
HEADCOUNT MOUNTAINLAND LHCC MOUNTAINLAND COC TOTAL STATE TOTAL2016 2017 2018 2018 2018
Sheltered Individuals in households comprised of adults and minors 71 53 58 58 970
Individuals in households comprised of only children <10 <10 <10 <10 17
Individuals in households without children 58 76 65 65 1,469
Total 137 130 128 128 2,456
Unsheltered Individuals in households comprised of adults and minors 0 0 0 0 <10
Individuals in households comprised of only children 0 0 0 0 <10
Individuals in households without children 41 41 45 45 417
Total 41 41 45 45 420
Total Individuals in households comprised of adults and minors 71 53 58 58 972
Individuals in households comprised of only children <10 <10 <10 <10 18
Individuals in households without children 99 117 110 110 1,886
Total 178 171 173 173 2,876
HOUSEHOLDS MOUNTAINLAND LHCC MOUNTAINLAND COC TOTAL STATE TOTAL2016 2017 2018 2018 2018
Sheltered Households comprised of adults and minors 23 15 19 19 286
Households comprised of only children <10 <10 <10 <10 16
Households without children 56 74 64 64 1,464
Total 87 90 87 87 1,766
Unsheltered Households comprised of adults and minors 0 0 0 0 <10
Households comprised of only children 0 0 0 0 <10
Households without children 39 41 43 43 408
Total 39 41 43 43 410
Total Households comprised of adults and minors 23 15 19 19 287
Households comprised of only children <10 <10 <10 <10 17
Households without children 95 115 107 107 1,872
Total 126 131 130 130 2,176
2016–2018 PIT SUMMARYMOUNTAINLAND ASSOCIATION OF GOVERNMENTS LHCC – SUMMIT, UTAH & WASATCH COUNTIES

42
HOMELESS SUBPOPULATIONS: 2018 PIT COUNT
2018 HOUSING INVENTORY: NUMBER OF BEDS
TYPE OF HOUSINGEmergency Shelter
Transitional Housing
Permanent Supportive Housing
Rapid Re-Housing
SUMMIT NUMBER OF PERSONS UTAH NUMBER OF PERSONS WASATCH NUMBER OF PERSONSSUBPOPULATION Sheltered Unsheltered Sheltered Unsheltered Sheltered Unsheltered
Total Survivors of Domestic Violence 11 0 47 13 0 0
Adult Survivors of Domestic Violence <10 0 19 13 0 0
Adults with HIV/AIDS 0 0 0 0 0 0
Adults with Substance Abuse Disorders 0 0 22 13 0 0
Adults with Mental Illness 0 0 45 24 0 0
Veterans 0 0 <10 <10 0 0
Chronically Homeless Veterans 0 0 <10 <10 0 0
Chronically Homeless Persons in Households of Adults and Minors 0 0 0 0 0 0
Total Chronically Homeless Persons 0 0 <10 16 0 0
Unaccompanied Youth (Under Age 24) <10 0 <10 <10 0 0
Youth Parent (Under Age 24) 0 0 <10 0 0 0
Children of a Youth Parent 0 0 <10 0 0 0
SUMMIT, UTAH & WASATCH COUNTIES
811
summit
SUMMIT
200
64117 86
utah
UTAH
wasatch
0
WASATCH
43
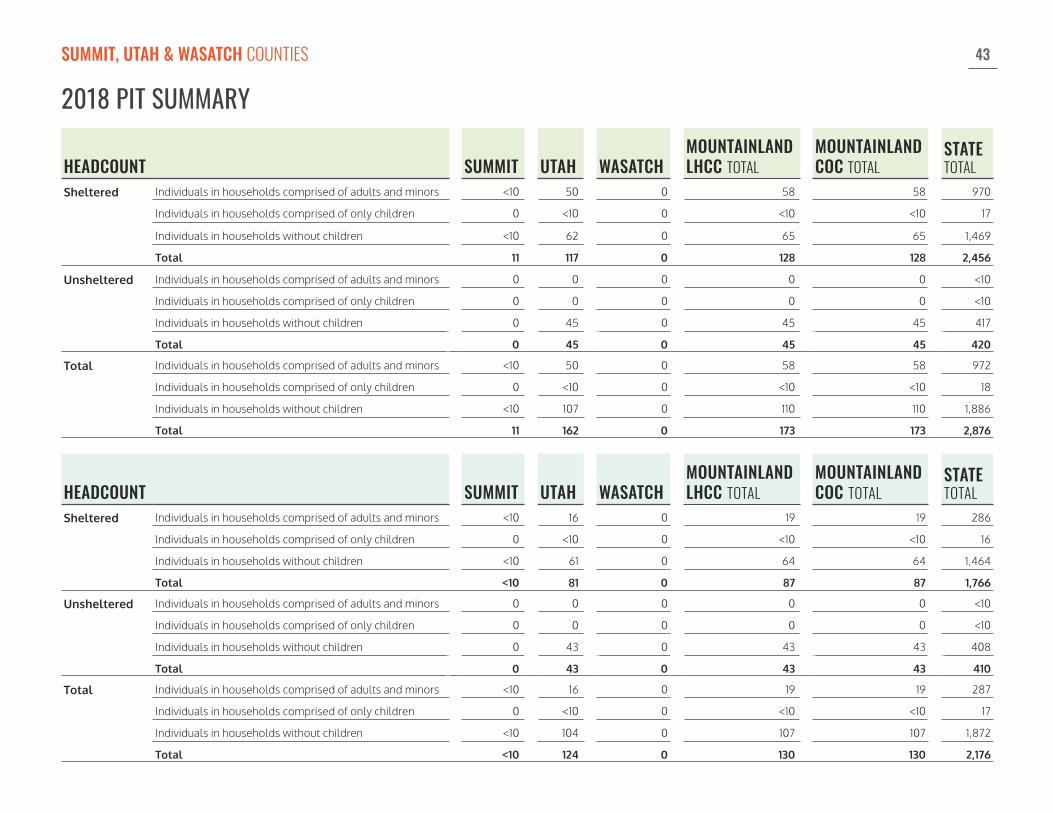
HEADCOUNT SUMMIT UTAH WASATCHMOUNTAINLAND LHCC TOTAL
MOUNTAINLAND COC TOTAL
STATE TOTAL
Sheltered Individuals in households comprised of adults and minors <10 50 0 58 58 970
Individuals in households comprised of only children 0 <10 0 <10 <10 17
Individuals in households without children <10 62 0 65 65 1,469
Total 11 117 0 128 128 2,456
Unsheltered Individuals in households comprised of adults and minors 0 0 0 0 0 <10
Individuals in households comprised of only children 0 0 0 0 0 <10
Individuals in households without children 0 45 0 45 45 417
Total 0 45 0 45 45 420
Total Individuals in households comprised of adults and minors <10 50 0 58 58 972
Individuals in households comprised of only children 0 <10 0 <10 <10 18
Individuals in households without children <10 107 0 110 110 1,886
Total 11 162 0 173 173 2,876
HEADCOUNT SUMMIT UTAH WASATCH
MOUNTAINLAND LHCC TOTAL
MOUNTAINLAND COC TOTAL
STATE TOTAL
Sheltered Individuals in households comprised of adults and minors <10 16 0 19 19 286
Individuals in households comprised of only children 0 <10 0 <10 <10 16
Individuals in households without children <10 61 0 64 64 1,464
Total <10 81 0 87 87 1,766
Unsheltered Individuals in households comprised of adults and minors 0 0 0 0 0 <10
Individuals in households comprised of only children 0 0 0 0 0 <10
Individuals in households without children 0 43 0 43 43 408
Total 0 43 0 43 43 410
Total Individuals in households comprised of adults and minors <10 16 0 19 19 287
Individuals in households comprised of only children 0 <10 0 <10 <10 17
Individuals in households without children <10 104 0 107 107 1,872
Total <10 124 0 130 130 2,176
2018 PIT SUMMARYSUMMIT, UTAH & WASATCH COUNTIES

44
NUMBER OF PERSONS
SUBPOPULATION Sheltered Unsheltered
Total Survivors of Domestic Violence 214 29
Adult Survivors of Domestic Violence 122 29
Adults with HIV/AIDS 13 <10
Adults with Substance Abuse Disorders 380 73
Adults with Mental Illness 540 78
Veterans 180 <10
Chronically Homeless Veterans 13 <10
Chronically Homeless Persons in Households of Adults and Minors <10 0
Total Chronically Homeless Persons 183 44
Unaccompanied Youth(Under Age 24) 103 <10
Youth Parent (Under Age 24) 22 0
Children of a Youth Parent 28 0
2,126 365
1,533847
SLC
SALT LAKE COUNTY LHCC
HOMELESS SHELTER & HOUSING PROVIDERSAsian Association of Utah Salt Lake County Youth Services
Family Promise Salt Lake South Valley Sanctuary
Family Support Center The Road Home
First Step House Utah Community Action
Housing Assistance Management Enterprise Utah Nonprofit Housing Corporation
Housing Authority of the County of Salt Lake Valley Bahavioral Health
Housing Authority of Salt Lake City Volunteers of America, Utah
Housing Opportunities Inc. Wasatch Homeless Healthcare
The Inn Between West Valley City Housing Authority
Rescue Mission of Salt Lake YWCA Salt Lake City
TYPE OF HOUSINGEmergency Shelter
Transitional Housing
Permanent Supportive Housing
Rapid Re-Housing
2018 HOUSING INVENTORY:NUMBER OF BEDSHOMELESS SUBPOPULATIONS:
2018 PIT COUNT
45
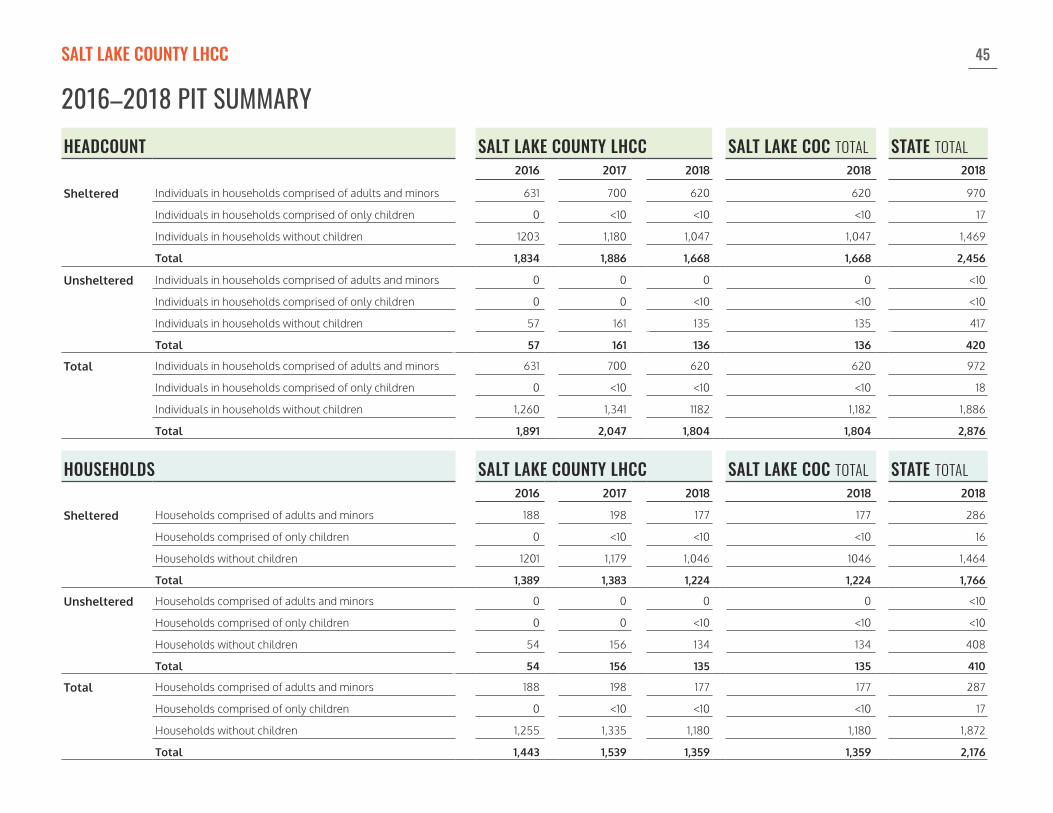
HEADCOUNT SALT LAKE COUNTY LHCC SALT LAKE COC TOTAL STATE TOTAL2016 2017 2018 2018 2018
Sheltered Individuals in households comprised of adults and minors 631 700 620 620 970
Individuals in households comprised of only children 0 <10 <10 <10 17
Individuals in households without children 1203 1,180 1,047 1,047 1,469
Total 1,834 1,886 1,668 1,668 2,456
Unsheltered Individuals in households comprised of adults and minors 0 0 0 0 <10
Individuals in households comprised of only children 0 0 <10 <10 <10
Individuals in households without children 57 161 135 135 417
Total 57 161 136 136 420
Total Individuals in households comprised of adults and minors 631 700 620 620 972
Individuals in households comprised of only children 0 <10 <10 <10 18
Individuals in households without children 1,260 1,341 1182 1,182 1,886
Total 1,891 2,047 1,804 1,804 2,876
HOUSEHOLDS SALT LAKE COUNTY LHCC SALT LAKE COC TOTAL STATE TOTAL2016 2017 2018 2018 2018
Sheltered Households comprised of adults and minors 188 198 177 177 286
Households comprised of only children 0 <10 <10 <10 16
Households without children 1201 1,179 1,046 1046 1,464
Total 1,389 1,383 1,224 1,224 1,766
Unsheltered Households comprised of adults and minors 0 0 0 0 <10
Households comprised of only children 0 0 <10 <10 <10
Households without children 54 156 134 134 408
Total 54 156 135 135 410
Total Households comprised of adults and minors 188 198 177 177 287
Households comprised of only children 0 <10 <10 <10 17
Households without children 1,255 1,335 1,180 1,180 1,872
Total 1,443 1,539 1,359 1,359 2,176
2016–2018 PIT SUMMARYSALT LAKE COUNTY LHCC

46
HOMELESS SUBPOPULATIONS:2018 PIT COUNT
2018 HOUSING INVENTORY:NUMBER OF BEDS
NUMBER OF PERSONS
SUBPOPULATION Sheltered Unsheltered
Total Survivors of Domestic Violence <10 0
Adult Survivors of Domestic Violence <10 0
Adults with HIV/AIDS 0 0
Adults with Substance Abuse Disorders <10 0
Adults with Mental Illness 0 0
Veterans 0 0
Chronically Homeless Veterans 0 0
Chronically Homeless Persons in Households of Adults and Minors 0 0
Total Chronically Homeless Persons 0 0
Unaccompanied Youth(Under Age 24) 0 0
Youth Parent (Under Age 24) 0 0
Children of a Youth Parent 0 0
21
san juan
HOMELESS SHELTER & HOUSING PROVIDERSGentle Ironhawk Shelter
SAN JUAN COUNTY LHCC
TYPE OF HOUSINGEmergency Shelter
Transitional Housing
Permanent Supportive HousingRapid Re-Housing
47
HEADCOUNT SAN JUAN COUNTY LHCC BOS COC TOTAL STATE TOTAL2016 2017 2018 2018 2018
Sheltered Individuals in households comprised of adults and minors 0 0 0 292 970
Individuals in households comprised of only children 0 0 0 11 17
Individuals in households without children <10 0 <10 357 1,469
Total <10 0 <10 660 2,456
Unsheltered Individuals in households comprised of adults and minors 0 0 0 <10 <10
Individuals in households comprised of only children 0 0 0 0 <10
Individuals in households without children 0 0 0 237 417
Total 0 0 0 239 420
Total Individuals in households comprised of adults and minors 0 0 0 294 972
Individuals in households comprised of only children 0 0 0 11 18
Individuals in households without children <10 0 <10 594 1,886
Total <10 0 <10 899 2,876
HOUSEHOLDS SAN JUAN COUNTY LHCC BOS COC TOTAL STATE TOTAL2016 2017 2018 2018 2018
Sheltered Households comprised of adults and minors 0 0 0 90 286
Households comprised of only children 0 0 0 11 16
Households without children <10 0 <10 354 1,464
Total <10 0 <10 455 1,766
Unsheltered Households comprised of adults and minors 0 0 0 <10 <10
Households comprised of only children 0 0 0 0 <10
Households without children 0 0 0 231 408
Total 0 0 0 232 410
Total Households comprised of adults and minors 0 0 0 91 287
Households comprised of only children 0 0 0 11 17
Households without children <10 0 <10 585 1,872
Total <10 0 <10 687 2,176
2016–2018 PIT SUMMARYSAN JUAN COUNTY LHCC

48
HOMELESS SUBPOPULATIONS:2018 PIT COUNT
2018 HOUSING INVENTORY:NUMBER OF BEDS
SIX COUNTY ASSOCIATION OF GOVERNMENTS LHCC
NUMBER OF PERSONS
SUBPOPULATION Sheltered Unsheltered
Total Survivors of Domestic Violence 28 0
Adult Survivors of Domestic Violence 14 0
Adults with HIV/AIDS 0 0
Adults with Substance Abuse Disorders <10 0
Adults with Mental Illness <10 0
Veterans 0 0
Chronically Homeless Veterans 0 0
Chronically Homeless Persons in Households of Adults and Minors 0 0
Total Chronically Homeless Persons 0 0
Unaccompanied Youth(Under Age 24) 0 0
Youth Parent (Under Age 24) 0 0
Children of a Youth Parent 0 0
3
2145
six coubty
HOMELESS SHELTER & HOUSING PROVIDERSNew Horizons Crisis Center
Six County Association of Governments
— JUAB, MILLARD, PIUTE, SANPETE, SEVIER & WAYNE COUNTIES
TYPE OF HOUSINGEmergency Shelter
Transitional Housing
Permanent Supportive HousingRapid Re-Housing

49
HEADCOUNT SIX COUNTY LHCC BOS COC TOTAL STATE TOTAL2016 2017 2018 2018 2018
Sheltered Individuals in households comprised of adults and minors 10 16 19 292 970
Individuals in households comprised of only children 0 <10 0 11 17
Individuals in households without children <10 <10 <10 357 1,469
Total 13 26 28 660 2,456
Unsheltered Individuals in households comprised of adults and minors 0 0 0 <10 <10
Individuals in households comprised of only children 0 0 0 0 <10
Individuals in households without children 0 <10 0 237 417
Total 0 <10 0 239 420
Total Individuals in households comprised of adults and minors 10 16 19 294 972
Individuals in households comprised of only children 0 <10 0 11 18
Individuals in households without children <10 <10 <10 594 1,886
Total 13 28 28 899 2,876
HOUSEHOLDS SIX COUNTY LHCC BOS COC TOTAL STATE TOTAL2016 2017 2018 2018 2018
Sheltered Households comprised of adults and minors <10 <10 <10 90 286
Households comprised of only children 0 <10 0 11 16
Households without children <10 <10 <10 354 1,464
Total <10 17 14 455 1,766
Unsheltered Households comprised of adults and minors 0 0 0 <10 <10
Households comprised of only children 0 0 0 0 <10
Households without children 0 <10 0 231 408
Total 0 <10 0 232 410
Total Households comprised of adults and minors <10 <10 <10 91 287
Households comprised of only children 0 <10 0 11 17
Households without children <10 <10 <10 585 1,872
Total <10 19 14 687 2,176
2016–2018 PIT SUMMARYSIX COUNTY ASSOCIATION OF GOVERNMENTS LHCC – JUAB, MILLARD, PIUTE, SANPETE, SEVIER & WAYNE COUNTIES

50
HOMELESS SUBPOPULATIONS: 2018 PIT COUNT
2018 HOUSING INVENTORY: NUMBER OF BEDS
TYPE OF HOUSINGEmergency Shelter
Transitional Housing
Permanent Supportive Housing
Rapid Re-Housing
JUAB, MILLARD, PIUTE, SANPETE & WAYNE NUMBER OF PERSONS SEVIER NUMBER OF PERSONS
SUBPOPULATION Sheltered Unsheltered Sheltered Unsheltered
Total Survivors of Domestic Violence 0 0 28 0
Adult Survivors of Domestic Violence 0 0 14 0
Adults with HIV/AIDS 0 0 0 0
Adults with Substance Abuse Disorders 0 0 <10 0
Adults with Mental Illness 0 0 <10 0
Veterans 0 0 0 0
Chronically Homeless Veterans 0 0 0 0
Chronically Homeless Persons in Households of Adults and Minors 0 0 0 0
Total Chronically Homeless Persons 0 0 0 0
Unaccompanied Youth (Under Age 24) 0 0 0 0
Youth Parent (Under Age 24) 0 0 0 0
Children of a Youth Parent 0 0 0 0
JUAB, MILLARD, PIUTE, SANPETE, SEVIER & WAYNE COUNTIESSevier
3
2145
SEVIER
juab millard etc
0
JUAB, MILLARD, PIUTE, SANPETE & WAYNE

51
HEADCOUNTJUAB, MILLARD, PIUTE, SANPETE & WAYNE SEVIER
SIX COUNTY LHCC TOTAL
B0S COC TOTAL
STATE TOTAL
Sheltered Individuals in households comprised of adults and minors 0 19 19 292 970
Individuals in households comprised of only children 0 0 0 11 17
Individuals in households without children 0 <10 <10 357 1,469
Total 0 28 28 660 2,456
Unsheltered Individuals in households comprised of adults and minors 0 0 0 <10 <10
Individuals in households comprised of only children 0 0 0 0 <10
Individuals in households without children 0 0 0 237 417
Total 0 0 0 239 420
Total Individuals in households comprised of adults and minors 0 19 19 294 972
Individuals in households comprised of only children 0 0 0 11 18
Individuals in households without children 0 <10 <10 594 1,886
Total 0 28 28 899 2,876
HEADCOUNTJUAB, MILLARD, PIUTE, SANPETE & WAYNE SEVIER
SIX COUNTY LHCC TOTAL
BOS COC TOTAL
STATE TOTAL
Sheltered Individuals in households comprised of adults and minors 0 <10 <10 90 286
Individuals in households comprised of only children 0 0 0 11 16
Individuals in households without children 0 <10 <10 354 1,464
Total 0 14 14 455 1,766
Unsheltered Individuals in households comprised of adults and minors 0 0 0 <10 <10
Individuals in households comprised of only children 0 0 0 0 <10
Individuals in households without children 0 0 0 231 408
Total 0 0 0 232 410
Total Individuals in households comprised of adults and minors 0 <10 <10 91 287
Individuals in households comprised of only children 0 0 0 11 17
Individuals in households without children 0 <10 <10 585 1,872
Total 0 14 14 687 2,176
2018 PIT SUMMARYJUAB, MILLARD, PIUTE, SANPETE & WAYNE COUNTIES

52
HOMELESS SUBPOPULATIONS:2018 PIT COUNT
2018 HOUSING INVENTORY:NUMBER OF BEDS
NUMBER OF PERSONS
SUBPOPULATION Sheltered Unsheltered
Total Survivors of Domestic Violence 10 <10
Adult Survivors of Domestic Violence <10 <10
Adults with HIV/AIDS 0 <10
Adults with Substance Abuse Disorders <10 <10
Adults with Mental Illness <10 <10
Veterans 0 <10
Chronically Homeless Veterans 0 0
Chronically Homeless Persons in Households of Adults and Minors 0 0
Total Chronically Homeless Persons 0 <10
Unaccompanied Youth(Under Age 24) 0 0
Youth Parent (Under Age 24) 0 0
Children of a Youth Parent 0 0
50
14
tooele
HOMELESS SHELTER & HOUSING PROVIDERSTooele County Housing Authority
Valley Behavioral Health/Tooele County Relief Services
Valley Behavioral Health/Tooele Valley Resource Center
TOOELE COUNTY LHCC
TYPE OF HOUSINGEmergency Shelter
Transitional Housing
Permanent Supportive HousingRapid Re-Housing
53
HEADCOUNT TOOELE COUNTY LHCC BOS COC TOTAL STATE TOTAL2016 2017 2018 2018 2018
Sheltered Individuals in households comprised of adults and minors <10 0 <10 292 970
Individuals in households comprised of only children 0 0 0 11 17
Individuals in households without children <10 0 <10 357 1,469
Total 11 0 10 660 2,456
Unsheltered Individuals in households comprised of adults and minors 0 0 0 <10 <10
Individuals in households comprised of only children 0 0 0 0 <10
Individuals in households without children 0 <10 <10 237 417
Total 0 <10 <10 239 420
Total Individuals in households comprised of adults and minors <10 0 <10 294 972
Individuals in households comprised of only children 0 0 0 11 18
Individuals in households without children <10 <10 11 594 1,886
Total 11 <10 17 899 2,876
HOUSEHOLDS TOOELE COUNTY LHCC BOS COC TOTAL STATE TOTAL2016 2017 2018 2018 2018
Sheltered Households comprised of adults and minors <10 0 <10 90 286
Households comprised of only children 0 0 0 11 16
Households without children <10 0 <10 354 1,464
Total <10 0 <10 455 1,766
Unsheltered Households comprised of adults and minors 0 0 0 <10 <10
Households comprised of only children 0 0 0 0 <10
Households without children 0 <10 <10 231 408
Total 0 <10 <10 232 410
Total Households comprised of adults and minors <10 0 <10 91 287
Households comprised of only children 0 0 0 11 17
Households without children <10 <10 11 585 1,872
Total <10 <10 13 687 2,176
2016–2018 PIT SUMMARYTOOELE COUNTY LHCC

54
HOMELESS SUBPOPULATIONS:2018 PIT COUNT
2018 HOUSING INVENTORY:NUMBER OF BEDS
UINTAH BASIN ASSOCIATION OF GOVERNMENTS (UBAOG) LHCC
NUMBER OF PERSONS
SUBPOPULATION Sheltered Unsheltered
Total Survivors of Domestic Violence <10 <10
Adult Survivors of Domestic Violence <10 0
Adults with HIV/AIDS 0 0
Adults with Substance Abuse Disorders <10 0
Adults with Mental Illness 0 <10
Veterans 0 0
Chronically Homeless Veterans 0 0
Chronically Homeless Persons in Households of Adults and Minors 0 0
Total Chronically Homeless Persons 0 <10
Unaccompanied Youth(Under Age 24) <10 0
Youth Parent (Under Age 24) <10 <10
Children of a Youth Parent <10 <10
25
7
33
uintah basin aog
HOMELESS SHELTER & HOUSING PROVIDERSUintah Basin Association of Governments
Uintah County
Women's Crisis Center
Turning Point Shelter
— DAGGETT, DUCHESNE & UINTAH COUNTIES
TYPE OF HOUSINGEmergency Shelter
Transitional Housing
Permanent Supportive HousingRapid Re-Housing
55
HEADCOUNT UINTAH BASIN (UBAOG) LHCC BOS COC TOTAL STATE TOTAL2016 2017 2018 2018 2018
Sheltered Individuals in households comprised of adults and minors <10 <10 <10 292 970
Individuals in households comprised of only children 0 0 0 11 17
Individuals in households without children <10 <10 <10 357 1,469
Total 12 <10 17 660 2,456
Unsheltered Individuals in households comprised of adults and minors 0 0 <10 <10 <10
Individuals in households comprised of only children 0 0 0 0 <10
Individuals in households without children <10 0 <10 237 417
Total <10 0 <10 239 420
Total Individuals in households comprised of adults and minors <10 <10 10 294 972
Individuals in households comprised of only children 0 0 0 11 18
Individuals in households without children 18 <10 13 594 1,886
Total 21 <10 23 899 2,876
HOUSEHOLDS UINTAH BASIN (UBAOG) LHCC BOS COC TOTAL STATE TOTAL2016 2017 2018 2018 2018
Sheltered Households comprised of adults and minors <10 <10 <10 90 286
Households comprised of only children 0 0 0 11 16
Households without children <10 <10 <10 354 1,464
Total 10 <10 12 455 1,766
Unsheltered Households comprised of adults and minors 0 0 <10 <10 <10
Households comprised of only children 0 0 0 0 <10
Households without children <10 0 <10 231 408
Total <10 0 <10 232 410
Total Households comprised of adults and minors <10 <10 <10 91 287
Households comprised of only children 0 0 0 11 17
Households without children 18 <10 13 585 1,872
Total 19 <10 17 687 2,176
2016–2018 PIT SUMMARYUINTAH BASIN ASSOCIATION OF GOVERNMENTS (UBAOG) LHCC – DAGGETT, DUCHESNE & UINTAH COUNTIES

56
HOMELESS SUBPOPULATIONS: 2018 PIT COUNT
2018 HOUSING INVENTORY: NUMBER OF BEDS
TYPE OF HOUSINGEmergency Shelter
Transitional Housing
Permanent Supportive Housing
Rapid Re-Housing
DAGGETT, DUCHESNE & UINTAH COUNTIES
DAGGETT NUMBER OF PERSONS DUCHESNE NUMBER OF PERSONS UINTAH NUMBER OF PERSONSSUBPOPULATION Sheltered Unsheltered Sheltered Unsheltered Sheltered Unsheltered
Total Survivors of Domestic Violence 0 0 0 <10 <10 0
Adult Survivors of Domestic Violence 0 0 0 0 <10 0
Adults with HIV/AIDS 0 0 0 0 0 0
Adults with Substance Abuse Disorders 0 0 0 0 <10 0
Adults with Mental Illness 0 0 0 0 0 <10
Veterans 0 0 0 0 0 0
Chronically Homeless Veterans 0 0 0 0 0 0
Chronically Homeless Persons in Households of Adults and Minors 0 0 0 0 0 0
Total Chronically Homeless Persons 0 0 0 <10 0 0
Unaccompanied Youth (Under Age 24) 0 0 0 0 <10 0
Youth Parent (Under Age 24) 0 0 0 <10 <10 0
Children of a Youth Parent 0 0 0 <10 <10 0
daggett
0
DAGGETT
25
7
duchesne
DUCHESNE
Uintah
33
UINTAH

57
HEADCOUNT DAGGETT DUCHESNE UINTAHUBAOG LHCC TOTAL
B0S COC TOTAL
STATE TOTAL
Sheltered Individuals in households comprised of adults and minors 0 0 <10 <10 292 970
Individuals in households comprised of only children 0 0 0 0 11 17
Individuals in households without children 0 0 <10 <10 357 1,469
Total 0 0 17 17 660 2,456
Unsheltered Individuals in households comprised of adults and minors 0 <10 0 <10 <10 <10
Individuals in households comprised of only children 0 0 0 0 0 <10
Individuals in households without children 0 <10 <10 <10 237 417
Total 0 <10 <10 <10 239 420
Total Individuals in households comprised of adults and minors 0 <10 <10 10 294 972
Individuals in households comprised of only children 0 0 0 0 11 18
Individuals in households without children 0 <10 12 13 594 1886
Total 0 <10 20 23 899 2,876
HEADCOUNT DAGGETT DUCHESNE UINTAHUBAOG LHCC TOTAL
BOS COC TOTAL
STATE TOTAL
Sheltered Individuals in households comprised of adults and minors 0 0 <10 <10 90 286
Individuals in households comprised of only children 0 0 0 0 11 16
Individuals in households without children 0 0 <10 <10 354 1,464
Total 0 0 12 12 455 1,766
Unsheltered Individuals in households comprised of adults and minors 0 <10 0 <10 <10 <10
Individuals in households comprised of only children 0 0 0 0 0 <10
Individuals in households without children 0 <10 <10 <10 231 408
Total 0 <10 <10 <10 232 410
Total Individuals in households comprised of adults and minors 0 <10 <10 <10 91 287
Individuals in households comprised of only children 0 0 0 0 11 17
Individuals in households without children 0 <10 12 13 585 1,872
Total 0 <10 15 17 687 2,176
2018 PIT SUMMARYDAGGETT, DUCHESNE & UINTAH COUNTIES

58
HOMELESS SUBPOPULATIONS:2018 PIT COUNT
2018 HOUSING INVENTORY:NUMBER OF BEDS
NUMBER OF PERSONS
SUBPOPULATION Sheltered Unsheltered
Total Survivors of Domestic Violence 19 12
Adult Survivors of Domestic Violence 12 12
Adults with HIV/AIDS 0 <10
Adults with Substance Abuse Disorders 33 70
Adults with Mental Illness 15 52
Veterans <10 <10
Chronically Homeless Veterans <10 0
Chronically Homeless Persons in Households of Adults and Minors 0 0
Total Chronically Homeless Persons <10 13
Unaccompanied Youth(Under Age 24) 10 14
Youth Parent (Under Age 24) <10 0
Children of a Youth Parent <10 0
165
5010
100
washington
HOMELESS SHELTER & HOUSING PROVIDERSDove Center
Five County AOG
Friends of Switchpoint
Southwest Behavioral Health
St. George City
St. George Housing Authority
WASHINGTON COUNTY LHCC
TYPE OF HOUSINGEmergency Shelter
Transitional Housing
Permanent Supportive HousingRapid Re-Housing

59
HEADCOUNT WASHINGTON COUNTY LHCC BOS COC TOTAL STATE TOTAL2016 2017 2018 2018 2018
Sheltered Individuals in households comprised of adults and minors 30 24 30 292 970
Individuals in households comprised of only children 0 0 <10 11 17
Individuals in households without children 59 53 60 357 1,469
Total 89 77 91 660 2,456
Unsheltered Individuals in households comprised of adults and minors 20 0 0 <10 <10
Individuals in households comprised of only children <10 0 0 0 <10
Individuals in households without children 73 56 154 237 417
Total 94 56 154 239 420
Total Individuals in households comprised of adults and minors 50 24 30 294 972
Individuals in households comprised of only children <10 0 <10 11 18
Individuals in households without children 132 109 214 594 1,886
Total 183 133 245 899 2,876
HOUSEHOLDS WASHINGTON COUNTY LHCC BOS COC TOTAL STATE TOTAL2016 2017 2018 2018 2018
Sheltered Households comprised of adults and minors 10 <10 11 90 286
Households comprised of only children 0 0 <10 11 16
Households without children 57 53 59 354 1,464
Total 67 60 71 455 1,766
Unsheltered Households comprised of adults and minors <10 0 0 <10 <10
Households comprised of only children <10 0 0 0 <10
Households without children 71 56 153 231 408
Total 79 56 153 232 410
Total Households comprised of adults and minors 17 <10 11 91 287
Households comprised of only children <10 0 <10 11 17
Households without children 128 109 212 585 1,872
Total 146 116 224 687 2,176
2016–2018 PIT SUMMARYWASHINGTON COUNTY LHCC

60
NUMBER OF PERSONS
SUBPOPULATION Sheltered Unsheltered
Total Survivors of Domestic Violence 57 11
Adult Survivors of Domestic Violence 39 11
Adults with HIV/AIDS <10 0
Adults with Substance Abuse Disorders 54 10
Adults with Mental Illness 119 15
Veterans 36 0
Chronically Homeless Veterans <10 0
Chronically Homeless Persons in Households of Adults and Minors <10 0
Total Chronically Homeless Persons 23 <10
Unaccompanied Youth(Under Age 24) 28 <10
Youth Parent (Under Age 24) <10 0
Children of a Youth Parent <10 0
153
113
27426
weber morgan
HOMELESS SHELTER & HOUSING PROVIDERSArchway Youth Services
Homeless Veterans Fellowship
Housing Authority of Ogden City
Lantern House
Ogden Rescue Mission
Problems Anonymous Action Group
Weber County Housing Authority
Your Community Connection
Youth Futures
WEBER-MORGAN COUNTY LHCC
TYPE OF HOUSINGEmergency Shelter
Transitional Housing
Permanent Supportive HousingRapid Re-Housing
HOMELESS SUBPOPULATIONS:2018 PIT COUNT
2018 HOUSING INVENTORY:NUMBER OF BEDS

61
HEADCOUNT WEBER-MORGAN COUNTY LHCC BOS COC TOTAL STATE TOTAL2016 2017 2018 2018 2018
Sheltered Individuals in households comprised of adults and minors 100 58 95 292 970
Individuals in households comprised of only children <10 18 10 11 17
Individuals in households without children 214 200 233 357 1,469
Total 323 276 338 660 2,456
Unsheltered Individuals in households comprised of adults and minors 0 0 0 <10 <10
Individuals in households comprised of only children 0 0 0 0 <10
Individuals in households without children 11 13 30 237 417
Total 11 13 30 239 420
Total Individuals in households comprised of adults and minors 100 58 95 294 972
Individuals in households comprised of only children <10 18 18 11 18
Individuals in households without children 225 213 263 594 1,886
Total 334 289 376 899 2,876
HOUSEHOLDS WEBER-MORGAN COUNTY LHCC BOS COC TOTAL STATE TOTAL2016 2017 2018 2018 2018
Sheltered Households comprised of adults and minors 33 32 28 90 286
Households comprised of only children <10 18 10 11 16
Households without children 213 200 231 354 1,464
Total 255 250 269 455 1,766
Unsheltered Households comprised of adults and minors 0 0 0 <10 <10
Households comprised of only children 0 0 0 0 <10
Households without children 11 13 29 231 408
Total 11 13 29 232 410
Total Households comprised of adults and minors 33 32 28 91 287
Households comprised of only children <10 18 10 11 17
Households without children 224 213 260 585 1,872
Total 266 263 298 687 2,176
2016–2018 PIT SUMMARYWEBER-MORGAN COUNTY LHCC
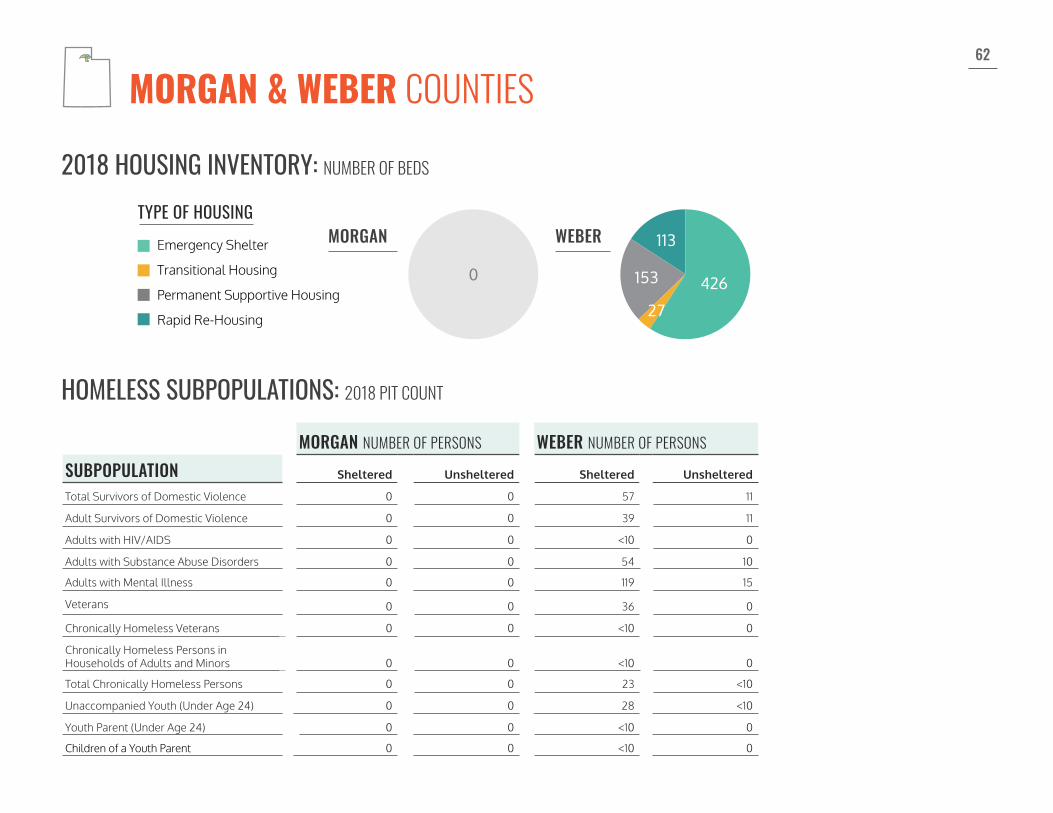
62
HOMELESS SUBPOPULATIONS: 2018 PIT COUNT
2018 HOUSING INVENTORY: NUMBER OF BEDS
TYPE OF HOUSINGEmergency Shelter
Transitional Housing
Permanent Supportive Housing
Rapid Re-Housing
MORGAN NUMBER OF PERSONS WEBER NUMBER OF PERSONSSUBPOPULATION Sheltered Unsheltered Sheltered Unsheltered
Total Survivors of Domestic Violence 0 0 57 11
Adult Survivors of Domestic Violence 0 0 39 11
Adults with HIV/AIDS 0 0 <10 0
Adults with Substance Abuse Disorders 0 0 54 10
Adults with Mental Illness 0 0 119 15
Veterans 0 0 36 0
Chronically Homeless Veterans 0 0 <10 0
Chronically Homeless Persons in Households of Adults and Minors 0 0 <10 0
Total Chronically Homeless Persons 0 0 23 <10
Unaccompanied Youth (Under Age 24) 0 0 28 <10
Youth Parent (Under Age 24) 0 0 <10 0
Children of a Youth Parent 0 0 <10 0
MORGAN & WEBER COUNTIESMorgan
0
MORGAN
153
113
27426
Weber
WEBER

63
HEADCOUNT MORGAN WEBERWEBER-MORGAN LHCC TOTAL BOS COC TOTAL STATE TOTAL
Sheltered Individuals in households comprised of adults and minors 0 95 95 292 970
Individuals in households comprised of only children 0 10 10 11 17
Individuals in households without children 0 233 233 357 1,469
Total 0 338 338 660 2,456
Unsheltered Individuals in households comprised of adults and minors 0 0 0 <10 <10
Individuals in households comprised of only children 0 0 0 0 <10
Individuals in households without children 0 30 30 237 417
Total 0 30 30 239 420
Total Individuals in households comprised of adults and minors 0 95 95 294 972
Individuals in households comprised of only children 0 10 10 11 18
Individuals in households without children 0 263 263 594 1,886
Total 0 368 368 899 2,876
HEADCOUNT MORGAN WEBERWEBER-MORGAN LHCC TOTAL BOS COC TOTAL STATE TOTAL
Sheltered Individuals in households comprised of adults and minors 0 28 28 90 286
Individuals in households comprised of only children 0 10 10 11 16
Individuals in households without children 0 231 231 354 1,464
Total 0 269 269 455 1,766
Unsheltered Individuals in households comprised of adults and minors 0 0 0 <10 <10
Individuals in households comprised of only children 0 0 0 0 <10
Individuals in households without children 0 29 29 231 408
Total 0 29 29 232 410
Total Individuals in households comprised of adults and minors 0 28 28 91 287
Individuals in households comprised of only children 0 10 10 11 17
Individuals in households without children 0 260 260 585 1,872
Total 0 298 298 687 2,176
2018 PIT SUMMARYMORGAN & WEBER COUNTIES
