1 - spectrum: concordia university research repository
TRANSCRIPT

A molecular approach to the community
ecology of parasites of freshwater fish
Sean Locke
A thesis presented in partial fulfillment of requirements
for the degree of doctor of philosophy in biology
Concordia University
January, 2010
Montreal, Quebec, Canada
I
1*1 Library and Archives Canada
Published Heritage Branch
395 Wellington Street OttawaONK1A0N4 Canada
Bibliotheque et Archives Canada
Direction du Patrimoine de Pedition
395, rue Wellington OttawaONK1A0N4 Canada
Your file Votre reference ISBN: 978-0-494-80223-6 Our file Notre r6f4rence ISBN: 978-0-494-80223-6
NOTICE: AVIS:
The author has granted a nonexclusive license allowing Library and Archives Canada to reproduce, publish, archive, preserve, conserve, communicate to the public by telecommunication or on the Internet, loan, distribute and sell theses worldwide, for commercial or noncommercial purposes, in microform, paper, electronic and/or any other formats.
L'auteur a accorde une licence non exclusive permettant a la Bibliotheque et Archives Canada de reproduire, publier, archiver, sauvegarder, conserver, transmettre au public par telecommunication ou par I'lnternet, preter, distribuer et vendre des theses partout dans le monde, a des fins commerciales ou autres, sur support microforme, papier, electronique et/ou autres formats.
The author retains copyright ownership and moral rights in this thesis. Neither the thesis nor substantial extracts from it may be printed or otherwise reproduced without the author's permission.
L'auteur conserve la propriete du droit d'auteur et des droits moraux qui protege cette these. Ni la these ni des extraits substantiels de celle-ci ne doivent etre imprimes ou autrement reproduits sans son autorisation.
In compliance with the Canadian Privacy Act some supporting forms may have been removed from this thesis.
Conformement a la loi canadienne sur la protection de la vie privee, quelques formulaires secondaires ont ete enleves de cette these.
While these forms may be included in the document page count, their removal does not represent any loss of content from the thesis.
Bien que ces formulaires aient inclus dans la pagination, il n'y aura aucun contenu manquant.
1*1
Canada

II

Abstract
A molecular approach to the community ecology of parasites of freshwater fish
Sean Locke, Ph.D.
Concordia University, 2010
Freshwater fish have been model hosts in the study of the community and
evolutionary ecology of parasites for decades. Most studies have dealt only with adult
parasites, although larval stages often dominate fish parasite communities. In addition,
few studies include replicates of both host species and sampling localities. For this thesis,
both larval and adult parasites were surveyed in six fish species (Notemigonus
crysoleucas, Pimephales notatus, Percaflavescens, Etheostoma nigrum, Lepomis
gibbosus, Ambloplites rupestris) collected from six localities in the St. Lawrence River
and molecular techniques were used to distinguish species of strigeid metacercariae
(Platyhelminthes: Trematoda). Novel primers were developed to sequence the barcode
region of the cytochrome c oxidase I (COI) gene and sequences of internal transcribed
spacer (ITS) regions of ribosomal DNA were also obtained. Both markers indicated
unexpectedly high numbers of species in strigeid metacercariae, but resolution between
species was clearer with COI than with ITS sequences. Strigeid species inhabiting the
lens of the eye offish were significantly less host specific than species inhabiting other
tissue;- possibly due to limited immune activity in the lens. Patterns of host specificity
were consistent across the separate fish communities, which included fish species that are
III

ecologically distinctive but closely related. Together, these findings suggest that
physiological incompatibility between host and parasite is a more important determinant
of host specificity than the ecological availability of host species to parasites in strigeid
metacercariae. The high host specificity of most strigeid species had important effects on
the parasite communities as a whole. Closely related fish species showed a significant
tendency to have similar parasite communities that was much stronger than the tendency
of parasite communities in spatially proximate fish to be similar. Geographic distance
was strongly associated with parasite community similarity only when comparisons were
limited to fish of the same species. Host taxonomy explained much more structure in
parasite communities than spatial categories, suggesting that host phylogeny is more
important than habitat in determining parasite community composition and abundance.
IV
Acknowledgements
I am deeply grateful to my supervisors David Marcogliese and Daniel
McLaughlin for their scientific, moral and financial support. David Marcogliese
introduced me to fish parasites and without his encouragement I would not have
undertaken this project. His expertise, enthusiasm, accessibility, and extensive network of
contacts were indispensable in moving the project forward. Daniel McLaughlin kindly
welcomed me into his laboratory and was unstintingly generous with his time and
insightful guidance. His presence in the lab and field provided a constant example of the
patience and perseverance necessary to bring a large-scale research project to completion.
It has been a privilege to learn from the combined experience of my supervisors in the
taxonomy, molecular biology and ecology of parasites, and a pleasure to work alongside
them both.
This thesis represents the work of more than one person. Many people contributed
time, energy, expertise, equipment and samples. However, any shortcomings in this work
are my responsibility alone.
Teresa Crease and Anna Moszczynska made a key methodological contribution
which vastly improved the quality of the data (Chapter 1, see also Contributions of the
Authors).
The input of Selvadurai Dayanandan was important to several key molecular
aspects of this project. He also served on my committee, along with Emma Despland,
Edward Maly, Paul Widden, Dylan Fraser, Barbara Woodside and Kym Jacobson, all of
whom provided critical feedback that is gratefully acknowledged.
V
I wish to thank the following individuals who assisted me with various statistical,
logistical and scientific aspects of this research, including Donal Hickey, James Grant,
Ian Ferguson, Grant Brown, Paul Albert, Yoyrick Reyjol, Robert Weladji, Sol Ackerman,
Rachel Krause, Andree Gendron, Martin Deschenes, Linda Paetow, Angela-Rose
Lapierre, Adriana Radulovici and Christopher Blanar. Five anonymous reviewers are
acknowledged for comments that improved Chapters 1 and 2.
I could never have amassed the data presented in this thesis alone and I am
indebted to numerous people for their assistance in collecting and processing samples.
Fieldwork was conducted with the help of Michel Arseneault, Germain Brault, Andree
Gendron, Claude Lessard, Sophie Trepanier, Lila Gagnon-Brambilla, Maxime Thibault,
Claire Maton, Jhanzaib Sherwani and using equipment provided by the St. Lawrence
Centre of Environment Canada. Rachel Krause, Nicholas Mirotchnick, Jhanzaib
Sherwani, Maxime Thibault, and Claudia Flores-Echaiz helped with fish dissection.
Natalia Ivanova, Liuqiong Lu, Claudia Kleint-Steinke, Janet Topan, Laura Bergmame
and technicians at the Canadian Centre for DNA Barcoding performed much of the
molecular-sample processing and data archiving. Host and parasite samples were
provided by Andree Gendron, Simon Mercier, Yves Leblanc, Lynn Miller, Eric Deneuf,
Chip Weseloh, Rachel Krause, Kayla King, Cam Goater, Pierre Brousseau, Louise
Champoux, Anne Lanteigne, Kerrin Patterson, Stacey Robinson, Chris Elvidge, Jae-Woo
Kim and Adriana Radulovici.
Marci Denesiuk provided valuable editorial and critical input on numerous
occasions and remained remarkably tolerant of my behaviour.
VI
The project was supported by funding to the Canadian Barcode of Life Network
from Genome Canada through the Ontario Genomics Institute, the National Sciences and
Engineering Research Council (NSERC) and other sponsors listed at www.bolnet.ca, as
well as an NSERC Discovery Grant to Daniel McLaughlin, STAGE funding to Francois
Gagne at Environment Canada, and a thesis completion award from the School of
Graduate Studies at Concordia University.
VII

Contributions of authors
I collected, processed and identified most of the parasites used in Chapter 1.
Teresa Crease designed the primers. Anna Moszczynska performed most of the extraction
and PCR of DNA; I performed DNA extraction and PCR for a small number of samples.
I rewrote an early draft of the chapter by Teresa Crease and Anna Moszczynska, made
subsequent revisions, and performed most of the data analysis.
I was responsible for the conception, sampling design, field work, specimen
identification and processing and data analysis described in Chapters 2-4.1 traveled to the
Canadian Centre for DNA Barcoding in Guelph and assisted with the molecular
processing (DNA extraction, PCR and DNA sequencing) of approximately 1100 out of
2000 specimens.
Selvadurai Dayanandan provided editorial input to Chapter 2. David Marcogliese
and Daniel McLaughlin oversaw and contributed to all aspects of the research and
provided editorial input to all chapters.
All authors have no conflict of interest to declare and note that the funding
agencies of this research (see Acknowledgements) had no role in study design, data
collection and analysis, decision to publish, or preparation of any part of this thesis or
manuscripts originating from it.
VIII
GENERAL INTRODUCTION 1
CHAPTER 1 DEVELOPMENT OF PRIMERS FOR THE MITOCHONDRIAL CYTOCHROME C OXIDASE I GENE IN DIGENETICTREMATODES (PLATYHELMINTHES) ILLUSTRATES THE CHALLENGE OF BARCODING PARASITIC HELMINTHS 7
INTRODUCTION 7
MATERIALS AND METHODS 9
RESULTS 13
DISCUSSION 15
CHAPTER 2 DIVERSITY AND SPECIFICITY IN DIPLOSTOMUM SPP. METACERCARIAE IN FRESHWATER FISHES REVEALED BY CYTOCHROME C OXIDASE I AND INTERNAL TRANSCRIBED SPACER SEQUENCES 25
INTRODUCTION 25
MATERIALS AND METHODS 28
RESULTS 33
DISCUSSION 39
CHAPTER 3 DNA BARCODES REVEAL CRYPTIC DIVERSITY AND HOST SPECIFICITY AMONG STRIGEID (PLATYHELMINTHES: TREMATODA) PARASITES OF FRESHWATER FISHES IN THE ST. LAWRENCE RIVER, CANADA61
INTRODUCTION 61
MATERIALS AND METHODS 64
RESULTS 71
DISCUSSION 78
CHAPTER 4 HOSTS MATTER MORE THAN HABITAT FOR FRESHWATER FISH PARASITE COMMUNITIES Ill
INTRODUCTION I l l
MATERIALS AND METHODS 114
RESULTS 120
DISCUSSION 125
APPENDIX 4.1 142
GENERAL CONCLUSIONS 148
REFERENCES 151
IX
TABLES AND FIGURES
TABLE 1 1 PRIMERS USED 18
TABLE 1 2 AMPLIFICATION AND SEQUENCING RESULTS 19
TABLE 2 1 DIPLOSTOMUM SPECIES IN ST LAWRENCE RIVER FISHES 47
TABLE 2 2 ALIGNMENT OF INTERNAL TRANSCRIBED SPACER SEQUENCES FROM DIPLOSTOMUM SP 1 AND D
INDISTINCTUM 4 9
TABLE 3 1 REVIEW OF MOLECULAR SYSTEMATIC STUDIES OF STRIGEIDS 86
TABLE 3 2 NUMBERS OF FISH COLLECTED IN SIX FOCAL SPECIES SAMPLED AT SIX LOCALITIES IN THE ST
LAWRENCE RIVER 88
TABLE 3 3 STRIGED SPECIES DETECTED BY DNA BARCODING 89
TABLE 3 4 ABUNDANCE OF ORNITHODIPLOSTOMUM SP 1 ACROSS LOCALITIES AND HOST SPECIES IN THE ST
LAWRENCE RIVER 93
TABLE 3 5 REGRESSION OF PHYLOGENETICALLY INDEPENDENT CONTRASTS IN LENS-INFECTION AND HOST
SPECIFICITY 94
TABLE 4 1 MULTIVARIATE PERMUTATIONAL ANALYSIS (PERMANOVA) OF HOST AND LOCALITY AS
DESCRIPTORS OF PARASITE COMMUNITIES IN FRESHWATER FISH 131
TABLE 4 2 PREDICTIVE POWER OF GEOGRAPHIC AND TAXONOMIC DISTANCE FOR THE SIMILARITY OF
PARASITE COMMUNITIES IN SIX FRESHWATER FISH SPECIES FROM THE ST LAWRENCE RIVER 1 3 2
FIGURE 1 1 NEIGHBOUR-JOINING PHENOGRAM OF CYTOCHROME C OXIDASE I SEQUENCES 22
FIGURE 1 2 NEIGHBOUR JOINING PHENOGRAMS OF CYTOCHROME C OXIDASE I AND INTERNAL TRANSCRIBED
SPACER SEQUENCES 2 3
FIGURE 1 3 NEIGHBOUR JOINING PHENOGRAM OF 18S R R N A SEQUENCES 24
FIGURE 2 1 SAMPLING LOCALITIES 50
FIGURE 2 2 ABUNDANCE OF DIPLOSTOMUM SPP METACERCARIAE IN srx FOCAL FISH HOSTS 51
FIGURE 2 3 INTRASPECIFIC SEQUENCE VARIATION IN MITOCHONDRIAL AND NUCLEAR MARKERS IN
DIPLOSTOMUM SPP 52
FIGURE 2 4 NEIGHBOUR JOINING PHENOGRAMS OF CYTOCHROME C OXIDASE I AND INTERNAL TRANSCRIBED
SPACER SEQUENCES FROM DIPLOSTOMUM SPP 54
FIGURE 2 5 ALIGNED ELECTROPHEROGRAMS OF ITS FROM DIPLOSTOMUM SP 1 AND DIPLOSTOMUM
INDISTINCT UM 57
FIGURE 2 6 HOST SPECTRA AND INFECTION SITE IN DIPLOSTOMUM SPP 59
FIGURE 2 7 MAXIMUM PARSIMONY ANALYSIS OF INTERNAL TRANSCRIBED SPACER 1 SEQUENCES FROM
DIPLOSTOMUM SPP 60
FIGURE 3 1 THE MOST COMMON LIFE-CYCLE PATTERN AMONG STRIGEID TREMATODES 96
FIGURE 3 2 SAMPLING LOCALITIES IN THE ST LAWRENCE RIVER WHERE MOST FISH WERE COLLECTED 97
FIGURE 3 3 NEIGHBOUR-JOINING ANALYSIS OF CYTOCHROME C OXIDASE 1 SEQUENCES IN STRIGEID SPECIES
DETECTED IN FISH AND FROGS IN THE ST LAWRENCE RIVER 99
FIGURE 3 4 VARIATION OF CYTOCHROME C OXIDASE 1 SEQUENCES WITHIN AND BETWEEN SPECIES IN 40
STRIGEID SPECIES DETECTED BY DNA BARCODING 101
FIGURE 3 5 COMPARISON OF NEIGHBOUR-JOINING ANALYSES OF SEQUENCES OF CYTOCHROME C OXIDASE 1
AND INTERNAL TRANSCRIBED SPACER IN 27 STRIGEID SPECIES 103
FIGURE 3 6 Div ERSITY OF STRIGEID METACERCARIAE IN FISH FROM THE ST LAWRENCE RIVER DETECTED BY
DNA BARCODING COMPARED TO PREVIOUS CANADIAN RECORDS 105
FIGURE 3 7 SPECIES ACCUMULATION CURVES FOR STRIGEIDS FROM SIX FOCAL FISH SPECIES 107
FIGURE 3 8 COMPARISON OF HOST SPECIFICITY TN STRIGEID METACERCARIAE INHABITING THE LENS AND
OTHER TISSUES OF FISH 109
FIGURE 3 9 PHYLOGENY USED IN INDEPENDENT CONTRAST ANALYSES 110
FIGURE 4 1 NON-METRIC MULTI-DIMENSIONAL SCALING (MDS) OF PARASITE INFRACOMMUNITIES IN 705
FISH FROM THE ST LAWRENCE RIVER 133
FIGURE 4 2 NON-METRIC MULTI-DIMENSIONAL SCALING (MDS) OF PARASITE COMPONENT COMMUNITIES IN
34 POPULATIONS OF SIX FISH SPECIES FROM THE ST LAWRENCE RIVER 135
FIGURE 4 3 EFFECTS OF HOST PHYLOGENETIC AND SPATIAL CATEGORIES IN ANALYSES OF SIMILARITY
(ANOS1M) IN PARASITE INFRACOMMUNITIES 137
X
FIGURE 4.4 SECOND-STAGE ORDINATION (2STAGE) OF CORRELATIONS BETWEEN PARASITE
INFRACOMMUNITY SIMILARITY AND TAXONOMIC AND GEOGRAPHIC DISTANCE BETWEEN INDIVIDUAL
HOSTS 138
FIGURE 4.5 EFFECT OF TAXONOMIC DISTANCE BETWEEN HOSTS ON PARASITE INFRACOMMUNITY SIMILARITY
IN 705 FISH FROM SIX DIFFERENT SPECIES AND SIX DIFFERENT LOCALITIES IN THE ST. LAWRENCE
RIVER 140
FIGURE 4.6 CORRELATION BETWEEN GEOGRAPHIC DISTANCE AND PARASITE INFRACOMMUNITY SIMILARITY
BROKEN DOWN BY HOST SPECIES AND PARASITE GUILD 141
XI
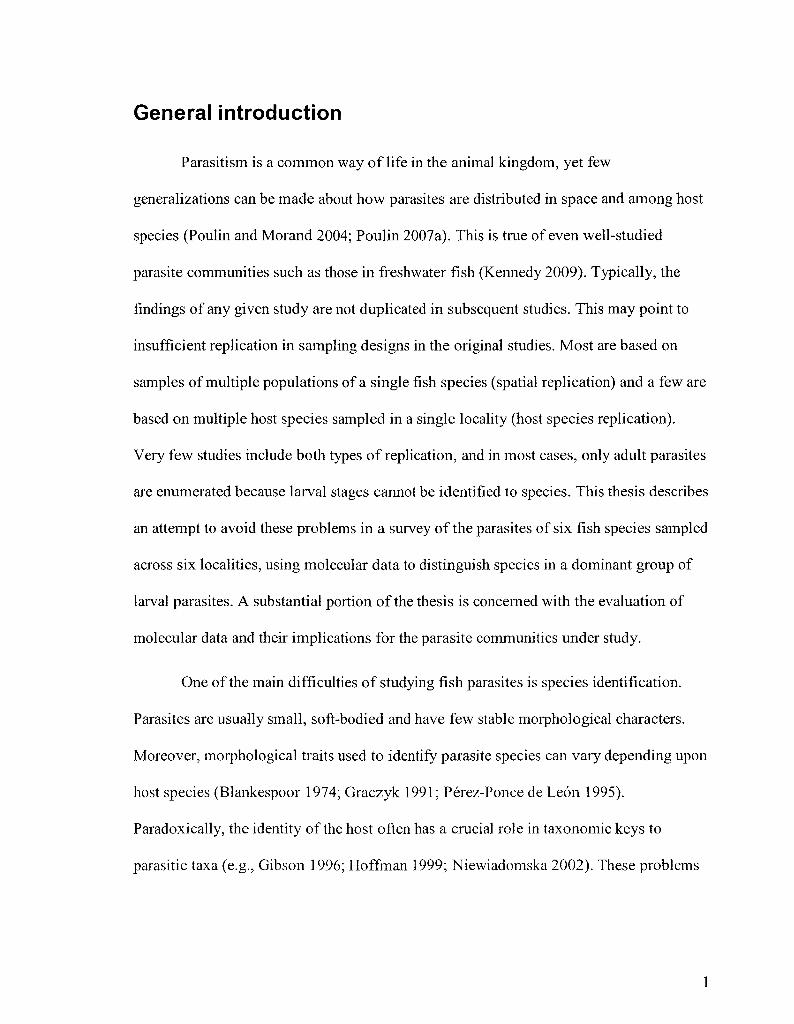
General introduction
Parasitism is a common way of life in the animal kingdom, yet few
generalizations can be made about how parasites are distributed in space and among host
species (Poulin and Morand 2004; Poulin 2007a). This is true of even well-studied
parasite communities such as those in freshwater fish (Kennedy 2009). Typically, the
findings of any given study are not duplicated in subsequent studies. This may point to
insufficient replication in sampling designs in the original studies. Most are based on
samples of multiple populations of a single fish species (spatial replication) and a few are
based on multiple host species sampled in a single locality (host species replication).
Very few studies include both types of replication, and in most cases, only adult parasites
are enumerated because larval stages cannot be identified to species. This thesis describes
an attempt to avoid these problems in a survey of the parasites of six fish species sampled
across six localities, using molecular data to distinguish species in a dominant group of
larval parasites. A substantial portion of the thesis is concerned with the evaluation of
molecular data and their implications for the parasite communities under study.
One of the main difficulties of studying fish parasites is species identification.
Parasites are usually small, soft-bodied and have few stable morphological characters.
Moreover, morphological traits used to identify parasite species can vary depending upon
host species (Blankespoor 1974; Graczyk 1991; Perez-Ponce de Leon 1995).
Paradoxically, the identity of the host often has a crucial role in taxonomic keys to
parasitic taxa (e.g., Gibson 1996; Hoffman 1999; Niewiadomska 2002). These problems
1
are particularly acute for larval parasites, which differ morphologically from adults and
have fewer easily distinguishable morphological features.
Identification of species is notoriously difficult in larval strigeids
(Platyhelminthes: Trematoda), which are common and pathogenic parasites of freshwater
fish around the world (Szidat 1969; Lemly and Esch 1984; Chappell 1995; Sandland and
Goater 2001; Niewadomska 2002; Overstreet and Curran 2004; see Figure 3.1 for the
strigeid life cycle). Molecular data offer a solution to species-identification problems and
constitute the only practical means of obtaining species-level resolution in a field survey
of parasites that includes larval stages. In this study, we use DNA sequences to
distinguish species of larval strigeids, i.e., metacercariae, which are common in fish from
the St. Lawrence River (Marcogliese et al. 2006).
Most studies using DNA to distinguish trematode species have employed
sequences of non-coding spacer regions between nuclear genes encoding ribosomal
subunits (internal transcribed spacers, or ITS) (Nolan and Cribb, 2005). A smaller
number have employed sequences of mitochondrial DNA (Olson and Tkach 2005). The
use of a particular region of mitochondrial DNA to distinguish species is the goal of the
Barcode of Life, a campaign to increase the rate and reliability of species identification
and discovery. There is little dispute that mitochondrial sequences or other molecular
markers can be used to distinguish species; what is original (and controversial) in
barcoding is the designation of a single molecular target for distinguishing species in all
taxa, including undescribed species. The region advocated is also the principal molecular
target used in this thesis, namely a 648-base-pair region near the 5' end of the gene
2
encoding cytochrome c oxidase I (COI) commonly referred to as the "DNA barcode"
(Hebert et al, 2003a, b).
Sequences from the barcode region of the COI gene have been used to distinguish
described species and to detect unknown species in diverse groups of animals (Hebert et
al. 2003a, b, 2004; Smith et al. 2005, 2007; Ward et al. 2005; Cywinska et al. 2006;
Hajibabaei et al. 2006; Saunders 2008). However, this approach has been applied to only
a few parasitic helminths (Elsasser et al. 2009; Ferri et al. 2009) and, prior to the
publication of Chapters 1 and 2 of this thesis, no trematodes (Moszczynska et al. 2009;
Locke et al. 2009). This is partly attributable to lack of available primer sequences that
amplify the barcode region in trematodes. Chapter 1 addresses this situation with the
development and evaluation of primers that amplify the barcode region in diplostomatids
(Trematoda: Strigeida) as well as other flatworms.
Delineating undescribed species on the basis of DNA sequences from a single
molecular marker is controversial (Kunz 2002; Desalle et al. 2005; Hickerson et al. 2006;
Frezal and Leblois 2008). The utility of COI sequences for species distinction can be
compromised by the presence of imperfect copies of mitochondrial sequences in the
nuclear genome or in intracellular symbionts (e.g. van Herwerden et al. 2000; Hurst and
Jiggins 2005; Benesh et al. 2006) and by misleadingly high levels of sequence divergence
in geographically isolated populations (Irwin 2002; Kuo and Avise 2005). As a result, it
is desirable to obtain sequences from a second marker. In this study, sequences of ITS
were obtained from most strigeid species detected with COI data. The merits of ITS and
COI sequences for distinguishing strigeid species are discussed in Chapters 1-3.
3

Molecular discrimination of strigeid species is used to address ecological and
evolutionary questions in Chapters 2-4. Because they cannot be identified to the level of
species morphologically, strigeid metacercariae are generally treated as a relatively small
number of species that occur in a wide assortment of fishes (Margolis and Arthur, 1979;
McDonald and Margolis, 1995; Gibson 1996; Hoffman 1999). Little is known of the true
diversity and host specificity of metacercariae in strigeids or other groups of trematodes
(Chappell 1995; Gibson 1996; Poulin 2007b). There are theoretical reasons for predicting
both narrow and broad host specificity in metacercariae (e.g., Dogiel et al. 1966; de
Meeus 2000; Noble et al. 1989; Adamson and Caira, 1994). However, without a reliable
means of identifying metacercariae to species, evidence related to these predictions
cannot be obtained from field data. As a result, evolutionary and ecological mechanisms
underpinning specificity in metacercariae can only be tested in laboratory settings, which
may not accurately reflect natural processes (Poulin and Keeney 2007) and are
logistically limited to smaller numbers of taxa than field studies.
Chapters 2 and 3 differ in taxonomic scope, but both employ molecular
identifications to assess the diversity and host specificity of strigeid metacercariae.
Chapter 2 is based on molecular data from a large sample oi Diplostomum metacercariae,
which parasitize the eyes offish. Within the strigeids, Diplostomum continues to be a
focus of diverse research (e.g., Chappell 1995, Rauch et al. 2006), including prior studies
of molecular systematics locally and in Europe (Galazzo et al. 2002; Niewiadomska and
Laskowski 2002). Chapter 3 takes a similar approach but encompasses seven strigeid
genera that infect various tissues in the fish host. Both chapters are concerned with both
the extent and mechanisms of host specificity in metacercariae. In surveys of parasites, it
4

is generally impossible to determine whether host specificity arises from physiological
incompatibility between certain species of hosts and parasites (i.e., infection cannot occur
under any circumstances) or from the ecological availability of certain species of hosts to
parasite species (infections can be produced in a laboratory setting, but does not occur in
nature because hosts do not encounter parasites) (Combes 2001). Lester and Huizinga
(1977) suggested that variation in host specificity in species of Diplostomum might arise
from differences in immunological activity faced by species inhabiting different tissues
of the host. Molecular data obtained in this thesis are used to test this hypothesis in
metacercariae of Diplostomum (Chapter 2) and other strigeids (Chapter 3). Mechanisms
of host specificity (ecological availability versus physiological compatibility) are also
evaluated in light of the consistency of parasite distributions across the replicate fish
communities sampled in this study (Chapter 3).
Canadian host-parasite records have been used extensively in studies of
community and evolutionary ecology of freshwater fish parasites (Poulin 2007b).
However, there have been few attempts to duplicate large-scale findings from meta
analyses with original field data. In Chapter 4, the influence of spatial variation on
parasite community similarity is compared to that of host phylogeny using both
molecular and morphological parasite identifications.
Many studies have examined factors that predict similarity in parasite
communities in freshwater fish (Leong and Holmes 1981; Bergeron et al. 1997; Fellis
and Esch 2005a; Goater et al.2005), but few of the factors identified have been shown to
have broad applicability. However, one trend that has repeatedly emerged is a tendency
for parasite communities that are closer together in space to be more similar than distant
5
ones (Poulin and Morand 1999; Poulin 2003; Karvonen and Valtonen 2004; Fellis and
Esch 2005a, b; Karvonen et al 2005a).
Unlike the well-established influence of geographic distance, little work has been
done on how parasite communities vary in more or less distantly related host species.
Poulin (2005, 2010) found that the parasite communities of closely related fish species
show, at most, a weak tendency to be similar. This is counter-intuitive because most
parasites infect a small number of closely related host species (Poulin and Morand 2004;
Poulin 2007b). At the community level, this host specificity should translate into closely
related host species having similar parasite communities. Our dataset includes spatial
replicates offish species that are closely related but ecologically dissimilar and host
species that are ecologically similar but phylogenetically distant, allowing a robust
evaluation of the influence these two types of distance at the level of the parasite
community.
6
Chapter 1 Development of primers for the mitochondrial cytochrome c oxidase I gene in digenetic trematodes (Platyhelminthes) illustrates the challenge of barcoding parasitic helminths*
Introduction
The digenetic trematodes (Platyhelminthes) comprise an estimated 24 000
species, many of which have yet to be described (Poulin and Morand 2004). Adults
parasitize vertebrates and larval stages typically require a mollusk, usually a snail, as the
first intermediate host. Most species also require a second intermediate host, which may
be an invertebrate or a vertebrate, depending upon the species (see Figure 3.1). Some
digeneans, such as Schistosoma spp. and Clonorchis sinensis, are important pathogens in
humans, while many others have serious impacts on animal husbandry, aquaculture and
wildlife management (Roberts and Janovy 2000). Accurate identification of these
parasites is important for the diagnosis, treatment and control of pathogenic infections. It
is also essential in broader studies relating to digenean diversity, distribution and ecology.
Species-level identification of most digeneans is based exclusively on adult
morphology. Difficulties arise because they are small, soft-bodied, have few stable
morphological characters and are subject to host-induced phenotypic variation
(Blankespoor 1974; Graczyk 1991; Perez-Ponce de Leon 1995). These problems are
particularly acute for larval stages, which differ morphologically from the adults and,
with fewer morphological features than adults, are virtually impossible to identify to
* Moszczynska A, Locke SA, McLaughlin JD, Marcogliese DJ, Crease TJ. 2009.
Molecular Ecology' Resources 9, 75-82
7
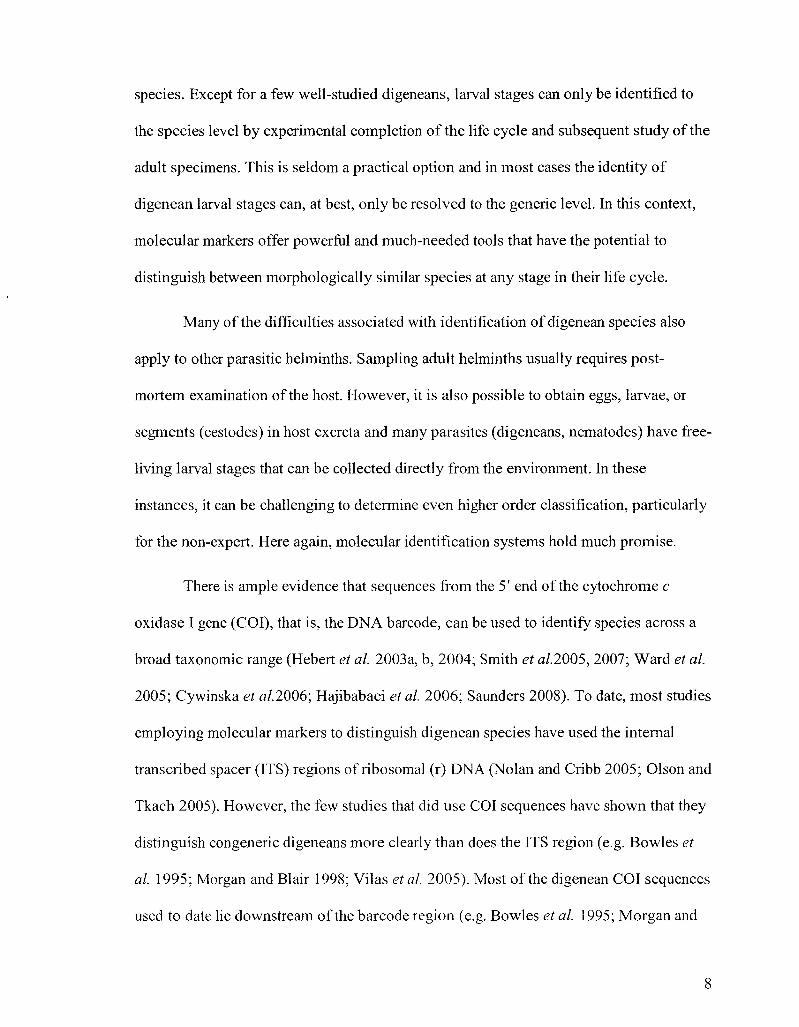
species. Except for a few well-studied digeneans, larval stages can only be identified to
the species level by experimental completion of the life cycle and subsequent study of the
adult specimens. This is seldom a practical option and in most cases the identity of
digenean larval stages can, at best, only be resolved to the generic level. In this context,
molecular markers offer powerful and much-needed tools that have the potential to
distinguish between morphologically similar species at any stage in their life cycle.
Many of the difficulties associated with identification of digenean species also
apply to other parasitic helminths. Sampling adult helminths usually requires post
mortem examination of the host. However, it is also possible to obtain eggs, larvae, or
segments (cestodes) in host excreta and many parasites (digeneans, nematodes) have free-
living larval stages that can be collected directly from the environment. In these
instances, it can be challenging to determine even higher order classification, particularly
for the non-expert. Here again, molecular identification systems hold much promise.
There is ample evidence that sequences from the 5' end of the cytochrome c
oxidase I gene (COI), that is, the DNA barcode, can be used to identify species across a
broad taxonomic range (Hebert et al. 2003a, b, 2004; Smith et a/.2005, 2007; Ward et al.
2005; Cywinska et al.2006; Hajibabaei et al. 2006; Saunders 2008). To date, most studies
employing molecular markers to distinguish digenean species have used the internal
transcribed spacer (ITS) regions of ribosomal (r) DNA (Nolan and Cribb 2005; Olson and
Tkach 2005). However, the few studies that did use COI sequences have shown that they
distinguish congeneric digeneans more clearly than does the ITS region (e.g. Bowles et
al. 1995; Morgan and Blair 1998; Vilas et al. 2005). Most of the digenean COI sequences
used to date lie downstream of the barcode region (e.g. Bowles et al. 1995; Morgan and
8

Blair 1998; Morgan et al. 2005). However, it seems likely that sequences from the
upstream barcode fragment may also provide a useful method for interspecific
differentiation in this group.
A principal advantage of the barcoding approach is that use of a standardized
marker, a ~600-nt fragment at the 5' end of COI, ensures that sequence data are
comparable across studies. A prerequisite to acquiring these data is the development of
primers that amplify this region in the broadest possible range of taxa, thus allowing
samples of unknown taxonomic affinity to be identified to species. The most widely
applicable primers used in barcoding, those of Folmer et al. (1994), are very divergent
from many of the published platyhelminth COI sequences (T. Crease, personal
communication). Herein, we present the preliminary results of efforts to design primers
that will recover barcode sequences in diverse platyhelminths, with particular focus on
the Diplostomoidea (Trematoda: Strigeida). In addition, we assess the usefulness of
sequences from a small region of the nuclear 18S rRNA gene as a preliminary screening
tool in the barcoding of platyhelminth parasites.
Materials and methods
Primer development
Our initial aim was to design primers that would amplify a fragment
corresponding to the barcode region at the 5' end of the COI gene in the broadest possible
range of platyhelminth taxa. We aligned the barcode region of COI from complete
platyhelminth mitochondrial genome sequences available from GenBank in 2006 to
identify regions suitable for primer development. Seventeen sequences were aligned from
9
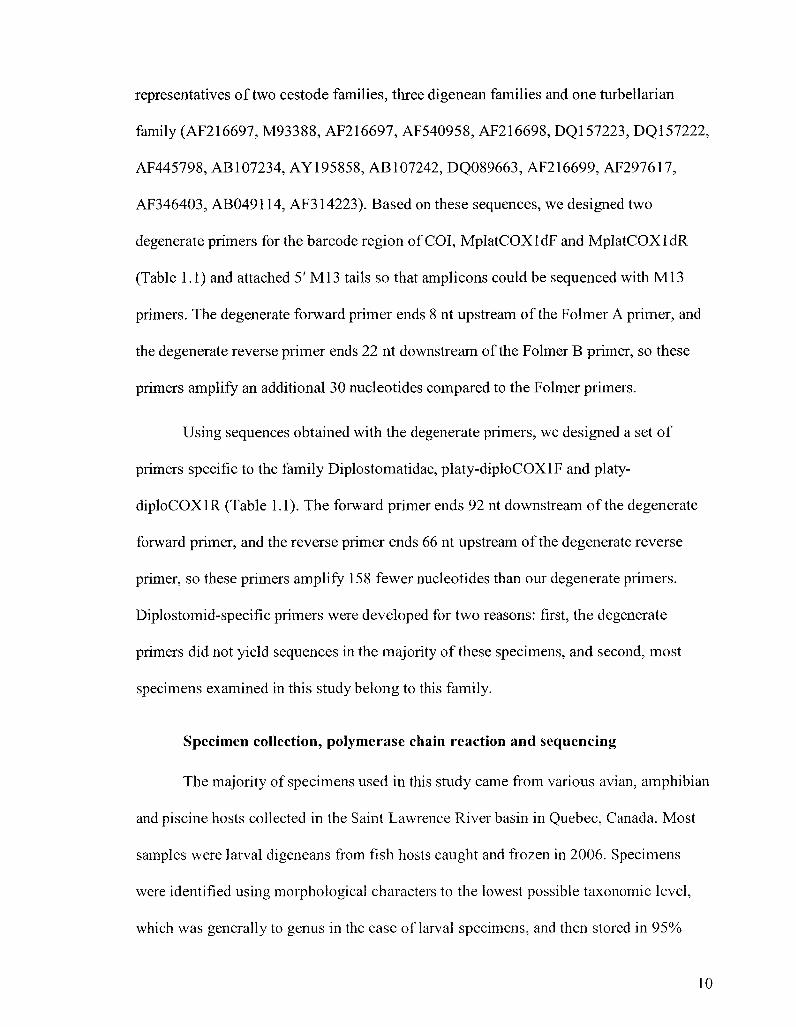
representatives of two cestode families, three digenean families and one turbellarian
family (AF216697, M93388, AF216697, AF540958, AF216698, DQ157223, DQ157222,
AF445798, AB107234, AY195858, AB107242, DQ089663, AF216699, AF297617,
AF346403, AB049114, AF314223). Based on these sequences, we designed two
degenerate primers for the barcode region of COI, MplatCOXldF and MplatCOXldR
(Table 1.1) and attached 5' Ml3 tails so that amplicons could be sequenced with Ml3
primers. The degenerate forward primer ends 8 nt upstream of the Folmer A primer, and
the degenerate reverse primer ends 22 nt downstream of the Folmer B primer, so these
primers amplify an additional 30 nucleotides compared to the Folmer primers.
Using sequences obtained with the degenerate primers, we designed a set of
primers specific to the family Diplostomatidae, platy-diploCOXlF and platy-
diploCOXlR (Table 1.1). The forward primer ends 92 nt downstream of the degenerate
forward primer, and the reverse primer ends 66 nt upstream of the degenerate reverse
primer, so these primers amplify 158 fewer nucleotides than our degenerate primers.
Diplostomid-specific primers were developed for two reasons: first, the degenerate
primers did not yield sequences in the majority of these specimens, and second, most
specimens examined in this study belong to this family.
Specimen collection, polymerase chain reaction and sequencing
The majority of specimens used in this study came from various avian, amphibian
and piscine hosts collected in the Saint Lawrence River basin in Quebec, Canada. Most
samples were larval digeneans from fish hosts caught and frozen in 2006. Specimens
were identified using morphological characters to the lowest possible taxonomic level,
which was generally to genus in the case of larval specimens, and then stored in 95%
10
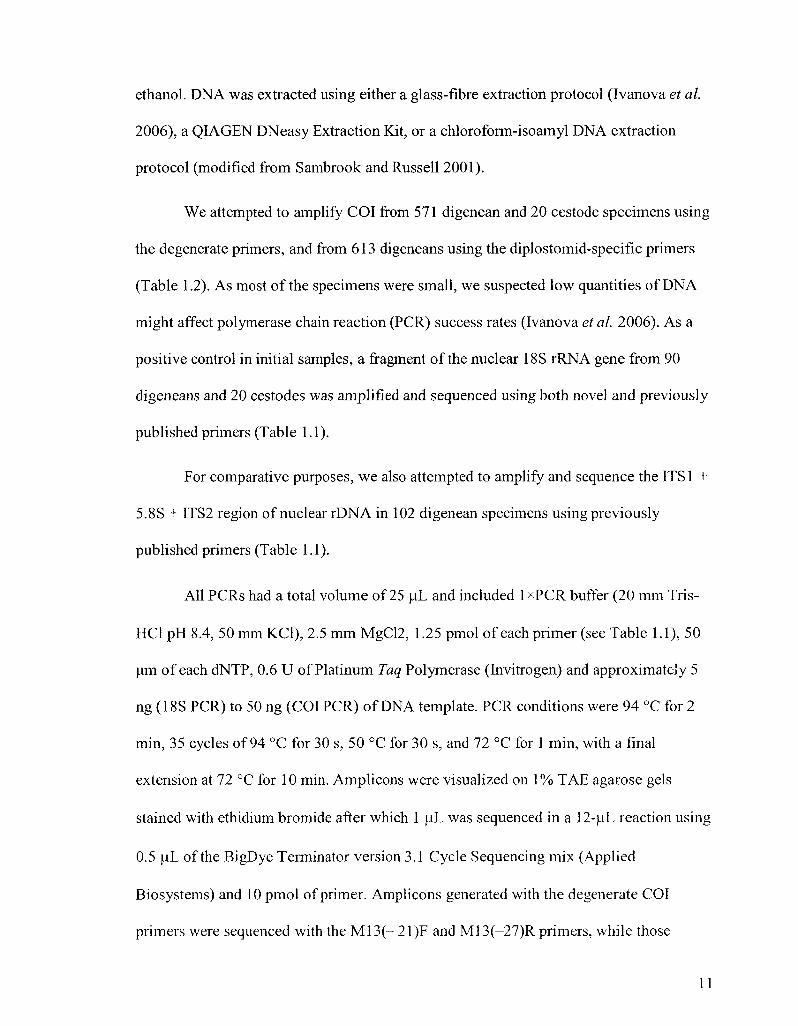
ethanol. DNA was extracted using either a glass-fibre extraction protocol (Ivanova et al.
2006), a QIAGEN DNeasy Extraction Kit, or a chloroform-isoamyl DNA extraction
protocol (modified from Sambrook and Russell 2001).
We attempted to amplify COI from 571 digenean and 20 cestode specimens using
the degenerate primers, and from 613 digeneans using the diplostomid-specific primers
(Table 1.2). As most of the specimens were small, we suspected low quantities of DNA
might affect polymerase chain reaction (PCR) success rates (Ivanova et al. 2006). As a
positive control in initial samples, a fragment of the nuclear 18S rRNA gene from 90
digeneans and 20 cestodes was amplified and sequenced using both novel and previously
published primers (Table 1.1).
For comparative purposes, we also attempted to amplify and sequence the ITS1 +
5.8S + ITS2 region of nuclear rDNA in 102 digenean specimens using previously
published primers (Table 1.1).
All PCRs had a total volume of 25 uT and included lxPCR buffer (20 mm Tris-
HC1 pH 8.4, 50 mm KCl), 2.5 mm MgC12, 1.25 pmol of each primer (see Table 1.1), 50
urn of each dNTP, 0.6 U of Platinum Taq Polymerase (Invitrogen) and approximately 5
ng (18S PCR) to 50 ng (COI PCR) of DNA template. PCR conditions were 94 °C for 2
min, 35 cycles of 94 °C for 30 s, 50 °C for 30 s, and 72 °C for 1 min, with a final
extension at 72 °C for 10 min. Amplicons were visualized on 1% TAE agarose gels
stained with ethidium bromide after which 1 p_L was sequenced in a 12-uL reaction using
0.5 iL of the BigDye Terminator version 3.1 Cycle Sequencing mix (Applied
Biosystems) and 10 pmol of primer. Amplicons generated with the degenerate COI
primers were sequenced with the M13(- 21)F and M13(-27)R primers, while those
11
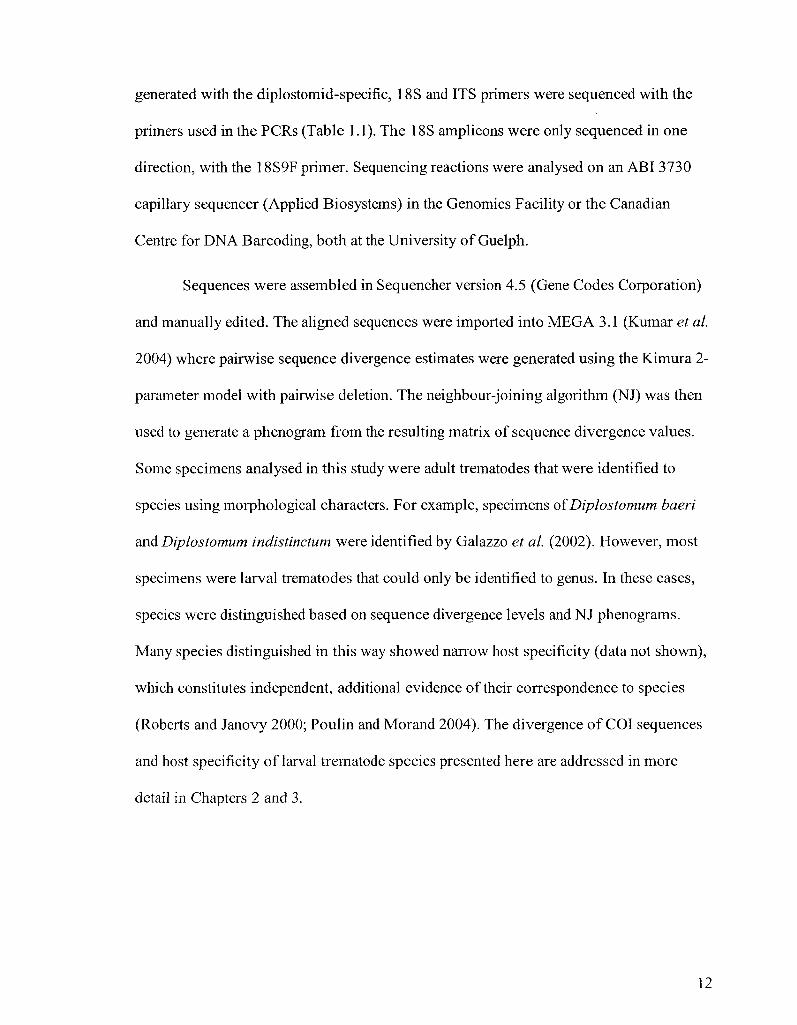
generated with the diplostomid-specific, 18S and ITS primers were sequenced with the
primers used in the PCRs (Table 1.1). The 18S amplicons were only sequenced in one
direction, with the 18S9F primer. Sequencing reactions were analysed on an ABI 3730
capillary sequencer (Applied Biosystems) in the Genomics Facility or the Canadian
Centre for DNA Barcoding, both at the University of Guelph.
Sequences were assembled in Sequencher version 4.5 (Gene Codes Corporation)
and manually edited. The aligned sequences were imported into MEGA 3.1 (Kumar et al.
2004) where pairwise sequence divergence estimates were generated using the Kimura 2-
parameter model with pairwise deletion. The neighbour-joining algorithm (NJ) was then
used to generate a phenogram from the resulting matrix of sequence divergence values.
Some specimens analysed in this study were adult trematodes that were identified to
species using morphological characters. For example, specimens of Diplostomum baeri
and Diplostomum indistinctum were identified by Galazzo et al. (2002). However, most
specimens were larval trematodes that could only be identified to genus. In these cases,
species were distinguished based on sequence divergence levels and NJ phenograms.
Many species distinguished in this way showed narrow host specificity (data not shown),
which constitutes independent, additional evidence of their correspondence to species
(Roberts and Janovy 2000; Poulin and Morand 2004). The divergence of COI sequences
and host specificity of larval trematode species presented here are addressed in more
detail in Chapters 2 and 3.
12

Results
Trematoda
There was no indication that the quantity or quality of DNA in our samples
affected the performance of the COI primers in digeneans. Amplicons of the 18S gene
were obtained in all 90 trematode samples assayed, including 38 in which COI did not
amplify and 58 that failed to yield COI sequences (Table 1.2). In addition, an estimate of
DNA quantity (specimen size) showed no relationship with the probability of sequencing
success (R2 = 0.006, P = 0.824). Only 17 of 102 samples yielded ITS sequences. The
degenerate COI primers yielded amplicons of expected length in 314, and sequences in
231 of the 572 digenean samples assayed, including representatives of five genera in the
Plagiorchiida, two genera in the Echinostomida, and eight genera in the Strigeida (Table
1.2). The diplostomid-specific COI primers yielded amplicons in eight of nine strigeidid
genera tested, and 504 sequences from 610 samples assayed (Table 1.2).
Significantly fewer sequences were obtained with the degenerate COI primers
than with the diplostomid-specific primers (x2 = 289, d.f. = 1, P < 0.0005). In the most
intensively sampled taxa, the degenerate COI primers yielded sequences in 27 of 34
(79%) Diplostomum, 65 of 128 (51%) Posthodiplostomum, 47 of 133 (35%)
Ornithodiplostomum, 42 of 67 (63%) Apatemon, and 9 of 69 (13%) Ichthyocotylurus
samples. Chromatogram trace signals obtained with the degenerate primers were often
unclear for the first 100 to 150 nt at the 5' end. The diplostomid-specific primers
performed best on Diplostomum and Tylodelphys, in which informative sequences were
obtained in 504 of 585 (86%) specimens assayed.
13
Overall, potentially informative sequences (> 150 nt in length) of the barcode
region of COI were obtained in 706 of the 1138 (62%) digenean specimens with one or
both sets of novel primers. Here we report sequences only from single representatives of
each species detected. Bi-directionally sequenced fragments range from approximately
100 to 650 nt in length; the mean length is 442 nt.
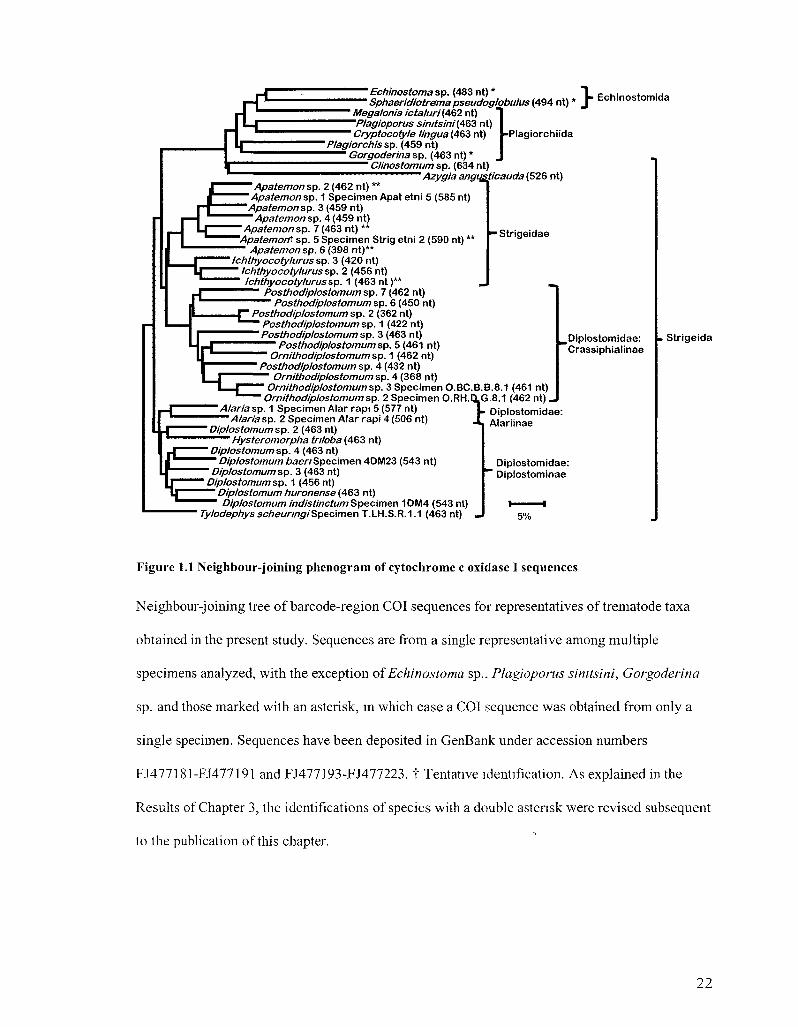
The mean pairwise divergence between congeneric sequences from the barcode
region is 19% (3.9-25%, Figure 1.1). Increasing COI sequence length does not affect
species-level resolution. The topology of NJ trees based on ~480-nt sequences is identical
to those based on fragments that are -70 nt longer (data not shown). Few closely related
specimens yielded both COI and ITS sequences. Barcode-region COI sequences have
diverged by 15% and ITS sequences by 3.9% in two species of Diplostomum (ITS data
from Galazzo et al. 2002), while two species of Ornithodiplostomum show 6.9%
divergence in COI sequences and 4.2% divergence in ITS sequences (Figure 1.2). Short
18S sequences (-380 nt) fail to distinguish two genera (Posthodiplostomum and
Ornithodiplostomum) but resolve higher taxa into distinct clusters (Figure 1.3).
Cestoda
Degenerate COI primers yielded PCR amplicons of expected length in eight of 20
samples comprising representatives of four genera in the Cyclophylhdea. Sequences were
obtained from only a single sample (Hymenolepididae: Cloacotaenia megalops, Barcode
accession FJ477192; data not shown in figures). Amplification of COI was unsuccessful
in 11 other cyclophyllidean genera and in two pseudophyllidean genera (Table 1.2). PCR
amplicons of the 18S gene were generated in all cestode samples, indicating that the
14

quality of DNA templates was unlikely to be the cause of unsuccessful COI
amplification.
Discussion
It was clear from the initial alignment of flatworm COI sequences that the high
level of sequence divergence would make it difficult to design primers that would
successfully amplify this gene across the entire phylum. Indeed, the noisiness of the
upstream portion of sequences acquired with the degenerate primers suggests that short,
non-target amplicons were generated and sequenced along with the primary product.
Nonetheless, the taxonomic range of our specimens that did yield amplicons or
sequences, despite small sample sizes in many groups (Table 1.2), suggests that the
degenerate primers may be useful for barcoding digeneans. In particular, they can be used
to generate preliminary data for the design of barcode-region primers specific to lower
taxonomic groups.
This approach was fruitful with the Diplostomidae, where amplification and
sequencing success was much higher with our family-specific primers. Moreover, as
sequences from the barcode region of COI continue to be published for additional
platyhelminth taxa (e.g. Park et al. 2007), designing primers specific to lower taxa will
become easier.
In other studies using molecular markers to distinguish species, primers specific
to groups recalcitrant to more generalist primers have also been employed (e.g. Morgan
et al. 2005; Smith et al. 2005, 2007; Ward et al. 2005; Hajibabaei et al. 2006; Zarowiecki
et al. 2007; Saunders 2008). This approach requires that samples be partially identified in
15
order to determine which set of primers to use. If only the higher taxonomy of the sample
is known, then a 'cocktail' of primers specific to lower taxonomic groups can be used
(Ivanova et al. 2007). Alternatively, short (~100-nt) sequences generated with 'mini-
barcode' primers can be used to assign samples to family and, in most cases, to species
(Meusnier et al. 2008). However, it remains to be seen whether mini-barcode primers
work with common metazoan parasite taxa such as trematodes and cestodes. With
parasite samples, even higher taxonomy can be difficult to determine. In such cases, we
suggest that a two-tiered approach to DNA barcoding using short sequences from nuclear
rRNA genes could be used to identify a specimen to family. The advantage of these genes
is that it is possible to design primers that are more truly 'universal' and that work
reliably on DNA samples of low quality or quantity (Frezal and Leblois 2008). The 18S
primers used here anneal in highly conserved regions of the gene in flatworms and also
work in a broad range of taxa including arthropods {Daphnia, Drosophila) as well as
vertebrates (lizards, humans) (T. Crease, personal communication). Moreover, longer
sequences from rDNA subunits can resolve specimens to even lower taxonomic levels
(e.g. Mariaux 1998; Olson et al. 2003). We are not advocating the particular 18S gene
region or the primers we used for the purpose of preliminary specimen identification.
Rather, we suggest that short sequences from nuclear rRNA genes or some other easily
recovered target could be amplified with truly universal primers and used to screen
samples of completely unknown taxonomic affinity. This would provide enough
information to select from multiple primer sets for species-level barcoding using the
standard region of the COI gene.
16
There is an additional matter to consider in designing primers for barcoding
parasites. In general, it is desirable that barcoding primers amplify homologous COI
sequences in the broadest possible range of taxa, but this may not be so for parasites.
Parasites are often too small to subsample and are found within hosts, and it is therefore
difficult to obtain uncontaminated tissue. As a result, truly universal primers may amplify
DNA from both host and parasite, resulting in lower-quality or unusable sequence data.
Barcode-region COI sequences yielded good species-level resolution in our
samples. For example, COI sequences showed better interspecific resolution than ITS
sequences, although poor amplification rates with the ITS primers prevented us from
comparing the two markers in many sibling taxa (Figure 1.2). There may be more optimal
markers than COI for identifying species in Schistosoma (Zarowiecki et al. 2007) or other
flatworms (Littlewood et al. 2008), but for barcoding purposes a single marker must be
adopted to ensure comparability. Our data suggest that even with imperfectly universal
primers, the standard region of COI is a practical target for barcoding digeneans.
From a practical perspective, sequences obtained with these novel primers have
enabled us to better understand the diversity in a large sample of larval strigeids from
fishes in the Saint Lawrence River. Although the parasites of freshwater fishes in Canada
are relatively well studied (e.g. Gibson 1996), little is known of the diversity and biology
of some of the most common pathogens, such as Diplostomum spp. (Galazzo et al. 2002).
Cryptic species occur in these taxa and, as discussed in Chapters 2 and 3, a barcoding
approach allows us to make considerable advances on questions concerning species
diversity, geographical distribution, and host spectra of these problematic pathogens.
17
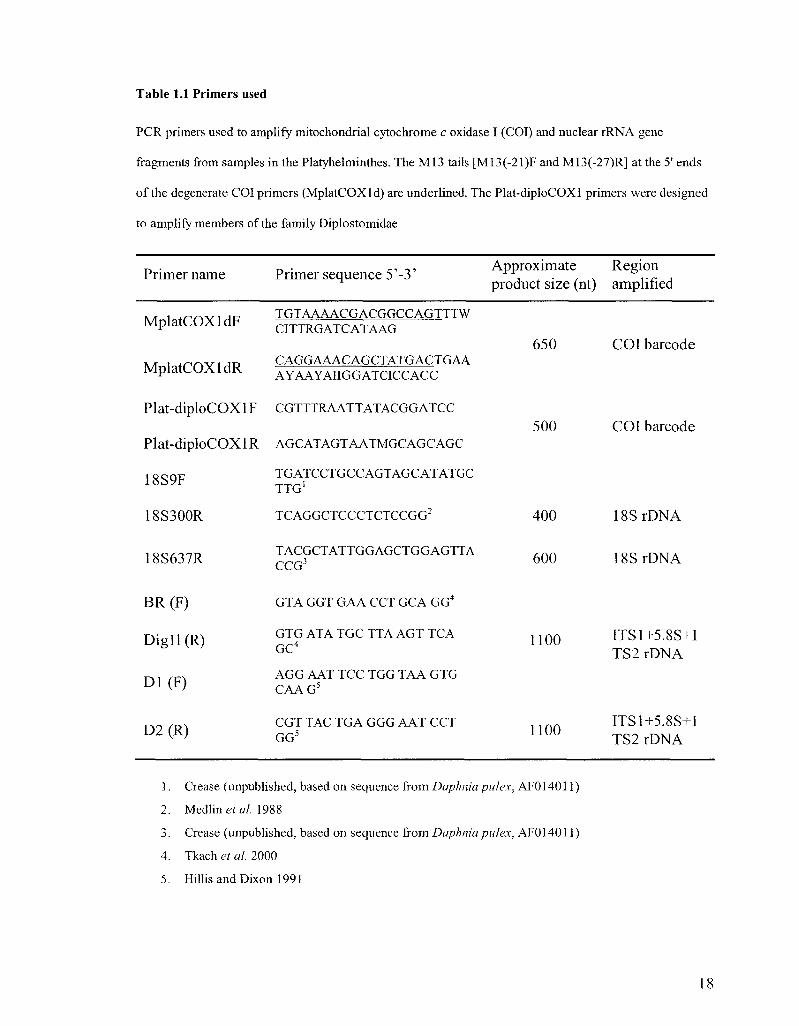
Table 1.1 Primers used
PCR primers used to amplify mitochondrial cytochrome c oxidase I (COI) and nuclear rRNA gene
fragments from samples in the Platyhelminthes. The M13 tails [M13(-21)F and M13(-27)R] at the 5' ends
of the degenerate COI primers (MplatCOXld) are underlined. The Plat-diploCOXl primers were designed
to amplify members of the family Diplostomidae
Primer name Primer sequence 5'-3' Approximate Region product size (nt) amplified
IVT 1 t r n v i H F TGTAAAACGACGGCCAGTTTW MplatUUXldr* CITTRGATCATAAG
IVT i t r r w IHT? CAGGAAACAGCTATGACTGAA MplatCUAldK AYAAYAIIGGATCICCACC
Plat-diploCOXlF CGTTTRAATTATACGGATCC
Plat-diploCOXl R AGCATAGTAATMGCAGCAGC
18S9F TGATCCTGCCAGTAGCATATGC TTG1
18S300R
18S637R
BR(F)
Digl l (R)
D1(F)
D2(R)
TCAGGCTCCCTCTCCGG"
TACGCTATTGGAGCTGGAGTTA CCG3
GTA GGT GAA CCT GCA GG4
GTG ATA TGC TTA AGT TCA GC4
AGG AAT TCC TGG TAA GTG CAAG5
CGT TAC TGA GGG AAT CCT GG5
650
500
400
600
1100
1100
COI barcode
COI barcode
18SrDNA
!8SrDNA
ITS1+5.8S+I TS2 rDNA
ITS1+5.8S+I TS2 rDNA
1. Crease (unpublished, based on sequence from Daphnia pulex, AF014011)
2. Medline*«/. 1988
3. Crease (unpublished, based on sequence from Daphnia pulex, AF014011)
4. Tkach et al. 2000
5. Hillis and Dixon 1991
18
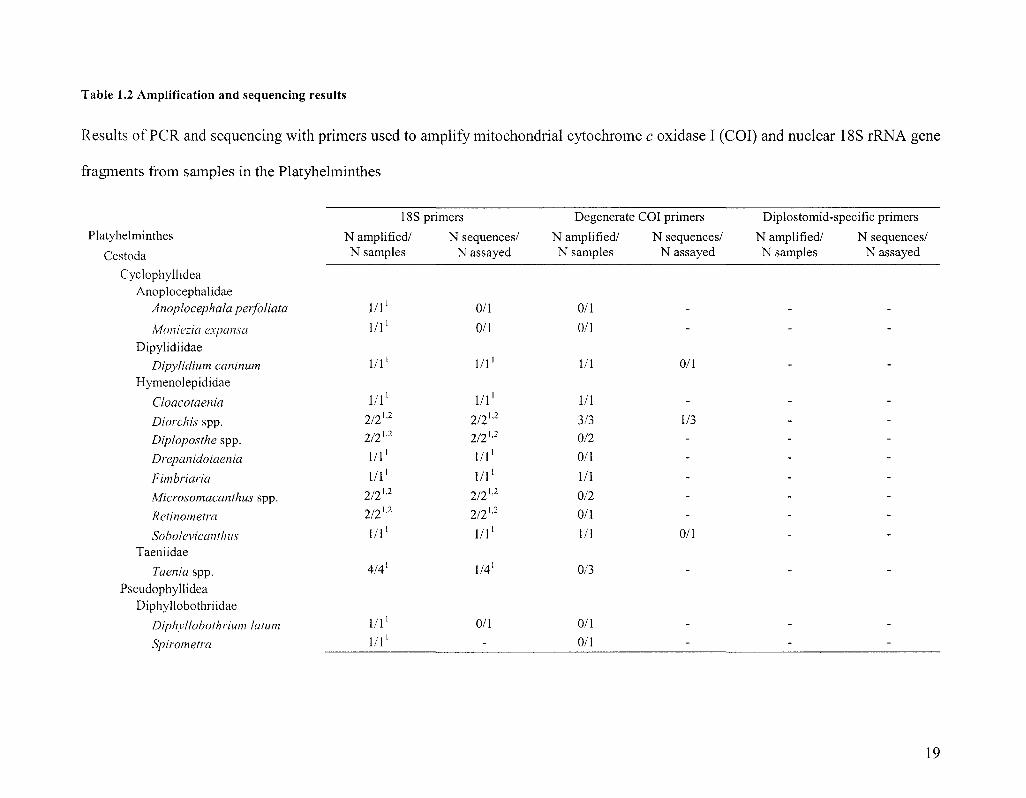
Table 1.2 Amplification and sequencing results
Results of PCR and sequencing with primers used to amplify mitochondrial cytochrome c oxidase I (COI) and nuclear 18S rRNA gene
fragments from samples in the Platyhelminthes
18S primers
N amplified/ N sequences/ N samples N assayed
Degenerate COI primers
N amplified/ N sequences/ N samples N assayed
Diplostomid-specific primers
N amplified/ N sequences/ N samples N assayed
Platyhelminthes
Cestoda
Cyclophyllidea Anoplocephalidae
Anoplocephala perfoliata
Moniezia expansa
Dipylidiidae
Dipylidium caninum
Hymenolepididae
Cloacotaenia
Diorchis spp.
Diploposthe spp.
Drepanidotaenia
Fimbriaria
Microsomacanthus spp.
Rctinometra
Soholevicanthus Taeniidae
Taenia spp.
Pseudophyllidea Diphyllobothriidae
Diphyllobothrium latum
Spirometra
N amplified/ N samples
1/1'
1/1'
l / l 1
1/1'
2/2 u
2/2 u
l / l 1
l / l1
2/2 u
2/21-2
l / l 1
4/4'
l / l1
l / l 1
N sequences/ N assayed
0/1
0/1
1/1'
l / l1
2/2]'2
2/2 U2
l / l 1
l / l 1
2/2 u
2/2 ''2
1/1'
1/41
0/1
-
N ampli N samr.
0/1
0/1
1/1
1/1
3/3
0/2
0/1
1/1
0/2
0/1
1/1
0/3
0/1
0/1
0/1
1/3
0/1
19

Table 1.2. Continued 18S primers
N amplified/ N sequences/ N samples N assayed
Trematoda
Echinostomida
Echinostomatidae
Echinostoma spp. 1/1 1/1 Sphaeridiotrema 1/1 1/1 Stephanoprora 1/1 ' 1/10/1
Paramphistomatidae
Megalodiscus Psilostomidae
Ribeiroia
Plagiorchiida
Allocreadiidae
Bunodera sacculata Megcdogonia
Cryptogonimidae
Centrovarium lobotes 2/2 2/2 Cryptogonimus chili 1/1 1/1
Gorgoderidae
Gorgoderina Phyllodistomum
Heterophyidae
Apophallus 2/2 2/2
Cryptocotyle Macroderoididae
Alloglossidium gemimum 1/1 1/1 Choledocvstus intermedius 1 / 1 ' '2 0/1' '2
Degenerate COI primers Diplostomid-specific primers
N amplified/ N sequences/ N amplified/ N sequences/ N samples N assayed N samples N assayed
1/5 1/1 0/4
1/5 0/1 -
-0/1 1/1
5/11 3/5
0/3
0/1 2/2
1/2 1/5
1/1 0/1
1/12
5/8
0/1 1/1
-2/2
0/1 0/1
1/1
-
0/1 5/5
_ -
1/2 0/1
20

Table 1.2. Continued 18S primers
N amplified/ N sequences/ N samples N assayed
Degenerate COI primers
N amplified/ N sequences/ N samples N assayed
Diplostomid-specific primers
N amplified/ N sequences/ N samples N assayed
Opecoelidae
Plagioporus sinitsini
Plagiorchiidae
Haematoloechus
PI agi orchis
Strigeida
Azygiidae
Azygia
Clinostomidae
Clinostomum
Cyathocotylidae
Cyathocotyle
Diplostomidae
Alaria spp.
Fibricola
Ornithodiplostomum spp.
Posthodiplostomum
Uvu lifer
Diplostomum
Hysteromorpha
Tylodelphys scheuringi
Strigeidae
Apatemon (tetracotyle)
Ich thyocotylurus
Schistosomatidae
-
-
-
-
2/2'
1/1'
7/7' 6/62
4/4'
24/24' 15/172
15/15' 13/132
-
10/10' 5/52
-
2/2' l / l 2
9/91 l / l 2
2/2'
-
-
-
-
-
2/2'
l / l1
6/7' 1/22
4/4'
21/24' 2/22
12/15' 1/22
-
9/10' l / l2
-
2/2' l / l 2
9/91 l / l 2
2/2'
-
1/2
6/10
5/5
7/15
8/9
0/1
6/6
0/4
68/133
83/128
7/14
30/34
7/9
0/2
46/67
21/69
0/3
1/1
0/6
5/5
7/7
6/6
-
6/6
-
47/68
65/83
0/7
27/29
4/7
-
42/46
9/21
-
-
-
-
-
2/2
1/1
2/2
1/4
8/8
4/4
-
492/548
-
34/37
-
0/2
-
-
-
-
-
-
-
0/2
0/1
0/8
0/4
-
471/492
-
33/34
-
-
-1 18S9Fand300R 2 18S9Fandl8S637R - = not assayed
21
^ ~ Echinostoma sp . (483 nt) * T """"" Sphaeridiotrema pseudoglobulus (494 nt) * J ' Megalonia icta/uri (462 nt) "1 ~P/agioporus simtsini (A&Z nt) I 1 Cryptocotyle lingua (463 nt) ^P lag iorch i ida
Echinostomida
* Plagiorchis sp. (459 nt) Gorgoderina sp. (463 nt) *
Clinostomum sp. (634 nt) Azygia angugticauda (526 nt)
r Apatemon sp. 2 (462 nt) **
Apatemon sp. 1 Specimen Apate tn i 5 (585 nt) Apatemon sp. 3 (459 nt)
Apatemon sp. 4 (459 nt) Apatemon sp. 7 (463 nt) **
'Apatemort sp. 5 Specimen Strig etni 2 (590 nt) ** ~ Apatemon sp. 6 (398 nt)**
Ichthyocotylurus sp. 3 (420 nt) Ichthyocotylurus sp. 2 (456 nt) Ichthyocotylurus sp. 1 (463 nt )**
Posthodiplostomum sp. 7 (462 nt) Posthodiplostomum sp. 6 (450 nt)
—Strigeidae
Posthodiplostomum sp. 2 (362 nt) "" Posthodiplostomum sp. 1 (422 nt)
Posthodiplostomum sp. 3 (463 nt) —"~ Posthodiplostomum sp. 5 (461 nt) "• Ornithodiplostomum sp. 1 (462 nt) Posthodiplostomum sp. 4 (432 nt)
Ornithodiplostomum sp. 4 (368 nt) Ornithodiplostomum sp. 3 Specimen O.BC.B.B.8.1 (461 nt)
Ornithodiplostomum sp. 2 Specimen O.RH. 116.8.1 (462 n t ) . i.CLG
^Dip los tomidae: Crassiphial inae
Alaria sp. 1 Specimen Alar rapi 5 (577 nt) A/aria sp. 2 Specimen Alar rapi 4 (506 nt)
Diplostomum sp. 2 (463 nt) Hysteromorpha triloba (463 nt)
Diplostomum sp. 4 (463 nt) Diplostomum baeri Specimen 4DM23 (543 nt)
Diplostomum sp. 3 (463 nt) Diplostomum sp. 1 (456 nt)
Diplostomum huronense (463 nt) Diplostomum indistinctum Specimen 1DM4 (543 nt)
7y/ocfep/7yssc/7e«/7/?p/SpecimenT.LH.S.R.1.1 (463 nt) _
Oiplostomidae: Alari inae
Oiplostomidae: ' Diplostominae
5%
. Str igeida
Figure 1.1 Neighbour-joining phenogram of cytochrome c oxidase I sequences
Neighbour-joining tree of barcode-region COI sequences for representatives of trematode taxa
obtained in the present study. Sequences are from a single representative among multiple
specimens analyzed, with the exception of Echinostoma sp., Plagioporus simtsini, Gorgoderina
sp. and those marked with an asterisk, in which case a COI sequence was obtained from only a
single specimen. Sequences have been deposited in GenBank under accession numbers
FJ477181-FJ477191 and FJ477193-FJ477223. t Tentative identification. As explained in the
Results of Chapter 3, the identifications of species with a double astensk were revised subsequent
to the publication of this chapter.
22

(a) ITS1 + 5.8S + ITS2
tt
Diplostomum baeri Specimen 4DM23 (1074 nt)
Diplostomum indistinctum Specimen 1DM4 (1078 nt) -Tylodelphys scheuringi Specimen T.LH.S.R.1.1 (1057 nt)
0.02
(b) Barcode-region COI
, Ornithodiplostomum sp. 2 Specimen O.BC.O.B.G.2.1 (1037 nt)
. Ornithodiplostomum sp. 3 Specimen O.BC.B.B.8.1 (726 nt)
Tylodelphys scheuringi Specimen T.LH.S.R.1.1 (462 nt)
r< Ornithodiplostomum sp. 2 Specimen O.BC.O.B.G.2.1 (186 nt)
Ornithodiplostomum sp. 2 Specimen O.RH.D.G.8.1 (459 nt)
Ornithodiplostomum sp. 3 Specimen O.BC.B.B.8.1 (458 nt)
_ _ _ _ _ Diplostomum baeri Specimen 4DM23 (537 nt)
Diplostomum indistinctum ' Specimen 1DM4 (534 nt)
2%
Figure 1.2 Neighbour joining phenograms of cytochrome c oxidase I and internal transcribed spacer
sequences
Comparison of taxonomic resolution provided by rDNA and COI sequences from
specimens in the trematode family Diplostomidae. (a) Neighbour-joining tree of
ITS1+5.8S+ ITS2 rDNA sequences from closely related specimens barcoded in this study,
(b) Neighbour-joining tree of barcode-region COI sequences from the same specimens as
(a). Sequences of rDNA have been deposited in GenBank under accession numbers
FJ469594-FJ469596; rDNA sequences from D. baeri (AY 123042) and D. indistinctum
(AY123043) are from Galazzo et al. (2002).
23

rT
4.
Alaria sp. 2 Specimen Alar rapi i"l striaeida-
I * Diplostomidae: Alaria sp. 1 Specimen Alar rapi 5 I Alariinae
Ornithodiplostomum sp. | Strigeida: Diplostomidae: Crassiphialinae
3i 5 1
y Posthodiplostomum sp. 3
Apatemon sp. 1 Specimen Apat etni
Apatemon1 sp. 5 Specimen Strig etni :} Strigeida: Strigeidae
4Z
_ _ ^ Stephanoprora sp. (Echinostomatidae)
Sphaeridiotrema sp. ^™'"™ (Psilostomatidae)
_ Diplostomum baeri I Strigeida: * • Diplostomidae
Diplostomum huronense J Diplostominae
} Echinostomida
Diploposthe sp.
Diorchis sp. 1
Diorchis sp. 2
1% }
•Trematoda
Cestoda: Cyclophyllidea: Hymenolepididae
Figure 1.3 Neighbour joining phenogram of 18S rRNA sequences
Neighbor-joining tree generated from partial 18S rRNA gene sequences (380 nt) from
representatives of the class Trematoda (subclass Digenea), and the class Cestoda in the
phylum Platyhelminthes. Sequences have been deposited in GenBank under accession
numbers FJ469581-FJ469593. t Tentative identification, revised to Conodiplostomum sp.
5 subsequent to publication of this chapter (see Chapter 3).
24

Chapter 2 Diversity and specificity in Diplostomum spp. metacercariae in freshwater fishes revealed by cytochrome c oxidase I and internal transcribed spacer sequences*
Introduction
Metacercariae of digenetic trematodes belonging to the genus Diplostomum
parasitize freshwater fishes and (rarely) amphibians throughout the Holarctic. Most
Diplostomum spp. infect tissues of the eye, with 10 - 100 parasites per eye common in
younger fishes while thousands may occur in older hosts (Shostak et al. 1987;
Marcogliese and Compagna 1999). Metacercariae can impair vision resulting in alteration
of feeding and other behaviours and lead to poor growth. Diplostomids have been
implicated in losses of wild and farmed fish both by direct mortality and by increasing
the susceptibility of infected fish to predation (reviewed by Chappell et al. 1994).
Chappell (1995) stressed the need for a reliable means of species-level
identification of diplostomid metacercariae because pathology, monitoring and control
measures might vary among species. Reliable identification oi Diplostomum spp. is also
important in studies dealing with susceptibility and resistance (Karvonen et al. 2004a, b,
2005b), infectivity (Voutilainen and Taskinen 2009), host manipulation (Rintamaki-
Kinnunen et al. 2004; Seppala et al. 2005a, b, c, 2006), population genetics (Rauch et al.
2005) and evolutionary biology (Rauch et al. 2006, 2008), especially where multiple
species may infect a single site within a host.
* Locke SA, McLaughlin JD, Dayanandan S, Marcogliese DJ. 2009. International
Journaljor Parasitology, online early, doi: 10.1016/j.ijpara.2009.08.012
25

Identification of diplostomid species is difficult at all stages of the life cycle but is
particularly so for the metacercaria. The simple morphology of these small, soft-bodied
larval stages varies with parasite age and host species and is not reliable for
discriminating between species (Graczyk 1991; Niewiadomska and Szymanski 1991).
Consequently, many early records of different Diplostomum spp. in fishes from Europe
are based on erroneous identifications (Niewiadomska 1996). In Canadian fishes,
Diplostomum spathaceum has been the most commonly reported species, accounting for
37 of 117 records compiled by Margolis and Arthur (1979) and McDonald and Margolis
(1995), but records of this and other species are also questionable (Gibson 1996;
Marcogliese et al. 2001a, b; Galazzo et al. 2002).
Molecular data provide an alternative to morphology for identifying species. In
contrast to morphology, DNA sequences can be used to identify species at all
developmental stages, a major advantage for studying parasites with complex life cycles
(Criscione et al. 2005). Molecular studies of Diplostomum spp. boundaries have
compared sequences of the internal transcribed spacer (ITS) regions of rDNA in species
that differ in morphology and life history (Galazzo et al. 2002; Niewiadomska and
Laskowski 2002). Five European species and three North American species of
Diplostomum can be distinguished based on divergence in ITS sequences ranging from
1.6% to 4.6% (Galazzo et al. 2002; Niewiadomska and Laskowski 2002). However, ITS
data are ineffective for distinguishing a pair of Diplostomum spp. from Europe
(Niewiadomska and Laskowski 2002) and provide ambiguous information for what may
be a pair of cryptic species in North America (Galazzo et al. 2002). Sequence divergence
26
can also be used to detect undescribed species, although the practice of delimiting new
species based on rDNA sequence divergence alone has been criticized (Kunz 2002).
While most studies using molecular markers to distinguish trematode species have
used ITS data, a smaller number of studies have employed sequences of the cytochrome c
oxidase I (COI) gene (Nolan and Cribb 2005; Olson and Tkach 2005). Platyhelminth COI
sequences are more variable than those of the ITS regions and are predicted to provide a
greater number of markers useful for species-level identifications (Vilas et al. 2005). The
first 650 bp of COI have been widely used as a DNA "barcode", an approach that has
proven particularly useful for discriminating sibling species in numerous higher taxa
(Hebert et al. 2003a, b; Frezal and Leblois 2008). Moszczynska et al. (2009) developed
diplostomid-specific primers flanking the barcode region of COI and presented
preliminary data showing that these sequences discriminate between congeneric species
in the Diplostomoidea. Here again, however, delimiting species solely on the basis of
COI data is controversial (Desalle et al. 2005; Hickerson et al. 2006; Frezal and Leblois
2008).
A principal goal of this study was to characterize the diversity of Diplostomum in
fishes of the St. Lawrence River, Canada, using sequences from the barcode region of
COI. We employed ITS data to corroborate our COI-based findings, compare the species
resolution of the two markers, and link our specimens to Diplostomum spp. in our study
area that were identified by Galazzo et al. (2002) based on adult morphology and ITS
data. Galazzo et al. (2002) also found that the ITS1 data then available showed that the
North American Diplostomum fauna is separate from and basal to European species.
Herein we re-examine the evolutionary relationship of the European and North American
27
Diplostomum spp. based on a larger, more dispersed and more diverse sample of
sequences.
A further objective was to evaluate hypotheses relating to the specificity of
Diplostomum metacercariae. A variety of accounts indicate that metacercariae of
Diplostomum spp. differ in host specificity (Chappell et al. 1994; Niewiadomska 1996),
but this is impossible to study with conventional approaches in a field setting and
taxonomic uncertainty makes it difficult to generalize from the literature. Laboratory
studies also show that Diplostomum metacercariae are tissue-specific, but beyond a
tendency to infect ocular and cerebral tissue, the site-specificity of different species has
not been directly compared. In addition, if Diplostomum spp. are site-specific, there may
be differences in the host-specificity of species inhabiting different tissues. Lester and
Huizinga (1977) suggested that species in immunologically privileged sites such as the
lens may be able to infect a larger and more diverse spectrum of hosts because of weaker
selection for host specificity. Species inhabiting other tissues confront more vigorous
immune responses that may vary in different host taxa, and should therefore specialize on
a smaller number of more closely related hosts.
Materials and methods
Specimen collection
The majority of Diplostomum specimens examined in this study were
metacercariae taken from 705 fishes representing six species, namely bluntnose minnow
(Pimephales notatus), golden shiner (Notemigonus aysoleucas), pumpkinseed (Lepomis
gibbosus), rock bass (Ambloplites rupestris), johnny darter (Etheostoma nigrum) and
28

yellow perch (Perca flavescens). About 20 fish from each species were caught with a
beach seine at each of six sampling localities in the St. Lawrence River near Montreal,
Quebec, Canada (Figure 2.1; for sample sizes see Figure 2.2 and also Table 3.2). Fishing
took place during a 3-week period in June 2006 and only 1+ year-class, or the smallest
sized fish available, were collected. By simultaneously sampling young hosts, we ensured
that fish were local to collection localities (not migrants) and had been exposed to the
same pool of Diplostomum spp. for the same amount of time and during the same period.
Metacercariae were also taken from smaller numbers of hosts in 15 other fish species and
one amphibian species collected at the same and additional localities in the St. Lawrence
River. Fish were killed in an overdose of clove oil/ethanol solution (50 mg/10 ml/L H2O)
and frozen until dissection. Although only Diplostomum is discussed herein, each entire
fish was examined for parasites using standard techniques (Marcogliese 2002;
www.eman-rese.ca/eman/ecotools/protocols/freshwater/parasites). Upon removal from
the host, metacercariae were fixed in 95% or absolute ethanol for molecular work. It was
not feasible to extract and sequence DNA from all -5,000 metacercariae encountered and
different strategies were adopted to sample metacercariae in different tissues of the
various host species. Molecular identification was attempted for all metacercariae in low-
abundance niches (the lenses of pumpkinseed, johnny darter, rock bass and yellow perch,
and non-lens tissues of bluntnose minnows) and in a sub-sample of parasites in higher-
abundance niches (the vitreous humour of yellow perch and lenses of bluntnose minnows
and golden shiners).
Adult Diplostomum specimens were obtained by feeding fish, or the eyes thereof,
to 16 ring-billed gull (Larus delawarensis) chicks raised from eggs collected at a colony
29
near Montreal (see also Galazzo et al. 2002). Others were taken from herring gulls (Lams
argentatus) collected at the Delta Waterfowl Research Station, Delta, Manitoba, Canada
and ring-billed gulls culled for pest-control at a landfill north of Montreal. One specimen
was obtained from a great black-backed gull (Larus marinus) found dead in
Kangiqsualujjuaq, Northern Quebec, Canada. Thus, sampling was geographically
concentrated in the St. Lawrence River, but specimens from other areas of North America
were also collected (Figure 2.1).
Specimen vouchering, DNA extraction and sequencing
DNA was extracted from 497 metacercariae and 135 adult Diplostomum.
Amplification and sequencing of COI was performed using the diplostomid-specific
primers and PCR protocols of Moszczynska et al. (2009) at the Canadian Centre for
DNA Barcoding (CCDB) in Guelph, Ontario. The ITS region was amplified and
sequenced in 21 of these specimens at the CCDB following protocols and using the
primers described by Galazzo et al. (2002).
For most of the adult Diplostomum specimens, only the forebody or a portion
thereof was used for DNA extraction (see Galazzo et al. 2002). The remainder of the
specimen was stained in dilute acetocarmine, cleared in clove oil, and mounted in Canada
balsam on a slide to serve as a morphological voucher for sequence data. After further
study, these voucher specimens will be deposited at the Canadian Museum of Nature
(Ottawa, ON, Canada). In addition, we obtained COI sequences from archived DNA of
three vouchered adult specimens each of Diplostomum indistinctum and Diplostomum
baeri studied by Galazzo et al. (2002). Some adult specimens were not sub-sampled and
were consumed entirely during DNA extraction.
30
Molecular data analysis
In most cases, forward and reverse trace files provided unambiguous sequences
that required only minor post-alignment editing using Sequencher 4.8 (2008, Gene
Codes, Ann Arbor MI, USA). In approximately 150 cases, it was necessary to edit trace
files before they could be aligned to generate a bi-directional sequence, and in a few (<
30) cases, sequences were obtained from single forward or reverse traces; manual editing
of the latter sequences was done in Contig Express (Invitrogen, Carlsbad, CA, USA).
Barcode-region COI nucleotide sequences were aligned using ClustalX (Thompson et al.
1994). ITS trace files were edited and aligned in Contig Express (Invitrogen, Carlsbad,
CA, USA). Distances between sequences of COI and ITS were analyzed using the
Kimura 2-parameter model of base substitution (Kimura, 1980) and visualized in
Neighbour-Joining (NJ) trees constructed with Mega 4.0 (Tamura et al. 2007) with
complete deletion of gaps. Maximum parsimony (MP) analysis of ITS sequences
obtained in this study and from GenBank was carried out in Mega 4.0 (Tamura et al.
2007). Within- and between species divergence in ITS and COI sequences were
calculated based on uncorrected p-distances using Mega 4.0 (Tamura et al. 2007).
COI sequences were obtained from over 600 individual Diplostomum specimens,
but herein we present only 28 representative sequences. These include sequences from all
species detected and from 21 specimens that yielded both COI and ITS sequences.
31
Species discrimination and identification
Species were distinguished and, where possible, identified based on at least one of
multiple lines of evidence: (i) clustering in NJ trees of sequences of COI and (ii) of
rDNA; (iii) patterns of host and (iv) infection-site-specificity observed in species-clades
distinguished by sequences; (v) comparison of ITS sequences with those published by
Galazzo et al. (2002), Niewiadomska and Laskowski (2002) and on GenBank; (vi)
comparison with COI sequences obtained from specimens identified by Galazzo et al.
(2002), and (vii) preliminary examination of adult voucher specimens.
Specificity for host species and tissues
All Diplostomum metacercariae encountered in this study occurred in cerebral or
ocular tissues and were recorded as being in the lens, vitreous humour or brain. No
distinction was made between the sub-retinal space, retina and vitreous humor because
metacercariae in these sites often detach in frozen material. The relationship between the
infection site of Diplostomum spp. and host specificity was examined in two ways. The
numbers of specialist and generalist species occurring in a low-immune-activity site (the
lens) were compared with the numbers of species in higher-immune-activity sites (non-
lens tissues) using a Fisher's exact test. Diplostomum spp. were classified as either host
specialists or generalists based on the species richness of the host spectrum (i.e., host
range) and the mean taxonomic distance between hosts (Poulin and Mouillot 2003). The
latter index, STD, is a measure of the phylogenetic diversity of hosts that varies relatively
little with sample size (Poulin and Mouillot 2003). STD was calculated as the number of
steps in a Linnaean hierarchy to a common tax on, based on the classifications of genus,
subfamily, family, order, superorder and class in Nelson (2006), such that, for example,
32
bluntnose minnow (Pimephales notatus) was six units from yellow perch and two units
from golden shiner (Notemigonus crysoleucas) (see inset to Figure 4.5). The effect of
lens infection on the host-specificity of metacercariae was also assessed using analysis of
covariance (ANCOVA) and multiple regression in order to account for sampling effort.
To further ensure that rarity of species did not produce overestimates of host specificity,
records of identified metacercariae were randomly reshuffled with host records to
calculate the probability of obtaining the observed host specificity by chance using
Resampling Stats for Excel (Statistics.com, LLC, Arlington, Virginia, USA). Analyses
relating to specificity included only species of Diplostomum in which metacercariae were
identified from more than one individual host.
Results
Species discrimination and identification
Approximately 5,000 Diplostomum spp. metacercariae were found during the
course of this study. Among six intensively sampled host species (Figure 2.2),
metacercariae were most abundant in the vitreous humour of yellow perch and lenses of
bluntnose minnow and golden shiner (high-abundance niches). Metacercariae were much
less abundant in the lenses of pumpkinseed, rock bass, johnny darter and yellow perch
and in non-lens sites of all hosts except yellow perch (low-abundance niches) (Figure
2.2). Sequences from the barcode region of COI were obtained from 497 of 632
metacercariae in which sequencing was attempted, representing 77% of metacercariae
found in low-abundance niches and 5% of those found in high-abundance niches.
33

Sequences of COI up to 610 bp long were obtained from 632 Diplostomum
specimens, of which 21 also yielded ITS sequences. Based on sequences and patterns in
host- and tissue-specificity, 12 species of Diplostomum were detected in the St. Lawrence
River (Table 2.1). On average, sequences of both markers varied at least 10 times more
between species than within species. The mean interspecific divergence in COI sequences
among the 632 specimens and 12 species was 12% (9.9 - 15.1%); mean intraspecific
divergence was 0.5% (0.16 - 0.87%) (uncorrected p-distance). Among the 21 specimens
and nine species for which ITS data were obtained, and including sequences from an
additional 13 specimens reported by Galazzo et al. (2002) (total n = 34), mean
interspecific divergence was 1.97% (0.35 - 3.27%) and mean intraspecific divergence
was 0.05% (0 - 0.29%) (uncorrected p-distance, pairwise deletion of gaps).
Intraspecific variation was strongly correlated with the number of specimens
sampled for both COI (r = 0.959, P < 0.0005, n = 7) and ITS sequences (r = 0.925, P =
0.025, n = 5) (Figure 2.3). Among 612 COI sequences over 300 bp in length and with less
than 1% ambiguous bases, the relationship is best described by a semi-logarithmic curve
indicating a threshold of intraspecific variation of less than 1%. Among the 34 ITS
sequences obtained in this study and from Galazzo et al. (2002), there is no indication
that a threshold of intraspecific variation has been reached.
The relationship between intraspecific variation and specimens sampled per
species could also be a result of variations in effective population size of different
Diplostomum spp. To evaluate this, intraspecific divergence in COI was examined in
1,000 rarefactions of samples (n = 20) for five species in which more than 20 sequences
were obtained. Intraspecific variation in rarefied samples was much the same as when all
34

samples were included (Figure 2.3). Diplostomum baeri appears to be among the most
common species in the system (Figure 2.2), and it would therefore be expected have the
largest effective population size and show the highest intraspecific variation in COI
sequences. Over 60% of the Diplostomum metacercariae in all six well sampled host
species occurred in vitreous humour of yellow perch, and almost all specimens identified
in this site were D. baeri. However, the intraspecific divergence of D. baeri does not
indicate a larger effective population size than other species.
We linked our specimens with the identifications of previous authors through
sequence comparison. Nine specimens had rDNA sequences identical or highly similar to
consensus sequences of Diplostomum huronense or D. indistinctum published by Galazzo
et al. (2002) or to variants of the consensus sequences described by the authors (Tables
2.1 and 2.2). Sequences of the barcode region of COI from archival DNA from
specimens of D. indistinctum and D. baeri studied by Galazzo et al. (2002) were identical
or highly similar to sequences obtained from specimens collected in the present study
(Figure 2.4). One specimen had ITS sequences identical to a variant of D. huronense
described by Galazzo et al. (2002) and several specimens had ITS sequences identical or
similar to three specimens that could not be identified by those authors but which
resembled D. indistinctum (hereafter referred to as Diplostomum sp. 1) (Table 2.2, Figure
2.4). The ITS1 sequences of Diplostomum sp. 3 differ from those reported for
Diplostomum pseudospathaceum by Niewiadomska and Laskowski (2002) at two of 573
positions (one deletion and an A-T trans version). No other ITS sequences obtained in the
present study matched sequences in GenBank, and there appear to be misidentifications
35

in that database, particularly among records originating from European material (Figure
2.4).
Diplostomum sp. 1 was clearly distinguishable from D. indistinctum based upon
NJ analysis of COI (Figure 2.4a) but not of ITS (Figure 2.4b) sequences. One£>.
indistinctum specimen had ITS sequences identical to those in three specimens of
Diplostomum sp. 1 (see shaded rows in Table 2.2). Including gaps, there were 13 variable
sites in ITS sequences between these two species, but no variations were diagnostic. One
notable source of variation was a four-base indel (AAAC) in ITS1. In seven of nine
specimens examined in the present study, electropherogram traces at these positions had
secondary peaks in which deleted or inserted bases could be seen (Figure 2.5).
Downstream from these positions, the frame-shifted sequence was visible in secondary
peaks. In effect, this indel varied not just between but also within individuals in seven of
nine specimens. Two of the nine specimens showed no intra-individual variation. A
single D. indistinctum specimen showed only the deletion, while a single specimen of
Diplostomum sp. 1 showed only the insertion. It is possible these represent genotypes
native to the two parental species, and the double peaks (or polymorphism) shared by
other specimens in both species are a signature of hybridization. Double peaks indicative
of intra-individual variation were not observed at other variable positions in ITS traces of
the two species, but the overall lack of synapomorphy is also consistent with
hybridization between the two species (Table 2.2). Among the seven remaining
Diplostomum spp. from which ITS data were obtained, there were additional, species-
specific variations at the positions of this four-base indel, but only one case of
intraspecific variation, and no double peaks in electropherogram traces.
36
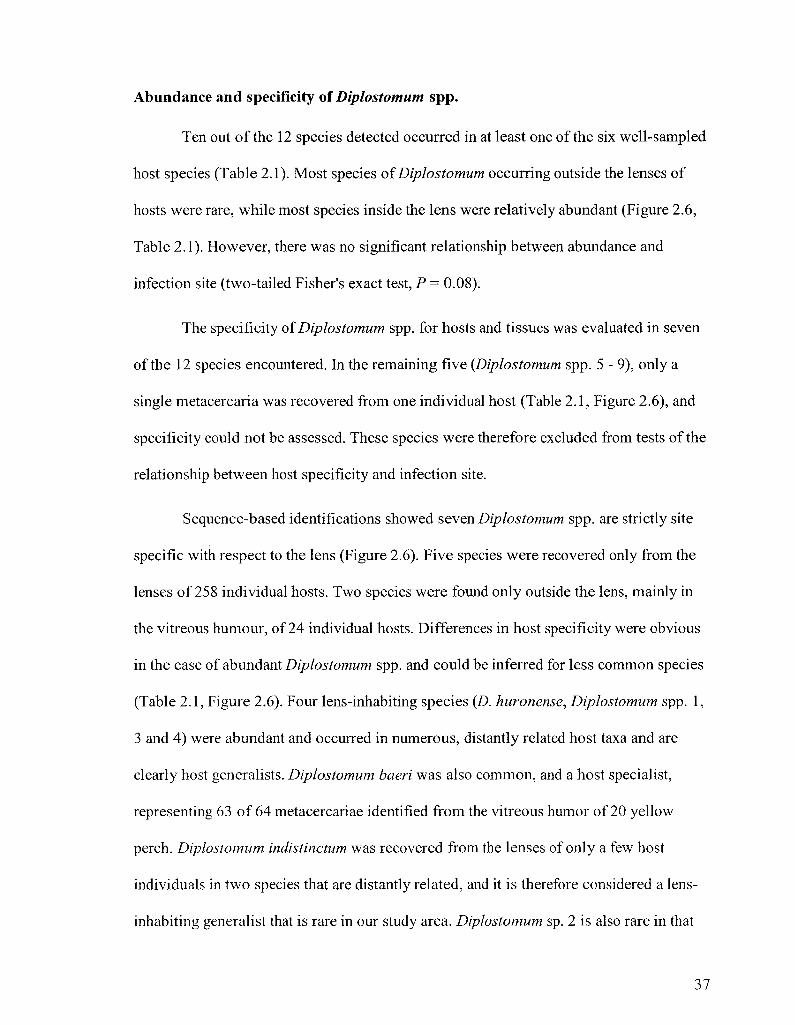
Abundance and specificity of Diplostomum spp.
Ten out of the 12 species detected occurred in at least one of the six well-sampled
host species (Table 2.1). Most species of Diplostomum occurring outside the lenses of
hosts were rare, while most species inside the lens were relatively abundant (Figure 2.6,
Table 2.1). However, there was no significant relationship between abundance and
infection site (two-tailed Fisher's exact test, P = 0.08).
The specificity of Diplostomum spp. for hosts and tissues was evaluated in seven
of the 12 species encountered. In the remaining five {Diplostomum spp. 5 - 9), only a
single metacercaria was recovered from one individual host (Table 2.1, Figure 2.6), and
specificity could not be assessed. These species were therefore excluded from tests of the
relationship between host specificity and infection site.
Sequence-based identifications showed seven Diplostomum spp. are strictly site
specific with respect to the lens (Figure 2.6). Five species were recovered only from the
lenses of 258 individual hosts. Two species were found only outside the lens, mainly in
the vitreous humour, of 24 individual hosts. Differences in host specificity were obvious
in the case of abundant Diplostomum spp. and could be inferred for less common species
(Table 2.1, Figure 2.6). Four lens-inhabiting species (D. huronense, Diplostomum spp. 1,
3 and 4) were abundant and occurred in numerous, distantly related host taxa and are
clearly host generalists. Diplostomum baeri was also common, and a host specialist,
representing 63 of 64 metacercariae identified from the vitreous humor of 20 yellow
perch. Diplostomum indistinctum was recovered from the lenses of only a few host
individuals in two species that are distantly related, and it is therefore considered a lens-
inhabiting generalist that is rare in our study area. Diplostomum sp. 2 is also rare in that
37
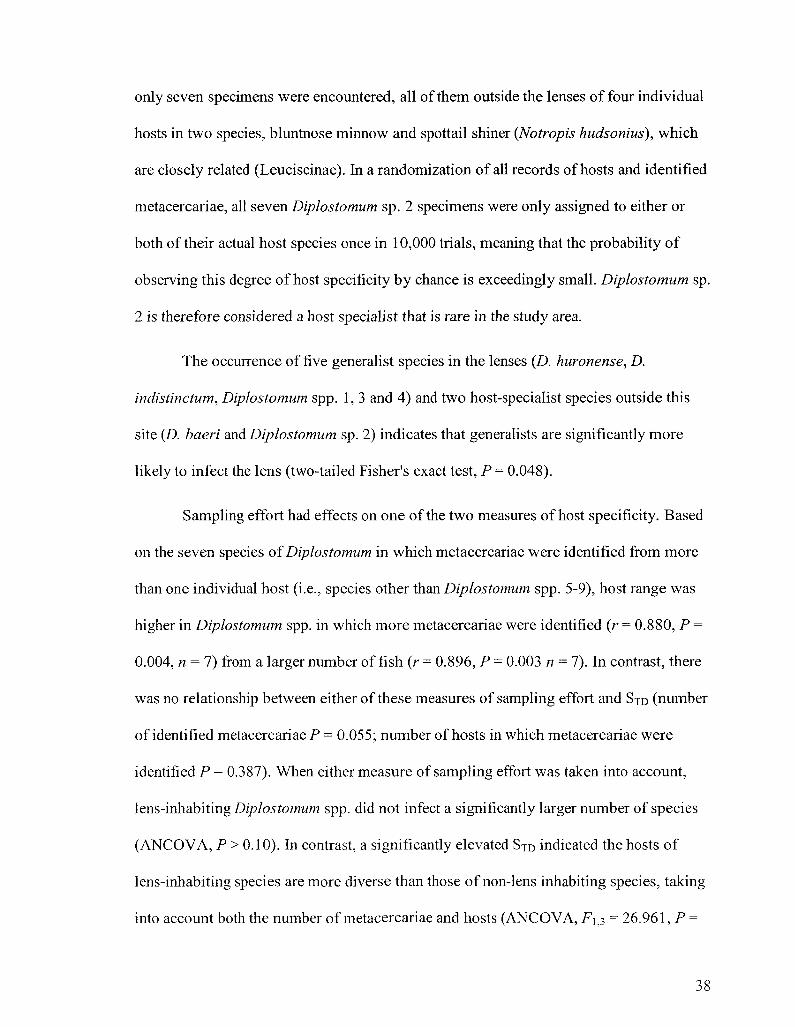
only seven specimens were encountered, all of them outside the lenses of four individual
hosts in two species, bluntnose minnow and spottail shiner (Notropis hudsonius), which
are closely related (Leuciscinae). In a randomization of all records of hosts and identified
metacercariae, all seven Diplostomum sp. 2 specimens were only assigned to either or
both of their actual host species once in 10,000 trials, meaning that the probability of
observing this degree of host specificity by chance is exceedingly small. Diplostomum sp.
2 is therefore considered a host specialist that is rare in the study area.
The occurrence of five generalist species in the lenses (D. huronense, D.
indistinctum, Diplostomum spp. 1, 3 and 4) and two host-specialist species outside this
site (D. baeri and Diplostomum sp. 2) indicates that generalists are significantly more
likely to infect the lens (two-tailed Fisher's exact test, P = 0.048).
Sampling effort had effects on one of the two measures of host specificity. Based
on the seven species of Diplostomum in which metacercariae were identified from more
than one individual host (i.e., species other than Diplostomum spp. 5-9), host range was
higher in Diplostomum spp. in which more metacercariae were identified (r = 0.880, P =
0.004, n = l) from a larger number of fish (r = 0.896, P = 0.003 n = 7). In contrast, there
was no relationship between either of these measures of sampling effort and STD (number
of identified metacercariae P = 0.055; number of hosts in which metacercariae were
identified P = 0.387). When either measure of sampling effort was taken into account,
lens-inhabiting Diplostomum spp. did not infect a significantly larger number of species
(ANCOVA, P > 0.10). In contrast, a significantly elevated STD indicated the hosts of
lens-inhabiting species are more diverse than those of non-lens inhabiting species, taking
into account both the number of metacercariae and hosts (ANCOVA, F ) j3 = 26.961, P =
38

0.014). In backward multiple regression, lens infection predicted STD after the two
measures of sampling effort were removed (lens infection coded as 0, non-lens coded as
1; p = -4.44, t5 = -5.989, P = 0.002) and accounted for 88% of the variance in STD CFi,s =
35.873, P= 0.002).
Phylogeography of Diplostomum spp.
A maximum parsimony (MP) analysis of ITS sequences from European and
North American Diplostomum spp. did not support an evolutionary history associated
with continental separation of the species (Figure 2.7). Two European species (D.
pseudospathaceiim and Diplostomum paracaiidum) were closely allied with seven North
American species, while two North American species fell within a clade composed of six
nominal European species.
Discussion
Twelve species of Diplostomum are clearly distinguished from each other by
barcode-region COI sequences. Notably, COI sequences resolve these sympatric
Diplostomum spp. more clearly than ITS sequences, which are more frequently used to
discriminate congeners in this and other trematode taxa (Nolan and Cribb 2005). The
relatively small number of ITS sequences compared (34) most likely explains why no
threshold in intraspecific variation is apparent (see Figure 2.3). However, the small
number of ITS sequences compared makes the near overlap in mean intraspecific
variation (as high as 0.29%) and mean interspecific variation (as low as 0.35%) all the
more striking. In contrast, in a sample of over 600 specimens, the maximum mean
39

intraspecific variation in COI sequences is an order of magnitude smaller than mean
interspecific variation, and appears to have reached a threshold (see Figure 2.3).
Rarefactions indicate samples of-20 individuals are adequate for characterizing
mean intraspecific variation in COI sequences in Diplostomum. Curiously, intraspecific
variation in COI sequences of D. baeri is not particularly elevated even though it is by far
the most abundant species in our samples, and might therefore be expected to have the
largest effective population size. This species is only found in yellow perch, however,
and this absolute host specificity may have a homogenizing effect on genetic variation by
funneling metacercariae into a smaller number of definitive hosts that specialize on this
fish as a prey item. Although lens-inhabiting species appear to be less abundant, they
occur in a wide variety offish taxa, and populations may be fragmented in different
definitive hosts foraging differentially on fish intermediate hosts. On the other hand, the
low sequence variation of D. baeri could also result from a recent increase in abundance,
such that variation has not had time to become fixed in the population.
Although one molecular marker outperforms the other, the use of multiple
markers and a large sample size provides stronger evidence on which to base taxonomic
conclusions. The status of the 12 species is well supported by COI and, in most cases,
rDNA sequences and host and/or tissue specificity. We avoided a potential source of
error by obtaining sequences of nDNA and mtDNA from the same individual specimens.
This lends confidence to the finding of unexpectedly similar or identical ITS sequences in
D. indistinctum and Diplostomum sp. 1, which have distinctive COI haplotypes. Two
processes could produce this lack of divergence in rDNA sequences. If the two species
recently diverged, mutations unique to each species are expected to become fixed sooner
40
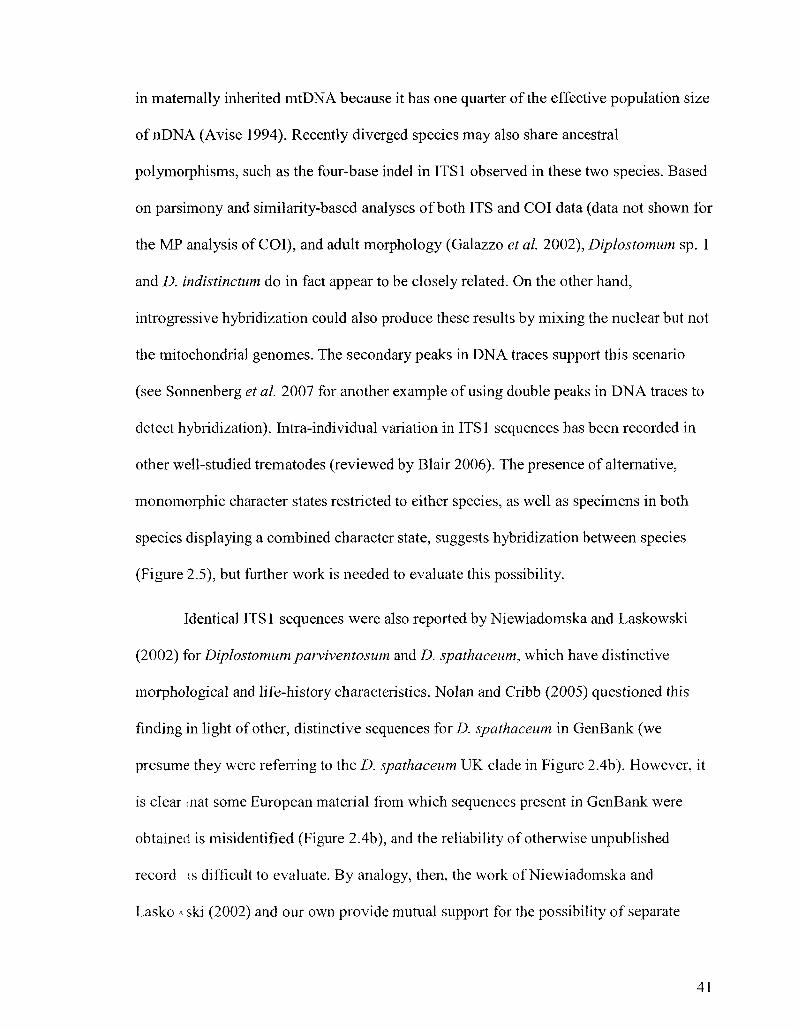
in maternally inherited mtDNA because it has one quarter of the effective population size
of nDNA (Avise 1994). Recently diverged species may also share ancestral
polymorphisms, such as the four-base indel in ITS1 observed in these two species. Based
on parsimony and similarity-based analyses of both ITS and COI data (data not shown for
the MP analysis of COI), and adult morphology (Galazzo et al. 2002), Diplostomum sp. 1
and D. indistinctum do in fact appear to be closely related. On the other hand,
introgressive hybridization could also produce these results by mixing the nuclear but not
the mitochondrial genomes. The secondary peaks in DNA traces support this scenario
(see Sonnenberg et al. 2007 for another example of using double peaks in DNA traces to
detect hybridization). Intra-individual variation in ITS1 sequences has been recorded in
other well-studied trematodes (reviewed by Blair 2006). The presence of alternative,
monomorphic character states restricted to either species, as well as specimens in both
species displaying a combined character state, suggests hybridization between species
(Figure 2.5), but further work is needed to evaluate this possibility.
Identical ITS1 sequences were also reported by Niewiadomska and Laskowski
(2002) for Diplostomum parviventosum and D. spathaceum, which have distinctive
morphological and life-history characteristics. Nolan and Cribb (2005) questioned this
finding in light of other, distinctive sequences for D. spathaceum in GenBank (we
presume they were referring to the D. spathaceum UK clade in Figure 2.4b). However, it
is clear <nat some European material from which sequences present in GenBank were
obtained is misidentified (Figure 2.4b), and the reliability of otherwise unpublished
record is difficult to evaluate. By analogy, then, the work of Niewiadomska and
Lasko * ski (2002) and our own provide mutual support for the possibility of separate
41
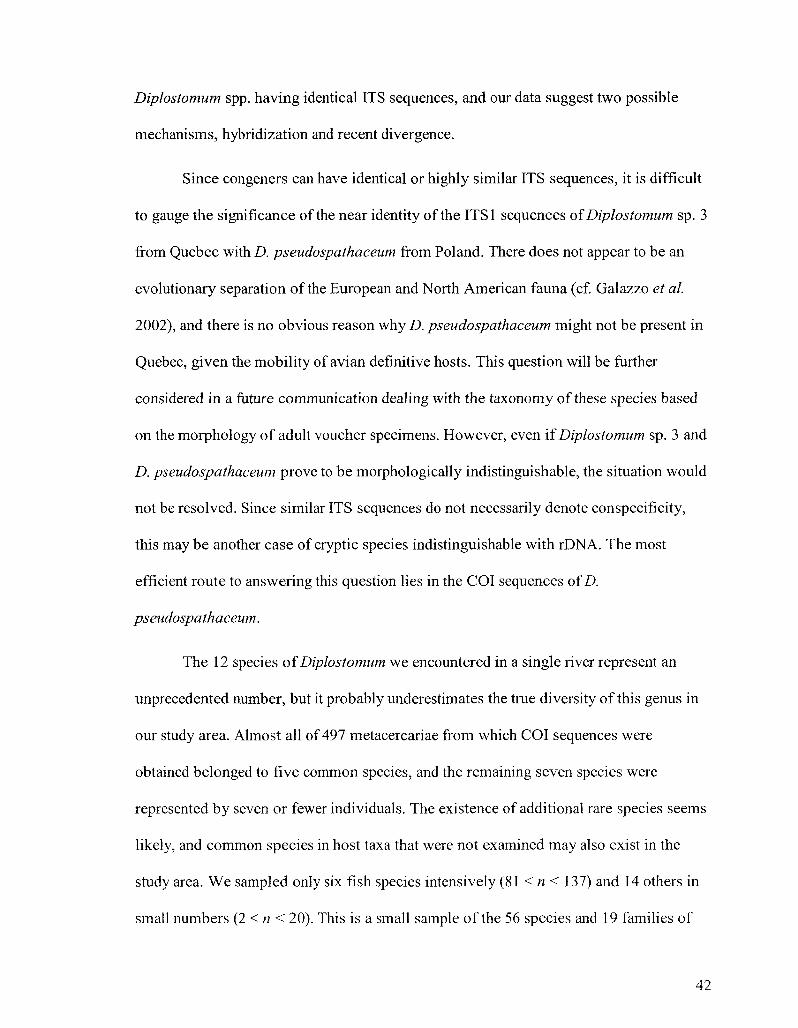
Diplostomum spp. having identical ITS sequences, and our data suggest two possible
mechanisms, hybridization and recent divergence.
Since congeners can have identical or highly similar ITS sequences, it is difficult
to gauge the significance of the near identity of the ITSl sequences ofDiplostomum sp. 3
from Quebec with D. pseudospathaceum from Poland. There does not appear to be an
evolutionary separation of the European and North American fauna (cf. Galazzo et al.
2002), and there is no obvious reason why D. pseudospathaceum might not be present in
Quebec, given the mobility of avian definitive hosts. This question will be further
considered in a future communication dealing with the taxonomy of these species based
on the morphology of adult voucher specimens. However, even if Diplostomum sp. 3 and
D. pseudospathaceum prove to be morphologically indistinguishable, the situation would
not be resolved. Since similar ITS sequences do not necessarily denote conspecificity,
this may be another case of cryptic species indistinguishable with rDNA. The most
efficient route to answering this question lies in the COI sequences of D.
pseudospathaceum.
The 12 species of Diplostomum we encountered in a single river represent an
unprecedented number, but it probably underestimates the true diversity of this genus in
our study area. Almost all of 497 metacercariae from which COI sequences were
obtained belonged to five common species, and the remaining seven species were
represented by seven or fewer individuals. The existence of additional rare species seems
likely, and common species in host taxa that were not examined may also exist in the
study area. We sampled only six fish species intensively (81 < n < 137) and 14 others in
small numbers (2 < n < 20). This is a small sample of the 56 species and 19 families of
42

fishes encountered in surveys of the same reach of this river between 1995 and 2005 (Y.
Reyjol, Ministere des Ressources Naturelles et de la Faune du Quebec, unpublished data),
particularly in light of the fact that Diplostomum has been reported from over 100 species
offish (Chappell 1995).
The data allow us to make predictions about Diplostomum spp. that we did not
encounter in the study area. The marginally significant tendency of lens-inhabiting
species to be abundant and of non-lens-inhabiting species to be rare, together with the
link between host-specificity and infection site, suggest that undetected species are
mostly specialists from non-lens tissues of hosts other than the six that were intensively
sampled. This prediction accords with the slower rate of discovery documented for host-
specific parasites of Canadian freshwater fishes (Poulin and Mouillot 2005b). The data
also suggest that unknown Diplostomum metacercariae collected from non-lens tissues of
distantly related host taxa are likely to be different species. In consequence, a promising
direction for future work in the study area would be to target eight additional fish species
in which Diplostomum metacercariae have been reported from the vitreous humour
(Marcogliese and Compagna 1999; Marcogliese et al. 2001a, b).
Although an incomplete census, the 12 Diplostomum spp. detected represent
surprising diversity for a 150-km reach of a single river. Using traditional approaches,
between five and seven species of Diplostomum have been recognized in all of Canada's
approximately 200 species offish (Margolis and Arthur, 1979; McDonald and Margolis
1995; Gibson 1996). Furthermore, estimates of global diversity of the genus ranging from
27 (Chappell et al. 1994) to 40 species (Niewiadomska 1996) appear low in light of our
43

data. Ignoring nomenclature, close inspection of Figure 2.4 shows a comparable number
of species-clades (~25) in samples from the United Kingdom, Poland and Quebec.
Our results shed light on previous studies in the St. Lawrence River. The D.
indistinctum-\ike group encountered by Galazzo et al. (2002) has been shown to be a
distinct, cryptic species (Diplostomum sp. 1). We identified Diplostomum spp. in all fish
hosts studied by Marcogliese et al. (2001a, b) except walleye {Sander vitreum). We have
made preliminary examinations of adult voucher specimens of the common species in our
system, and based on the difficulty of distinguishing adult voucher specimens from
morphology alone (data not shown) and the relative abundance of species in our survey
(data not shown), it is likely that what was reported by Marcogliese et al. (2001a, b) as D.
indistinctum was actually Diplostomum sp. 1, and that D. huronense was Diplostomum
sp. 4.
Overall, we found lower host specificity among Diplostomum spp. That, as
metacercariae, infect the lens, a non-vascularized compartment in which immune activity
is actively limited in vertebrates (Stein-Streilein and Streilein 2002; Sitja-Bobadilla
2008). When sampling effort was taken into account, lens-inhabiting diplostomids were
found to infect an array of host species that is more diverse but not significantly more
species rich. However, host range is relatively sensitive to sampling effort (Poulin and
Mouillot 2003) and, as illustrated by Diplostomum sp. 2 and D. indistinctum, it may not
be a good indicator of host specificity in rarer species of parasites.
Immunological privilege is thought to have evolved in certain tissues to prevent
the severe pathological changes that can be caused by immune reactions such as
inflammation in these sites (Stein-Streilein and Streilein 2002). All tissues colonized by
44

diplostomids are immunologically privileged, which may explain why diplostomid
metacercariae do not form protective cysts, unlike most strigeid metacercariae. It is
unlikely that parasites in these tissues are "hidden" from the host; rather, the immune
response is subject to active, localized restraint (Stein-Streilein and Streilein 2002).
However, the lens capsule forms an additional, physical barrier for cell-mediated immune
responses (Shariff et al. 1980), which are important in defenses against larval helminths
(Meeusen and Balic 2000; Kreider et al. 2007). Our results indicate that the
comparatively robust immune responses outside the lens may exert increased selective
pressure resulting in increased host specificity in non-lens Diplostomum spp. Among
lens-inhabiting species, lower host specificity augments available habitat and the number
of routes to definitive hosts. Immune activity in tissues other than the infection site is less
relevant here because Diplostomum spp. complete migration to eye tissues within 24 h of
penetrating a host, before a full, specific immune response is mounted (Chappell 1995;
Voutilainen and Taskinen 2009; but see Rauch et al. 2006).
There is some support for the effect of the lens on host specificity in the literature.
For example, Niewiadomska (1996) lists seven non-lens-inhabiting, host-specialist
Diplostomum spp., two lens-inhabiting host specialists, and three lens-inhabiting
generalists (nine additional species are unclassified). In itself, this points to a significant
association (Fisher's exact test, P= 0.045) and the validity of the two exceptional lens-
inhabiting host-specialist species is questionable (Niewiadomska 1996). However, as
Niewiadomska (1996) and others (Chappell et al. 1994; Chappell 1995) have cautioned,
the confused taxonomy of Diplostomum spp. makes it difficult to form an accurate
account of host-parasite relationships among metacercariae in this group. We believe this
45

is the first demonstration of a relationship between host specificity and immunologically
privileged sites in Diplostomum or, to our knowledge, in other parasites, but the idea is
not new. Lester and Huizinga (1977) suggested it to explain experimentally verified
specificity of Diplostomum adamsi from the retina of yellow perch, in light of the broad
host spectra reported in other species from the lens.
The difficulties of studying Diplostomum are not unique to this particular parasite.
There is growing recognition that the rigorous application of molecular techniques to
taxonomy is important for many aspects of parasitology (Criscione et al. 2005; Olson and
Tkach 2005; see also Bortolus 2008). Overall, our work reinforces other recent studies
(e.g., Vilas et al. 2005) showing COI sequences are more suitable for trematode species
discrimination than ITS markers. These results underscore the utility of using multiple
markers for studying Diplostomum spp. boundaries, as well as the desirability of
maintaining morphological voucher specimens (standard practice in DNA barcoding) and
the taxonomic uncertainty that continues to plague this genus.
46

Table 2.1 Diplostomum species in St. Lawrence River fishes
Basis of discrimination and/or identification of Diplostomum spp. collected from hosts in
the St. Lawrence River, Quebec, Canada, numbers of parasites from which COI
sequences were obtained, and numbers and species of intermediate hosts in which
metacercariae were identified
Species of Diplostomum
baeri
huronense
indistinctum
sp. 1
sp. 2
sp. 3
sp. 4
sp. 5
sp. 6
sp. 7
sp. 8
sp. 9
Basis of identif
ication or discrimination
1,3,5,6,7
1,2,4,5
l ,2 b ,3 ,4 ,5
l , 2 b , 4 , 5
1,2,5,6
1,2,5
1,2,5
1
1
1
1,2
1,2
n specimens sequenced
Adults
l l a
4
3a
93
0
8
16
0
0
0
0
0
(COI)
Metacercariae
64
19
3
173
7
19
209
n intermediate host individuals (intermediate host speciesd) infection
site
20 (1) Vitreous humour
15 (1-5) Lens
3 (5, 6) Lens
81 (1-5,7-18) Lens
4 (3, 7) Vitreous humour, brain
15(1-4,8,9, 19c)Lens
120(1-9, 11, 12, 14, 16, 20, 21) Lens
1(1) Vitreous humour
1 (3) Vitreous humour
1 (3) Vitreous humour
l(19)Eyec
1 (20) Vitreous humour
a three specimens from Galazzo et al. (2002) b equivocal resolution of internal transcribed spacer (ITS) sequences for D. indistinctum and Diplostomum sp. 1 c specific tissue of eye not determined in Rana pipiens d \=Perca flavescens, 2=Notemigonus aysoleucas, 3=Pimephales notatus, 4=Ambloplites rupestris, 5=Catostomus commersonii, 6=Apollonia melanostomus, l=Notropis
47

hudsonius, 8=Lepomis gibbosus, 9=Micropterus salmoides, lO=Micropterus dolomieui, W^Etheostoma nigrum, \2=Notropis spilopterus, \2>=Notropis atherinoides, \4=Moxostoma macrolepidotum, \5=Ictalurus nebulosus, \6=Labidesthes sicculus, \l=Fundulus diaphanus, \S=Pomoxis nigromaculatus, \9=Ranapipiens, 20=Percina caprodes, 2\=Carpiodes cyprinus Key to Basis of discrimination or identification: 1. Distinctive cytochrome c oxidase I (COI) sequence(s), Genbank accession: GQ292475-GQ292502; see also project DIPLO at www.barcodinglife.org 2. Distinctive ITS sequence(s), Genbank accession: GQ292503-GQ292523; see also project DIPLO at www.barcodinglife.org 3. COI sequence obtained from specimens studied by Galazzo et al. (2002) 4. ITS sequence match with sequence from Galazzo et al. (2002) 5. Site specificity 6. Host specificity 7. Adult morphology
48
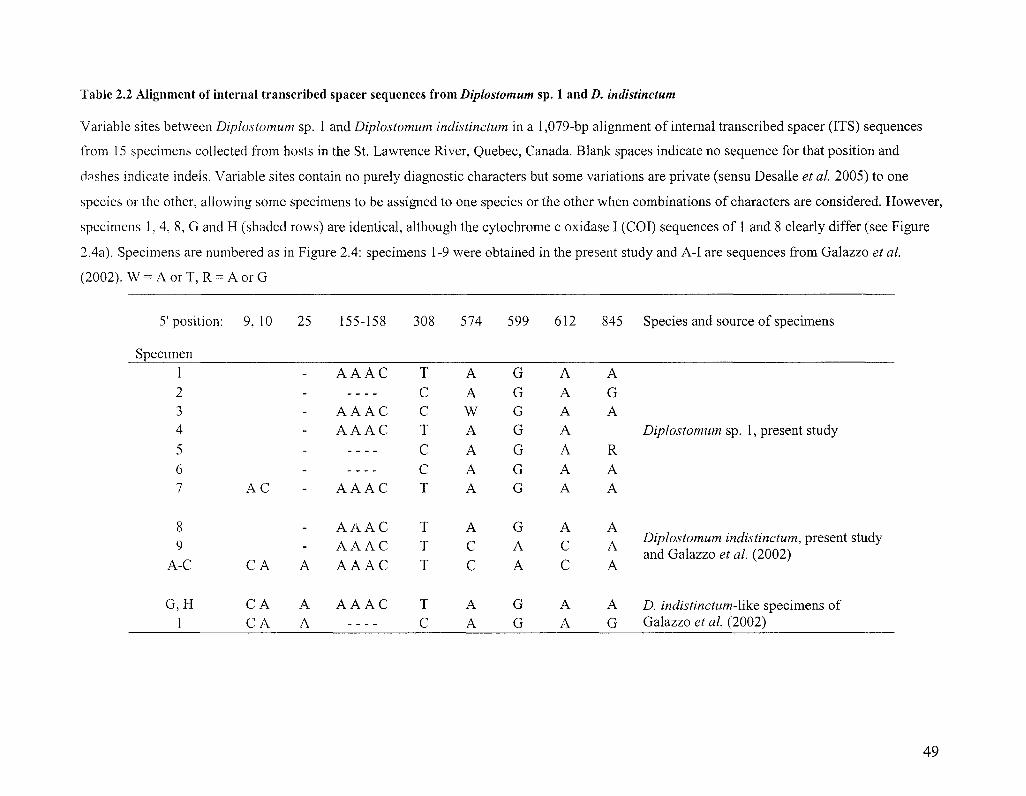
Table 2.2 Alignment of internal transcribed spacer sequences from Diplostomum sp. 1 and D. indistinctum
Variable sites between Diplostomum sp. 1 and Diplostomum indistinctum in a 1,079-bp alignment of internal transcribed spacer (ITS) sequences
from 15 specimens collected from hosts in the St. Lawrence River, Quebec, Canada. Blank spaces indicate no sequence for that position and
dashes indicate indels. Variable sites contain no purely diagnostic characters but some variations are private (sensu Desalle et al. 2005) to one
species or the other, allowing some specimens to be assigned to one species or the other when combinations of characters are considered. However,
specimens 1, 4, 8, G and H (shaded rows) are identical, although the cytochrome c oxidase I (COI) sequences of 1 and 8 clearly differ (see Figure
2.4a). Specimens are numbered as in Figure 2.4: specimens 1-9 were obtained in the present study and A-I are sequences from Galazzo et al.
(2002). W = A or T, R = A or G
5'position: 9, 10
Specimen
25 155-158 308 574 599 612 845 Species and source of specimens
2 3 4 5 6 7
9 A-C
G, H I
AC
CA
CA C A
-
-
-
-
-
-
-
.
-
A
A A
A A A C
A A A C A A A C
A A A C
A A A C A A A C A A A C
A A A C
T C C T C C T
T T T
T C
A A W A A A A
A C C
A A
G G G G G G G
G A A
G G
A A A A A A A
A C C
A A
A G A
R A A
A A A
A G
Diplostomum sp. 1, present study
Diplostomum indistinctum, present study and Galazzo et al. (2002)
D. indistinctum-like specimens of Galazzo et al. (2002)
49

\ c
£s 5_J> Diplostomum sp. 1
ex Larus marinus (1)
i ^
'}
Diplostomum sp. i n A/-r ex Larus argentatus (6)
1 f f V f r ^ /
I All 12 Diplostomum species ex numerous fishes and Larus delawarensis (~600)
/
Figure 2.1 Sampling localities
Sampling localities and species of Diplostomum detected, with the number of specimens
from which cytochrome c oxidase I sequences were obtained in parentheses. Most
specimens were metacercariae collected from fish in the St. Lawrence River near
Montreal, Quebec, Canada. Thus, the apparent differences in regional diversity are
attributable to vastly unequal sampling effort.
50
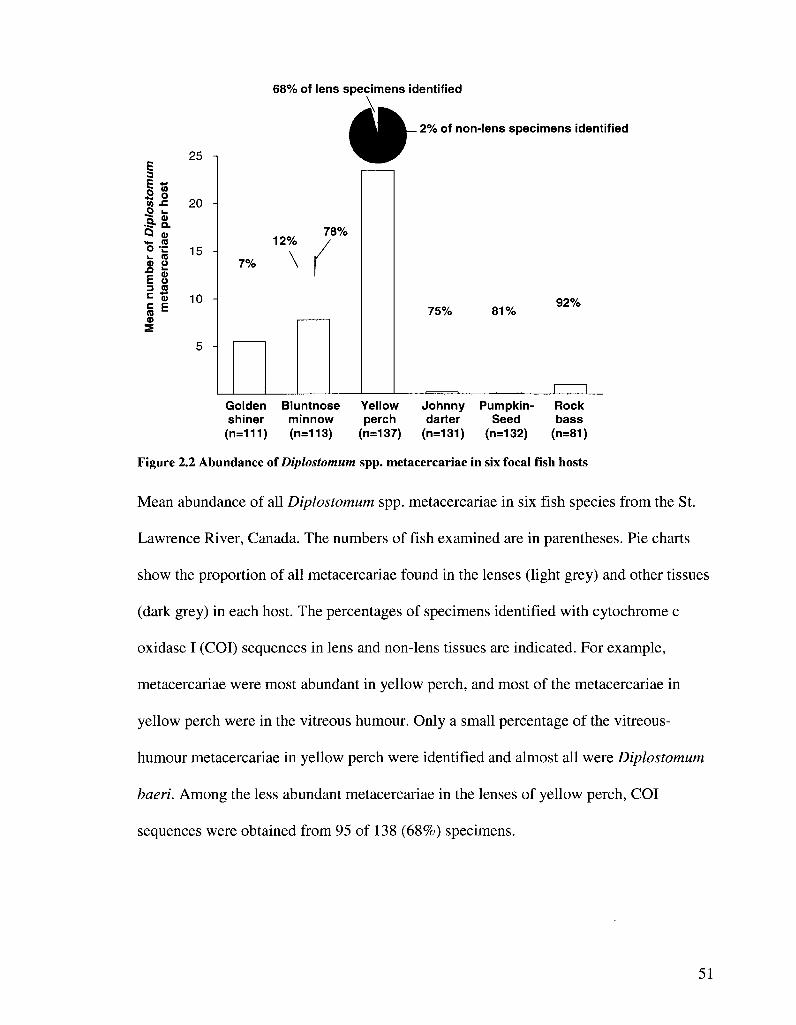
68% of lens specimens identified
25 E 3
S o 0» £ O l_
SSL Q a, H - (0 O Z i - re a> o E o 3 re = ? re«= a>
?o
1R
m
5 -
*
2% of non-lens specimens identified
12%
7% \
78%
75% 81% 92%
I 1 Golden Bluntnose Yellow Johnny Pumpkin- Rock shiner minnow perch darter Seed bass (n=111) (n=113) (n=137) (n=131) (n=132) (n=81)
Figure 2.2 Abundance of Diplostomum spp. metacercariae in six focal fish hosts
Mean abundance of all Diplostomum spp. metacercariae in six fish species from the St.
Lawrence River, Canada. The numbers of fish examined are in parentheses. Pie charts
show the proportion of all metacercariae found in the lenses (light grey) and other tissues
(dark grey) in each host. The percentages of specimens identified with cytochrome c
oxidase I (COI) sequences in lens and non-lens tissues are indicated. For example,
metacercariae were most abundant in yellow perch, and most of the metacercariae in
yellow perch were in the vitreous humour. Only a small percentage of the vitreous-
humour metacercariae in yellow perch were identified and almost all were Diplostomum
baeri. Among the less abundant metacercariae in the lenses of yellow perch, COI
sequences were obtained from 95 of 138 (68%) specimens.
51
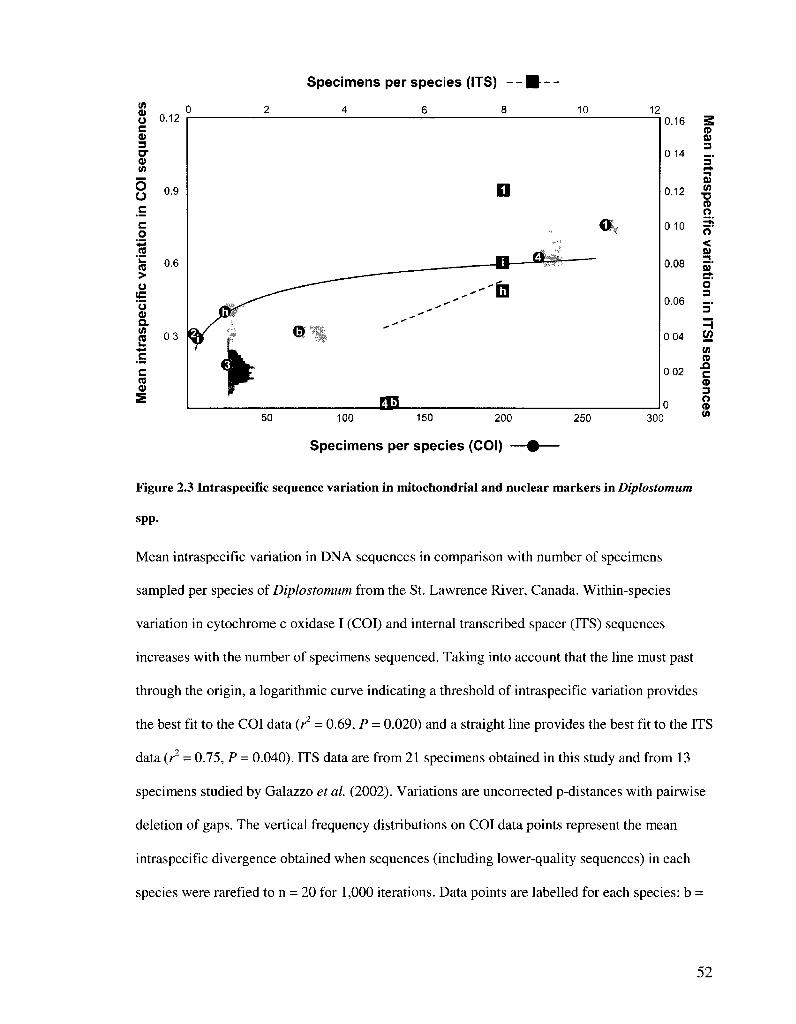
Specimens per species (ITS)
CD fl> 3
CD V)
T3 CD
g
o" < 0)
5" o'
W U) (D
.Q C CD 3 O (D (0 50 100 150 200
Specimens per species (COI)
Figure 2.3 Intraspecific sequence variation in mitochondrial and nuclear markers in Diplostomum
spp.
Mean intraspecific variation in DNA sequences in comparison with number of specimens
sampled per species of Diplostomum from the St. Lawrence River, Canada. Within-species
variation in cytochrome c oxidase I (COI) and internal transcribed spacer (ITS) sequences
increases with the number of specimens sequenced. Taking into account that the line must past
through the origin, a logarithmic curve indicating a threshold of intraspecific variation provides
the best fit to the COI data (r2 = 0.69, P = 0.020) and a straight line provides the best fit to the ITS
data (r2 = 0.75, P = 0.040). ITS data are from 21 specimens obtained in this study and from 13
specimens studied by Galazzo et al. (2002). Variations are uncorrected p-distances with pairwise
deletion of gaps. The vertical frequency distributions on COI data points represent the mean
intraspecific divergence obtained when sequences (including lower-quality sequences) in each
species were rarefied to n = 20 for 1,000 iterations. Data points are labelled for each species: b =
52

Diplostomum baeri, h = Diplostomum huronense, i = Diplostomum indistinctum, \=Diplostomum
sp. 1,2 = Diplostomum sp. 2, 3 = Diplostomum sp. 3, 4 = Diplostomum sp. 4
53
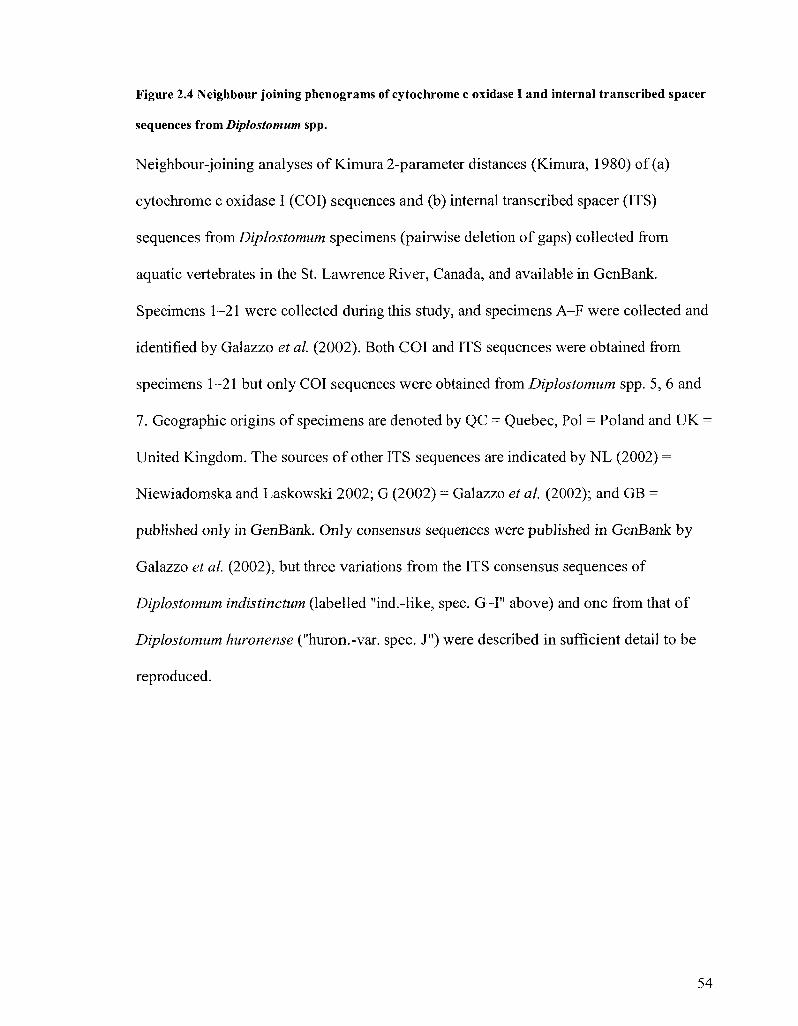
Figure 2.4 Neighbour joining phenograms of cytochrome c oxidase I and internal transcribed spacer
sequences from Diplostomum spp.
Neighbour-joining analyses of Kimura 2-parameter distances (Kimura, 1980) of (a)
cytochrome c oxidase I (COI) sequences and (b) internal transcribed spacer (ITS)
sequences from Diplostomum specimens (pairwise deletion of gaps) collected from
aquatic vertebrates in the St. Lawrence River, Canada, and available in GenBank.
Specimens 1-21 were collected during this study, and specimens A-F were collected and
identified by Galazzo et al. (2002). Both COI and ITS sequences were obtained from
specimens 1-21 but only COI sequences were obtained from Diplostomum spp. 5, 6 and
7. Geographic origins of specimens are denoted by QC = Quebec, Pol = Poland and UK =
United Kingdom. The sources of other ITS sequences are indicated by NL (2002) =
Niewiadomska and Laskowski 2002; G (2002) = Galazzo et al. (2002); and GB =
published only in GenBank. Only consensus sequences were published in GenBank by
Galazzo et al. (2002), but three variations from the ITS consensus sequences of
Diplostomum indistinctum (labelled "ind.-like, spec. G-I" above) and one from that of
Diplostomum huronense ("huron.-var. spec. J") were described in sufficient detail to be
reproduced.
54

2.4 (a) COI
0.005 H
Diplostomum sp 1 QC
D. Indistinctum QC
r Specimen 1 " Specimen 2 - Specimen 3 Specimen 4 Specimen 5 Specimen 6 Specimen 7
Specimen 8 Specimen 9 Specimen A Specimen B Specimen C
- Specimen 10 ] Diplostomum sp. 2 QC - Specimen 11] Diplostomum sp. 3 QC i Specimen 12' Specimen 13 Specimen 14 . Specimen 15 Specimen 16 Specimen 17 Specimen 18 Specimen 19
— Specimen 20] Diplostomum sp. 9 QC Specimen 21 ] Diplostomum sp. 8 QC — Diplostomum sp. 5 QC Diplostomum sp. 6 QC
Diplostomum sp. 7 QC Specimen D Specimen E Specimen F
D. huronense QC
Diplostomum sp. 4 QC
D. baeri QC
0.05
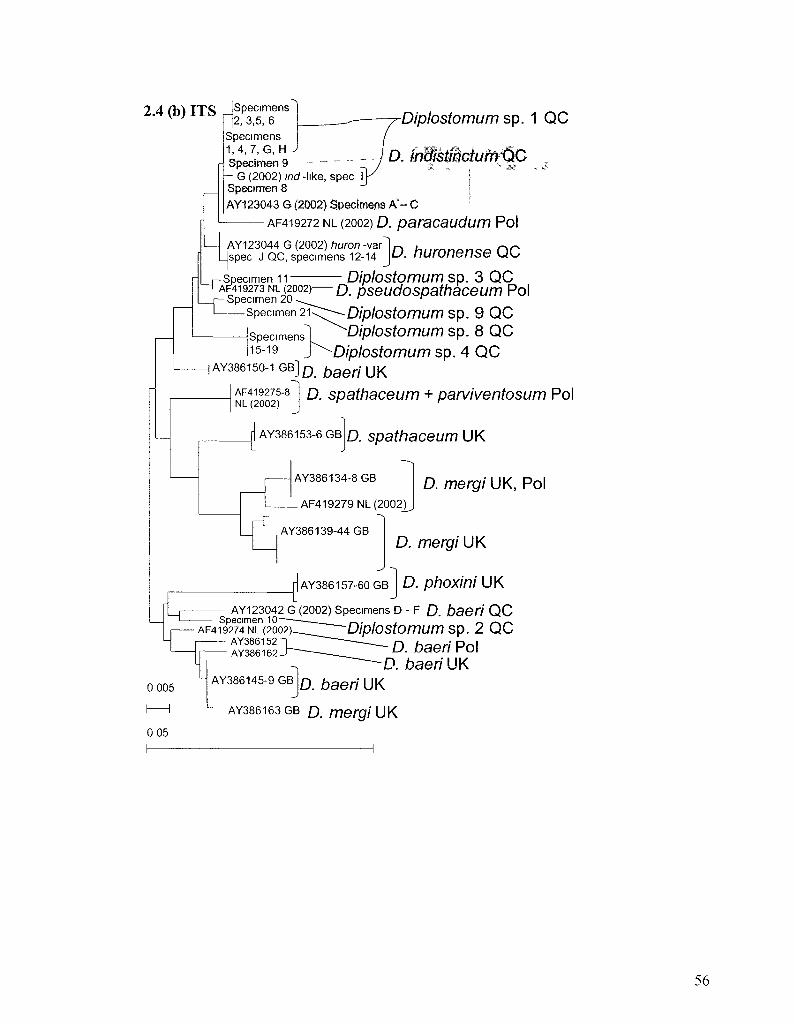
2.4 (b) ITS Diplostomum sp. 1 QC
0, iftWstfikiuMQC
Specimens 2, 3,5, 6
Specimens 1,4, 7, G, H Specimen 9
- G (2002) ind -like, spec Specimen S
AY123043 G (2002) Specimens A - C
AF419272 NL (2002) D. paracaudum Pol
AY123044 G (2002) huron -var Jspec J QC, specimens 12-14
-Specimen 11 AF419273 NL (2002)
r— Specimen 20 I Specimen 21
Specimens 15-19
D. huronense QC
- Diplostomum sp. 3 QC D. pseudospathaceum Pol
Diplostomum sp. 9 QC Diplostomum sp. 8 QC
-Diplostomum sp. 4 QC ] A Y 3 8 6 1 5 < M G B ] a j b a e A 7 - U K
AF419275-8 NL (2002)
D. spathaceum + parviventosum Pol
AY386153-6GB D. spathaceum UK
AY386134-8GB
_AF419279NL(2002)
D. mergi UK, Pol
AY386139-44 GB
AY386157-60 GB
D. mergi UK
D. phoxini UK
L
L - AY123042 G (2002) Specimens D - F £ baeri Q C Specimen 10 —__!-»• < * - i /-\/-^
AF419274NL(2002 )_^~~ -D /p /OS fom iVA77Sp . 2 Q C AY386152T ^ _ Q_ ^ ^ p Q |
0 005
AY386162-
AY386145-9 GB D. baeri UK
D. baeri UK
AY386163GB Q . m e f g / U K
0 05
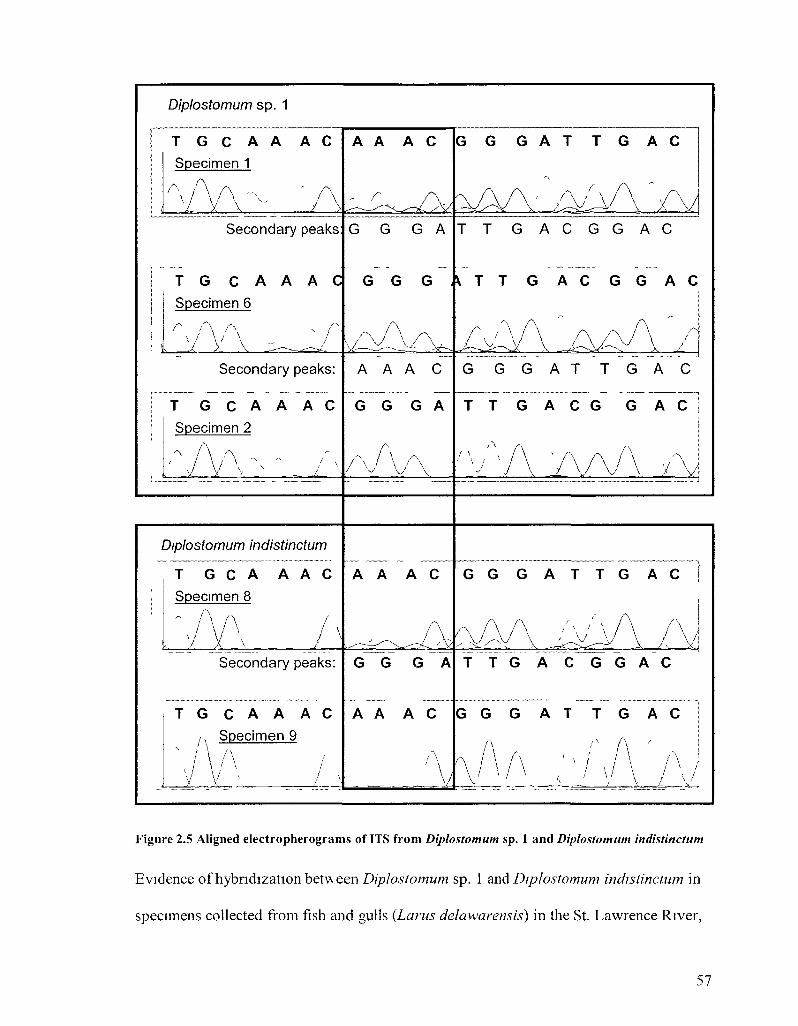
Diplostomum sp. 1
T G C A A A C Specimen 1
A
/ >,
Secondary peaks
T G C A A A C
Specimen 6
A \ / V
A / •
/
A A A C
G G G A
G G G A T T G A C G G A C
G G G A T T G A C
T T G A C G G A C
Secondary peaks:
T G C A A A C
Specimen 2
A A A C G G G A T T G A C
G G G A T T G A C G G A C
\ / \ /
Diplostomum indistinctum
T G C A A A C
Specimen 8
A A A C G G G A T T G A C
± >\f\ I \i A
Secondary peaks: G G G A T T G A C G G A C
T G C A A A C Specimen 9
A A -A A..
/
A A A C
A
G G G A T T G A C
Figure 2.5 Aligned electropherograms of ITS from Diplostomum sp. 1 and Diplostomum indistinctum
Evidence of hybndization between Diplostomum sp. 1 and Diplostomum indistinctum in
specimens collected from fish and gulls (Larus delawarensis) in the St. Lawrence River,
57

Canada. Forward-read electropherogram traces show a four-base indel in internal
transcribed spacer 1 (ITS1) sequences (AAAC/ ). Traces from specimen 2 ( )
and specimen 9 (AAAC) show different character states without secondary peaks, which
may represent the genotype native to each species. In other specimens, both character
states are visible (AAAC/ ), with the alternative state shown by frame-shifted
sequence in secondary peaks in DNA traces. Complete trace files from cytochrome c
oxidase I and ITS from additional specimens showing the same patterns are available in
project DIPLO at www.barcodinglife.org. Reverse traces are poorly defined in this region
but do not contradict the patterns seen here.
58
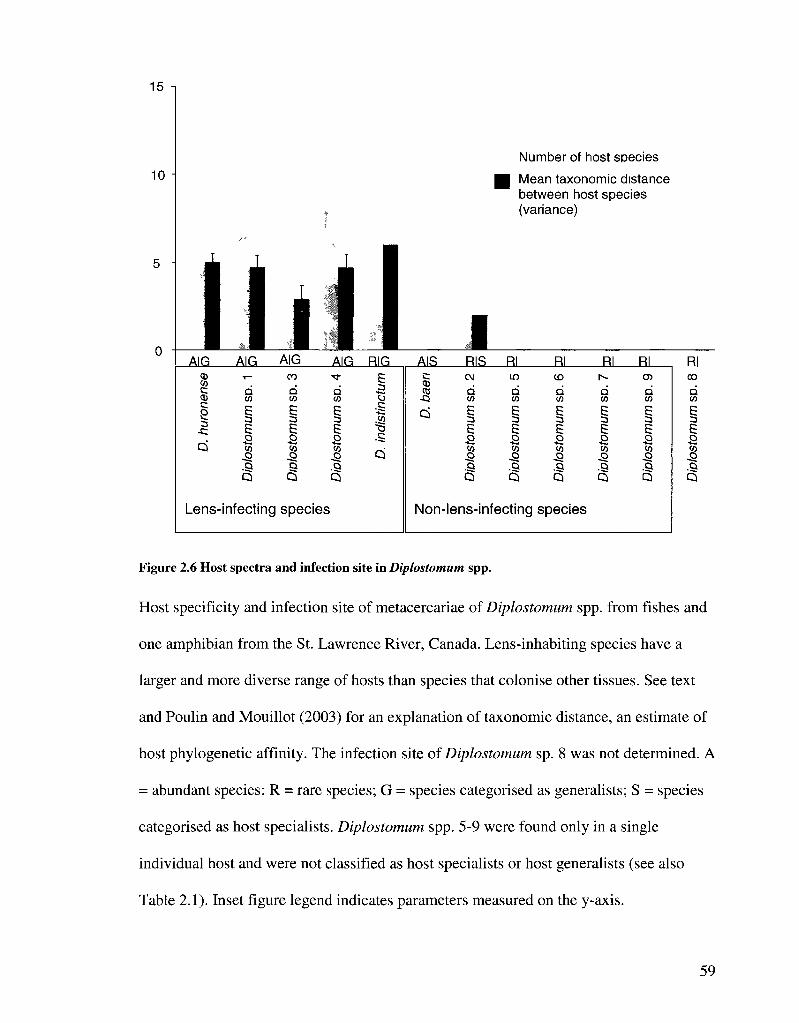
15
10
i
I AIG
03 CO c 03
c S 3
ci
Lens
• i
i _L _L
hi AIG AIG AIG
Dio
lost
omum
SD.
1
Dip
lost
omum
sp.
3
Dip
lost
omum
SP.
4
•infecting species
•
RIG E o .c •c .« -s .c Ci
AIS c 03 CO
- Q
Ci
Number of host species
0 Mean taxonomic distance between host species (variance)
1 RIS Rl Rl Rl Rl
Dip
lost
omum
so.
2
Dip
lost
omum
sp.
5
Dip
lost
omum
sp.
6
Dip
lost
omum
sp.
7
Dip
lost
omum
sp.
9
Non-lens-infecting species
Rl CO
d CO
3
E CO
.o
.9 Q
Figure 2.6 Host spectra and infection site in Diplostomum spp.
Host specificity and infection site of metacercariae of Diplostomum spp. from fishes and
one amphibian from the St. Lawrence River, Canada. Lens-inhabiting species have a
larger and more diverse range of hosts than species that colonise other tissues. See text
and Poulin and Mouillot (2003) for an explanation of taxonomic distance, an estimate of
host phylogenetic affinity. The infection site of Diplostomum sp. 8 was not determined. A
= abundant species; R = rare species; G = species categorised as generalists; S = species
categorised as host specialists. Diplostomum spp. 5-9 were found only in a single
individual host and were not classified as host specialists or host generalists (see also
Table 2.1). Inset figure legend indicates parameters measured on the y-axis.
59
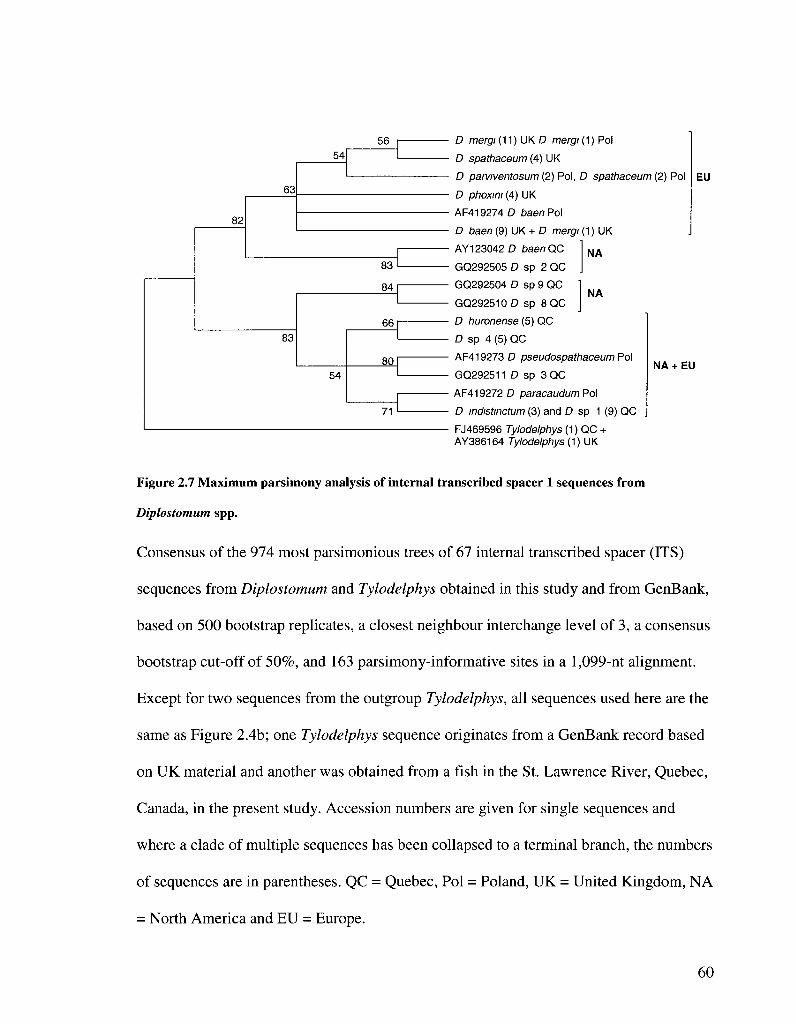
82
63
83
54 56
54
83
84
66
80
71
D mergi (11) UK D mergi (1) Pol
D spathaceum (4) UK
D parviventosum (2) Pol, D spathaceum (2) Pol
D phoxmi (4) UK
AF419274D baen Pol
D baen (9) UK + D mergi (1) UK
EU
NA
NA
NA + EU
AY 123042 D baen QC
GQ292505 D sp 2 QC
GQ292504 D sp 9 QC
GQ29251O0 sp 8 QC
D huronense (5) QC
D sp 4 (5) QC
AF419273 D pseudospathaceum Pol
GQ292511 D sp 3 QC
AF419272 D paracaudum Pol
D mdistinctum (3) and D sp 1 (9) QC
FJ469596 Tylodelphys (1) QC + AY386164 Tylodelphys (1) UK
Figure 2.7 Maximum parsimony analysis of internal transcribed spacer 1 sequences from
Diplostomum spp.
Consensus of the 974 most parsimonious trees of 67 internal transcribed spacer (ITS)
sequences from Diplostomum and Tylodelphys obtained in this study and from GenBank,
based on 500 bootstrap replicates, a closest neighbour interchange level of 3, a consensus
bootstrap cut-off of 50%, and 163 parsimony-informative sites in a 1,099-nt alignment.
Except for two sequences from the outgroup Tylodelphys, all sequences used here are the
same as Figure 2.4b; one Tylodelphys sequence originates from a GenBank record based
on UK material and another was obtained from a fish in the St. Lawrence River, Quebec,
Canada, in the present study. Accession numbers are given for single sequences and
where a clade of multiple sequences has been collapsed to a terminal branch, the numbers
of sequences are in parentheses. QC = Quebec, Pol = Poland, UK = United Kingdom, NA
= North America and EU = Europe.
60

Chapter 3 DNA barcodes reveal cryptic diversity and host specificity among strigeid (Platyhelminthes: Trematoda) parasites of freshwater fishes in the St. Lawrence River, Canada
Introduction
The diversity and ecology of many groups of macroparasites is poorly known
(Poulin and Morand 2004; Poulin 2007b). Most parasites have been recorded from only a
small number of host taxa, but host specificity is often difficult to evaluate (Poulin
2007b). Further complicating matters, many parasites show varying host specificity at
different stages of their life cycles.
Strigeid trematodes (Platyhelminthes) are endoparasites with complex life cycles
(Figure 3.1). The larval stage that occurs in fish, the metacercaria, causes pathology in
populations of natural and farmed fish in freshwater systems around the world (Szidat
1969; Lemly and Esch 1984; Chappell 1995; Sandland and Goater 2001; Overstreet and
Curran 2004). Metacercariae cannot be identified to species based on morphology, which
has caused them to be treated as a relatively small number of species that occur in a wide
assortment of fishes (Gibson 1996; Hoffman 1999). Little is known of the species-level
diversity of larval strigeids and the relationships between metacercariae and their hosts
are poorly defined (Chappell 1995; Gibson 1996; Poulin 2007b).
Previous surveys indicate that larval strigeids dominate the metazoan parasite
fauna of forage fishes in the St. Lawrence River, although only one fish species has been
studied in detail (Marcogliese et al. 2006). However, such surveys provide no
information on the diversity or host specificity of strigeid metacercariae at the species
61
level. Molecular data offer a solution to these problems and constitute the only practical
means of obtaining species-level resolution in a field survey of metacercariae. Results
from an earlier study of internal transcribed spacer sequences (ITS) of Diplostomum from
the St. Lawrence River led us to suspect that additional molecular sampling might
uncover a small increase in local strigeid species diversity (Galazzo et al. 2002). In
comparable studies, sequence data have often revealed an apparently generalist parasite
to be a complex of cryptic and, in many cases, host-specific species (e.g., Jousson et al.
2000; Miura et al. 2005, 2006; Steinauer et al. 2007). However, this trend has not
emerged in molecular studies of strigeids (Table 3.1).
Most studies using molecular markers to distinguish trematode species have
employed sequences of ribosomal genes and of a ~350-bp fragment of cytochrome
oxidase 1 (COl) beginning about 800 bp from the 5' end of that gene (Nolan and Cribb
2005, Olson and Tkach 2005). The first -650 bp of COl, the DNA barcode, have been
used to distinguish sibling species in numerous other groups (Hebert et al. 2003a, b;
Frezal and Leblois 2008), including some parasitic helminths (Hansen et al. 2007;
Elsasser et al. 2009; Ferri et al. 2009), but very few trematodes (Zarowiecki et al. 2007,
Locke et al. 2009). This study employed DNA barcodes to survey the diversity and host
specificity of larval strigeid species in fish in the St. Lawrence River, Canada.
Surveys generally provide no evidence as to whether host specificity arises from
physiological incompatibility between parasites and hosts or from parasites being
ecologically separated from hosts, what Combes (2001) called the compatibility and
encounter filters to infection. In this study, several lines of evidence were used to not
only detect host specificity, but to obtain evidence relating to its cause. Firstly, spatial
62
replicates of multiple host species in separate communities were sampled in ecologically
distinctive localities. Fish host species often encounter different parasite species in
different habitats, including parasites that circulate through other fish species (Leong and
Holmes 1981; Bergeron et al. 1997). Consistent patterns of host specificity across the fish
communities surveyed in the present study would therefore support compatibility-related
mechanisms, while inconsistency would suggest that local ecological availability is more
relevant. Secondly, we sampled a large number of host species, including hosts that were
ecologically distinctive but closely related, and distantly related but ecologically
convergent. If parasite species are distributed in ways that reflect ecological rather than
phylogenetic host attributes, this would support the operation of the encounter filter (the
availability of hosts to parasites), while the opposite pattern would indicate physiological
compatibility to be more important. Thirdly, we looked for evidence suggesting that a
physiological mechanism, the host immune response, affects patterns of host specificity
in strigeid metacercariae. The immune response varies in different tissues in fishes (Sitja-
Bobadilla 2008). Lester and Huizinga (1977) suggested that in at least one group of
strigeid fish parasites, species inhabiting an immunologically privileged site may have
access to more host taxa than species inhabiting other tissues. If this pattern is observed
among strigeid species in general, this would suggest a physiological basis for host
specificity in metacercariae.
63

Materials and methods
Specimen collection
As stated in the Materials and Methods of Chapter 2, most specimens were
metacercariae taken from fishes caught with a beach seine at six ecologically distinctive
sampling localities in the St. Lawrence River near Montreal, Canada during a three-week
period in June and July of 2006 (Figure 3.2). Six host species were sampled intensively,
with a total of 705 fish examined (Table 3.2). These fish species were selected based on
their availability throughout the system and represent the species that were most
consistently abundant across localities. Only 1+ year-class, or the smallest sized fish
available, were collected. By simultaneously collecting only young fish at replicate
localities, we ensured that fish were likely to be local to each locality (not migrants) and
had been exposed to the same pool of local parasites for the approximately same amount
of time and during the same period. Metacercariae were also taken from 14 other species
offish (n - 114) and one amphibian species (n = 11). Most of these hosts were also in the
1+ age-class and were collected at the same time from the aforementioned localities. In
addition, metacercariae were collected from older individuals collected on other
occasions from these and additional localities in the St. Lawrence River and from
elsewhere, including localities > 1000 km from the main study area in the St. Lawrence
River. Fish were killed in an overdose of clove oil/ethanol solution (50mg/10ml/L) and
frozen until dissection for parasites using standard techniques (Marcogliese 2002;
www.eman-rese.ca/eman/ecotools/protocols/freshwater/parasites). Upon removal from
the host, metacercariae were fixed in 95% or absolute ethanol for molecular work.
64

Adult strigeid specimens were also obtained by feeding fish to experimental hosts
and from piscivorous birds contributed by colleagues. They will eventually be used for
morphological identifications, but that aspect of our research is beyond the scope of this
communication. However, nucleotide sequences from adult specimens are included here
in calculations of sequence variation.
Molecular data acquisition and analysis
Amplification and sequencing of COl were performed using the primers and PCR
protocols of Moszczynska et al. (2009) at the Canadian Centre for DNA Barcoding
(CCDB) in Guelph, Ontario. The ITS region from the same individual specimens was
also amplified and sequenced in some specimens at the CCDB following protocols and
using the primers described by Galazzo et al. (2002) and Moszczynska et al. (2009). It is
emphasized that sequences of both COl and ITS were obtained from the same individual
specimens. Except for five samples in which a small number (< 5) of specimens were
pooled, all DNA extractions were of single specimens.
Our aim was to obtain COl sequences from as many specimens as possible, and
as a result every attempt was made to use salvageable regions of even lower quality DNA
traces. Base-calling was conducted in isolation, without reference to other sequence data.
In most cases, forward and reverse DNA traces were easily aligned and required minimal
or no editing. In a small number of cases, substantial base calling was required, and
occasionally bases were called before trace files could be aligned to generate bi
directional sequence. In other cases, particularly among the Crassiphialinae, sequences
were obtained from single forward or reverse traces, or from traces that aligned on either
65
side of a problematic poly-T region described in the results. Sequences were manually
edited using Contig Express (Invitrogen, Carlsbad, CA, USA), Geneious (Biomatters,
Auckland, NZ) and Sequencher 4.8 (2008, Gene Codes, Ann Arbor MI USA). Barcode
COl nucleotide sequences were aligned using ClustalX (Thompson et al. 1994) and
subsequent analyses were conducted using Mega 4.0 (Tamura et al. 2007). Herein we
present only 150 COl sequences, including representatives from each of the species
detected as well as ITS sequences from the same specimens. The remaining sequences
will be published in a future study dealing with the population genetics of the strigeids.
Both COl and ITS sequences and original DNA trace files are available in projects
PRIME, DIPLO and TREMA on www.barcodinglife.org, along with georeference, host
and image data for each specimen.
Species delineation and identification
Metacercariae were identified to genus based on morphology, infection site and
host species using the keys of Gibson (1996), Hoffman (1999) and Niewiadomska
(2002). Potential species were initially distinguished by clustering in neighbour-joining
(NJ) analyses of Kimura 2-parameter distances between COl sequences. Because
barcode sequences are known from only a few strigeid species (Diplostomum baeri, D.
huronense and D. indistinctum, see Locke et al. 2009), the NJ analysis of barcode
sequences amounted to species delineation, rather than species identification. This use of
barcode sequences is contentious (Desalle et al. 2005; Hickerson et al. 2006) and
additional evidence of species boundaries was therefore sought. Sequence clusters
indicating metacercarial specificity for hosts or tissues were considered strong,
independent evidence of species boundaries. COl sequences were also analyzed using a
66
character-based method (maximum parsimony), which has been suggested to be
preferable to distance-based NJ analysis for detecting species boundaries (see Desalle et
al. 2005). In addition, ITS sequences obtained from a subsample of specimens were
analyzed in NJ trees to see whether divergence supported CO 1-delineated clusters.
Representatives of ITS and COl sequences from all clusters were submitted to BLAST
searches in GenBank, with the aim of matching strigeid species sequenced in other
studies. Finally, in a few cases, metacercariae (or adults obtained from experimental
infections and/or wild-caught piscivorous birds) showed distinctive morphological
features which contributed to species delineation. However, because metacercariae were
frozen, detailed morphological examination was not practical. Most metacercariae were
too small for subsampling, and no tissue remained for microscopic study after extraction
ofDNA.
Effect of infection site on host specificity
We compared the host specificity of species of metacercariae inhabiting the lens
of the eye with that of species in other tissues, taking steps to remove confounding
influences. The lens is one of several immunologically privileged tissues in vertebrates
(Stein-Streilein and Streilein 2002; Sitja-Bobadilla 2008). The membrane encapsulating
the lens appears to afford metacercariae a layer of protection from cell-mediated immune
responses (Shariff et al. 1980) that are particularly important in fighting helminth
infection (Kreider et al. 2007). A variety of approaches were used to determine whether
metacercariae in this site were less host specific, that in turn required host specificity to
be quantified.
67
Several indices of host specificity were used in order to avoid the bias of any
single indicator. The simplest and most widely reported measure of host specificity is
host range, i.e., the number of species infected by a parasite. Although convenient, host
range provides no information on the phylogenetic relationships among host species. For
example, Diplostomum sp. 2, which occurs in two species in the same subfamily, has a
host range equivalent to Diplostomum indistinctum, found in members of two superorders
(see Results, this chapter). Host phylogeny is relevant because physiological and
immunological obstacles for parasites are likely to differ more as the phylogenetic
distance between host taxa increases. For example, the histological distribution of
eosinophilic immune cells shows distinctive patterns in teleost genera and families (Reite
and Evenson 2006).
We therefore also measured the phylogenetic diversity of host spectra using the
taxonomic distance indices of Poulin and Mouillot (2003, 2005a). These are based on the
number of steps to a common node in a taxonomic tree, using the classifications of genus,
subfamily, family, order, and superorder in Nelson (2006) (see inset to Figure 4.5). For
example, a bluntnose minnow (Pimephales notatus, Pimephales, Leuciscinae,
Cyprinidae, Cypriniformes, Ostariophysii, Actinopterygii) is six units from a yellow
perch {Perca flavescens, Perca, Percidae, Perciformes, Acanthopterygii, Actinopterygii)
and two units from golden shiner {Notemigonus crysoleucas, Notemigonus, Leuciscinae).
Specificity expressed as the mean taxonomic distance between all host species infected
by a parasite (STD) is an index based solely on the phylogenetic diversity of hosts that
varies relatively little with sample size (Poulin and Mouillot 2003). The associated
variance (VarSTo) reflects the heterogeneity of phylogenetic relationships in the host
68

assemblage. In addition, we calculated STD*, which weights STD with differences in
prevalence in each host species (Poulin and Mouillot 2005a).
Several analytical techniques were used to test whether lens-inhabiting strigeids
differed in host specificity from non-lens species. In each approach, we attempted to
control for confounding factors. For example, a rare parasite species will tend to appear
host specific because it will occur in fewer individual hosts, which are less likely to
represent all host taxa the parasite is capable of colonizing. More abundant parasite
species occur in more individual hosts and tend to saturate the range of compatible host
taxa (see Poulin and Mouillot 2005b). These expectations raise concerns both from the
point of view of species abundance and sampling effort. In addition, since generalist
species in the lens were members of a single genus, Diplostomum, another set of analyses
was conducted to remove phylogenetic influences, i.e., to ensure low host specificity in
the lens was not just a Diplostomum effect.
Firstly, analyses of covariance (ANCOVAs) were conducted to determine
whether lens-infection affected host specificity as measured by the indices described
above. Covariates included the number of metacercariae sequenced, and the number of
hosts from which sequenced metacercariae were obtained.
Secondly, the effect of the lens on host specificity was tested using multiple
regression of phylogenetically independent contrasts calculated with the PDAP module of
Mesquite 2.6 (Midford et al. 2009; www.mesquiteproject.org). Contrasts were obtained
from aphylogeny generated from MP analysis of COl DNA sequences rooted with
Clinostomum sp. Nine equally parsimonious trees all placed species of Ichthyocotylurus
(Strigeinae) in a clade with diplostominids, rather than with Tetracoty/e (Strigeinae)
69

(Figure 3.9). This is unlikely to represent the true phylogeny, according to both taxonomy
and cladistic analysis of morphological and life-history characteristics of the adult and
metacercarial stages (Shoop 1989; Niewiadomska 2002). This was not surprising,
however, because barcode region sequences of COl are too short and rapidly evolving
for reliable reconstruction of deeper phylogenetic relationships (Hajibabaei et al. 2006;
Waugh 2007). Consequently, phylogenetically independent contrasts were obtained using
both from two phylogenies: the observed COl MP phylogeny and one in which
Ichthyocotylurus species were manually placed at the base of an all-strigeinid clade. The
significance and explanatory power obtained using both phylogenies were similar.
Multiple regressions of phylogenetically independent contrasts were conducted to
assess how lens-infection affects host-specificity indices, while accounting for sampling
effort and species abundance. The independent variable (lens/non-lens) is binary but
represents a quantitative difference in immunological activity levels. Lens-infecting
metacercariae were coded as 0, denoting residence in a low-immune-activity site, and
non-lens metacercariae were coded as 1, representing sites with higher immune activity.
Also available for use in the models were the two aforementioned measures sampling
effort (N metacercariae sequenced, N hosts from which sequenced metacercariae
obtained). However, this resulted in three independent variables to be tested with 36 data
points each representing contrasts in host specificity. Because both estimates of sampling
effort were strongly correlated (R = 0.983, n = 36, P < 0.0005), and to avoid overfitting
the models, multiple regression was limited to lens-infection and a single measure of
sampling effort selected based on collinearity tolerance.
70

Thirdly, the relationship between the low-immune infection site and host
specificity was also tested using Pagel's (1994) test of correlated evolution between
discrete characters, using Mesquite (Midford et al. 2002. PDAP:PDTREE package for
Mesquite, version 1.00, www.mesquiteproject.org). Parasite taxa were classified as lens
or non-lens inhabitants, and as host generalists or specialists based on a qualitative
assessment of host range, SJD, VarSjD, and STD*-
Finally, in strigeids classified as host specific, Fisher's exact tests were conducted
to independently assess the probability of the observed host specificity arising by chance.
Results
Delineation of species
Both COl and ITS sequences indicated the presence of a large number of strigeid
species, many of which were supported by host- and tissue-specific distribution that was
consistent across localities. Clustering of COl sequences indicated that at least 49
strigeid species occur as metacercariae in fish and amphibians in the St. Lawrence River
(Figure 3.3; Table 3.3). Overall, COl sequences provided better inter- and intraspecific
resolution than ITS sequences.
Sequencing of COl was successful in 1088 of 1955 specimens processed (225 of
441 adults and 863 of 1514 metacercariae). Most (735) of the COl sequences from
metacercariae were from specimens obtained from the six intensively sampled fish
species (Table 3.1). The rest were from 16 less intensively sampled fish species and one
species of amphibian. Mean sequence length was 449 bp and was as high as 634 bp in
some specimens. Usable information could be obtained from sequences as short as 65 bp,
71
but only 20 sequences shorter than 200 bp were used for identifications (see also
Meusnier et al. 2008). Nearly all taxa shared a > 14-bp region rich in Ts approximately
180 bp from the 5' end of COL In some Crassiphialinae this T-rich span contained no
other bases and trace file quality was negatively affected downstream (in forward reads)
and upstream (in reverse reads) of this region. In consequence, sequences from some
crassiphialinid specimens are effectively based on unidirectional reads of trace files
flanking either side of the T-rich span.
The mean and/or maximum intraspecific variation in COl was greater than
expected in nine species (Table 3.3). In four species (Ornithodiplostomum spp. 3 and 4,
Ichthyocotylurus pileatus, Posthodiplostomum sp. 3), DNA traces were of poor quality
and/or based on single-direction reads because of the poly-T region, which likely inflated
variation within species. In five other species {Diplostomum spp. 1, 2 and 4,
Hysteromorpha triloba and Diplostomoidea fam. gen. sp.), trace file quality was not an
issue. COl sequence from one specimen of Diplostomoidea fam. gen. sp. differed by
3.5% from the other eight specimens, which differed by < 1.3%. Additional specimens
with the same, equivalently divergent haplotypes (> 3.5%) would support a second
species, but for the moment we are treating this as a single species. In contrast, in H.
triloba and Diplostomum species with high maximal intraspecific variation (Table 3.3),
the high values are not the result of outlier haplotypes, and a gradient of divergence up to
the maxinum values was observed.
No geographic pattern was evident in species that displayed high intraspecific
divergence despite good quality trace files. For example, COl sequences were identical
or not p rticularly divergent (~1%) in conspecifics of Diplostomum spp. 1 and 4 from
72

avian and fish hosts collected in localities separated by 1700 - 2200 km in Manitoba,
Ontario, Quebec, New Brunswick, and Nova Scotia. The highest levels of divergence in
COl sequences of Diplostomum spp. and H. triloba were obtained from metacercariae
from sympatric fishes in the St. Lawrence River. There was no significant relationship
between the number of specimens sequenced per species and mean intraspecific
divergence in COl sequences (R = 0.117, n = 37, P = 0.117). The relationship between
maximum intraspecific divergence in CO 1 sequences and specimens sequenced per
species was best described by a logarithmic curve indicating a threshold of maximum
intraspecific variation at - 3 % (R2 = 0.836, F32 = 163.6, P < 0.0005), whether outlier
values such as Ornithodiplostomum sp. 4 were included or not.
Despite high intraspecific variation in some species, the species boundaries
indicated by clusters of COl sequence were unambiguous (Figure 3.4). Sequences from
even the most divergent specimens were more similar to conspecifics than to members of
other species. In addition, a character-based parsimony analysis of COl sequences over
400 bp assigned all 955 strigeids to the same clades as the clusters produced in distance-
based NJ analysis. Moreover, the species boundaries of 31 clusters were supported by
host-specific distribution among multiple individual hosts (Table 3.3). Finally, most
species boundaries indicated by COl sequences were supported by ITS sequence data, as
explained below.
ITS sequences were obtained from 122 specimens, including 105 from which
COl sequences were also obtained. These represent 32 species indicated by COl data
(Table 3.3). Topologies produced by NJ analyses of ITS generally supported those
derived from COl sequences from the same specimens (Figure 3.5), with two exceptions.
73

Mean divergence in ITS sequences between Diplostomum sp. 1 and Diplostomum
indistinctum was only 0.37% (range 0 - 0.48%), which does not suggest distinct species.
COl sequences from these species diverged by 11.7% (range 10.2 - 12.6%, see Galazzo
et al. [2002] and Locke et al. [2009], for detailed discussion of these data). The other
exception occurred in 35 Ornithodiplostomum metacercariae from leuciscinids P. notatus
and N. crysoleucas, in which COl sequences formed host-specific clusters with a net
mean interspecific divergence of 5.4% {Ornithodiplostomum spp. 2 and 3). The ITS
sequences from seven of these 35 specimens presented a different picture. Sequences of
ITS from three specimens of Ornithodiplostomum sp. 3 are essentially identical to those
of three specimens of Ornithodiplostomum sp. 2, but the ITS sequence from a single
specimen of Ornithodiplostomum sp. 3 differs from the other six (Figure 3.5). The
divergent ITS sequence may represent a "bad" sequence, although ITS trace files were of
reasonably good quality.
In summary, despite the minor ambiguities described above, in most cases COl
sequence quality was high, requiring little editing and forming clear, discrete clusters.
Species boundaries were generally clear, and in the cases where there was less clarity,
this was often attributable to low trace-file quality. Species boundaries were supported by
character-based MP analysis of COl sequences, by ITS sequence clustering and by host-
and/or tissue-specificity.
Identification of species
Species labelled Tetracotyle, a generic name given to certain larval morphotypes,
were initially identified as Apatemon based on the keys to North American fish parasites
by Gibson (1996) and Hoffman (1999) (see also Chapter 1). The placement of these
74

specimens in Apatemon was reconsidered in light of the overall diversity and
dissimilarity seen among the clusters of both nuclear and mitochondrial sequences.
Although they do not appear in the keys of Gibson (1996) and Hoffman (1999),
metacercariae of related taxa such as Strigea and Apharyngostrigea may also be present
and are difficult to distinguish morphologically from those of other genera once frozen.
We therefore use the more conservative larval genus name, Tetracotyle, with some
exceptions. Species labeled Apatemon are in a COl cluster in which ITS1 and 2
sequences differed by only ~2% from Apatemon gracilis (Bell and Sommerville 2002).
Identification of Ichthyocotylurus pileatus was based on a 99% similarity with an ITS
sequence published by Bell et al. (2001) and on the key of Gibson (1996).
Specimens of Diplostomum baeri, D. indistinctum and D. huronense obtained in
this study were identified by comparing ITS sequences with those published by Galazzo
et al.(2002) and using COl sequences from archived DNA from the specimens studied by
those authors (Locke et al. 2009). Sequence from ITS1 in Diplostomum sp. 3 differs by
only two bases from that of D. pseudospathaceum from Poland (Niewiadomska and
Laskowski 2002) but more data are needed before the relationship of these North
American samples to the European species can be determined (see Locke et al. 2009).
The identification of Conodiplostomum sp. 5 is tentative for several reasons. No
cyst was observed in these metacercariae from the brain of johnny darter. It is possible
freezing the hosts destroyed the fragile cyst typical of this genus, but freezing did not
have this effect in other species that form the same type of cyst (neascus). This
metacercaria lacked pseudosuckers and resembled a neodiplostomulum, which is not
encysted, but that larval morphotype is known only from amphibian hosts. The
75
relationships between Conodiplostomum and neodiplostomula Neodiplostomum and
Fibricola and their links to other diplostomoid groups have been repeatedly revised
(Shoop 1989; Hong and Shoop 1994; Niewiadomska 2002). However, none of these taxa
would be expected to show the high similarity in COl sequences with Tetracotyle spp.
that we observed in Conodiplostomum sp. 5 (Figures 3.3, 3.4b).
Strigeid diversity and specificity in the St. Lawrence River
Strigeids dominated parasite communities of fishes in the St. Lawrence River. In
the six host species in Table 3.2, individual fish were infected with an average of 35
individual metazoan parasites, over half of which (19) were strigeids. The 47 strigeid
species detected in fish (Table 3.3) represent nearly a fourfold increase in diversity
known from Canadian fishes (Figure 3.6). Forty-three of these species occurred in one or
more of the six well-sampled host species. Species accumulation curves suggest that
additional strigeid species remain undetected in at least one of the focal hosts (P.
flavescens) in the study area (Figure 3.7).
Host specificity was evaluated in the 31 species of metacercariae identified by
COl and ITS sequences that were found in two or more individual hosts. Exact tests
indicated that the distribution of host-specific metacercariae among host species was
unlikely to be a sampling artefact. For example, metacercariae identified by sequences as
Posth- Uplostomum sp. 3 were recovered from 19 centrarchid hosts (two A. rupestris, 17
L. gibhosus). There were 194 hosts in these two host species in which
PostJu diplostomum sp. 3 was not detected and it was not found in any of the 599 fish in
variou other species. This distribution (19/194, 0/599) between these two centrarchid
specif and this parasite is unlikely to be random (Table 3.3). Most strigeid species
76

inhabiting non-lens tissues occurred in a single host species or in a small number of close
relatives (Table 3.3). This pattern was consistent across localities. Locality-by-locality
infection levels of each species are not presented here, but an example is given in Table
3.4.
Species of metacercariae inhabiting the lenses offish were significantly less host
specific than those in non-lens tissues, controlling for sampling effort and phylogenetic
influences (Figure 3.8, Table 3.5). In multiple regressions of contrasts, lens-infecting
species were significantly less host specific than non lens species, although it was
difficult to separate the effect of lens infection on host range from that of sampling effort.
Although several quantitative descriptors of host specificity were used, they still
present an incomplete picture of this attribute. For example, the index designed to capture
ecological aspects of host specificity, SJD*, only provides relevant information when
there are three or more host species (Poulin and Mouillot 2005a). For example, 22
specimens from 14 johnny darters and one specimen from a golden shiner were identified
by COl sequencing as Apatemon sp. 1. Unidentified metacercariae of the same
morphotype (Tetracotyle) had a similar distribution, occurring in 55% of johnny darter
and 2.5% of golden shiner. The parasite is much more common in one host than in other
and, in this sense, it is more host specific than if it achieved equal success in both of these
hosts, which are distantly related. However, in this case ( S J D = SJD* = 6). Nearly a
quarter of the strigeid species we detected were found in only two host species (Table
3.3), meaning this aspect of host specificity was not reflected in any of the indices used.
Thus, an additional test of the effect of lens infection on host specificity was warranted.
In this analysis, species were characterized as specialists or generalists based on a
77
qualitative assessment of the distributional data. There was a significant, phylogenetically
independent correlation between lens-infection and low host specificity, regardless if
arguably ambiguous cases such as Tetracotyle sp. 1 (see gray boxes in Figure 3.9) were
classified as specialists or as generalists (difference between four- and eight-parameter
log likelihoods ranged from 4.244 to 4.483, P < 0.04 after 100 simulations).
Essentially, the spectrum of hosts infected by larval strigeids inhabiting the lens
was significantly larger, more phylogenetically diverse, and characterized by more
variable diversity than that of species infecting other sites (Table 3.5, Figure 3.8).
Discussion
Strigeids dominated the parasite communities of a diverse sample of fishes from
the St. Lawrence River and COl sequences revealed an unexpectedly diverse assemblage
of metacercarial species, most of which were host specific. Species inhabiting the lens of
the eye were less host specific than those in other tissues, and these patterns of host
specificity were consistent across localities and among hosts with varying ecological and
phylogenetic affinity. Overall, there is evidence that host specificity in strigeid
metacercariae is more strongly influenced by whether or not host species are
physiologically compatible than whether or not they are ecologically available to these
parasites.
Strigeid diversity and specificity
Our findings represent a large increase in the known diversity of these widely
occurring fish pathogens. The magnitude of diversity observed was unexpected because
the parasites of freshwater fishes in Canada have been well studied using traditional
78

methods (Margolis and Arthur 1979; McDonald and Margolis 1995; Gibson 1996) and
we examined a comparatively small number offish species and limited geographic area.
Previous molecular studies of strigeids have not uncovered similarly increased diversity,
although they encompass a similar number of host taxa and much larger geographic
scope (Table 3.1). This may be because many specimens were pooled in molecular
samples in those studies, which effectively reduces the sample size. In two other studies
of larval trematodes in which specimens were not pooled in molecular analyses, Miura et
al. (2005, 2006) also found a high degree of cryptic diversity in a survey of larval
trematodes.
Most larval strigeids in non-lens tissues were highly host-specific. This
information can be used in the management of disease in wildlife and aquaculture, in
which pathogen identification is a first step to control and treatment. It should also be
considered in studies of the community ecology of parasites of freshwater fishes, in
which larval parasites are usually ignored or pooled at high taxonomic levels.
Specifically, the data suggest two rules-of-thumb for strigeid metacercariae from fish,
although molecular verification of our results from other systems is desirable. Firstly,
morphologically indistinguishable strigeids occurring outside the lens of distantly related
hosts are likely to be different species. In this sense, the strigeids residing outside the lens
are no longer cryptic species, because they can be distinguished based on their host.
Secondly, the data also show that what appears to be a single, morphologically
indistinguishable type of metacercaria specific to single host species, often inhabiting the
same tissue, may actually represent more than one species (e.g., Diplostomum sp. 5 and
D. baeri both inhabit the humour of yellow perch; Ornithodiplostomum spp. 3, 4 and 8 in
79
brain of bluntnose minnow; Posthodiplostomum spp. 1, 2 and 3 in viscera of
pumpkinseed and rock bass).
DNA sequences and species
Sequences of COl were effective for uncovering cryptic diversity. One difficulty
with the barcoding approach to delimiting species is deciding what level of divergence
indicates species boundaries (Desalle et al. 2005). There is probably no universally
applicable ratio of COl divergence within and between species, and additional markers
may be useful in groups where this ratio is unknown, or when COl sequence quality is
poor. In the present case, the species indicated by COl sequences were generally
supported by ITS sequences. However, the ratio of ITS sequence divergence within and
between species was less clear, and in some cases ITS sequences provided no
interspecific resolution. For example, the divergence in COl sequences and host
specificity of Ornithodiplostomum spp. 2 and 3 are strong evidence for separate species,
yet some specimens in these lineages shared identical ITS sequences. In this and similar
cases, the species boundaries that are less clear in our data would be better addressed by
additional samples of cleaner COl data than by ITS data. This is a technics1 issue that
could probably be addressed with COl primers designed specifically for particular
subgroups of strigeids (see Moszczynska et al 2009).
In five species, intraspecific divergence in COl was higher than expected but not
attributable to low-quality traces. However, the most divergent conspecific specimens
still clustered unambiguously (Figure 3.4) and species boundaries were supported by
character-based analysis and host and tissue specificity. Overall, the use of COl data
alone appears to be an appropriate and powerful tool for initial assessment of diversity
80
and host-parasite relationships in this important group offish pathogens. Ferri et al.
(2009) reached similar conclusions after comparing the resolution of 12S rDNA and
barcode-region COl sequences in a diverse sample of parasitic filarid nematodes, despite
finding as little as 2% variation in COl between species. In their study and in ours, the
second ribosomal marker provided corroboration in some cases but was equivocal in
others. Delimiting species on the basis of sequence from any single marker is
controversial (Kunz 2002; Hickerson et al. 2006; Frezal and Leblois 2008; see also
Poulin and Keeney 2007). However, in the presence of high divergence in even a single
marker, it may be most reasonable to conclude the existence of separate species (Nolan
and Cribb 2005), although other sources of variation should also be considered, such as
geographic isolation (Irwin 2002; Kuo and Avise 2005). The latter is not an issue in the
present case because samples were sympatric in the strictest sense (congeneric strigeid
species were ofteri found occupying the same tissue in a single individual fish) and
strigeid species are probably widely dispersed by avian definitive hosts.
One of our aims in obtaining rDNA sequences was to determine whether any of
the COl-delineated species we encountered were the same as those studied previously by
other authors using ITS, which has been more frequently employed to identify trematode
species (Nolan and Cribb 2005; Table 3.1). Only two species encountered had ITS
sequences of high similarity to any strigeids on GenBank. Ichthyocotylurus pileatus and,
less certainly, Diplostomum sp. 3 are both probably conspecific with European species,
the latter having only two differences in ITS 1 with Diplostomum pseiidospathaceum from
Poland (Bell et al. 2001; Niewiadomska and Laskowski 2002; Locke et al. 2009). If this
is true, these are the first strigeids that have been shown by molecular data to reside on
81

both continents. Our lack of matches with other taxa further underscores the extent of
uncharted diversity in this group.
Lens versus non-lens infections
Our data suggest that generalist metacercariae are more likely to inhabit the lens
than other tissues, while metacercariae inhabiting non-lens tissues are more host specific.
The effect of the lens on all measures of host specificity was large if either phylogeny or
sampling effort were taken into account, but reduced in some cases if both confounding
factors were removed. However, since the host specificity of metacercarial species was
not likely a product of chance, it is arguable that sampling effort should not have been
included in multiple regression analyses at all. Omitting sampling effort greatly augments
the effect of the lens on host specificity (data not shown).
The most plausible explanation for lower host specificity in metacercariae
inhabiting the lenses offish is the limited immune response in this site. The membrane
encapsulating the lens appears to provide a protective barrier from immune cells (Shariff
et al. 1980; Whyte et al. 1990), and cell-mediated immunity is particularly important for
fighting helminth infection (Whyte et al. 1990; Reite and Evenson 2006). In mammals,
the central nervous system as a whole is often considered to be immunologically
privileged (Sitja-Bobadilla 2008). In teleosts, however, the rodlet cells that carry out anti-
helminth immune responses also occur in the central nervous system (Reite and Evenson
2006; Dezfuli et al. 2007; Sitja-Bobadilla 2008). This may explain why the strigeids in
non-lens tissues of the central nervous system {Ornithodiplostomum spp., D. baeri,
Diplostomum sp. 2) did not show lower host-specificity.
82

Residence in the lens may also benefit parasites in ways unrelated to the host
immune response. Szidat (1969) suggested that the lens capsule might protect parasites
from gastric juices in the stomach of the definitive host, allowing a higher proportion to
survive and reach the intestine, but this idea has not been tested. In addition, high
numbers of metacercariae in the lens impair vision and anti-predator behaviour in fish
(Seppala et al. 2005a, b, c). However Brassard et al. (1982) and Seppala et al. (2006)
found no evidence that this leads to increased transmission to appropriate hosts. Thus,
there is no evidence that these alternative, potential benefits of lens-infection have real
effects on parasite fitness and, most importantly, none of these hypotheses are mutually
exclusive. In contrast, the immunological privilege of the lens appears to provide access
to a significantly wider range of habitats, which does suggests it may increase parasite
fitness. It seems that additional fitness benefits, if any, may have been secondarily
derived.
Mechanisms of host specificity in strigeid metacercariae
Three aspects of our study suggest that host specificity in strigeid metacercariae is
attributable to physiological rather than ecological factors. Firstly, the link between host
specificity and the lens can be plausibly explained by a physiological mechanism
(immune evasion), while ecological explanations are not obvious. Secondly, the same
patterns of host specificity recurred in separate, distinctive fish communities. In separate
habitats, differences in fish community composition and abiotic factors bring hosts into
contact with parasites that mainly use other hosts (e.g., Leong and Holmes 1981;
Bergeron et al. 1997). However, in our study, most parasites outside the lens were limited
to the sane host species across localities, despite significant differences in fish
83

community composition in each of the three lakes (data not shown; Y. Reyjol, Ministere
des Ressources Naturelles et de la Faune du Quebec, personal communication). Thirdly,
among non-lens parasites that infect multiple host species, host spectra are generally
better explained by the phylogeny of hosts than by ecological convergence. The
distribution of Omithodiplostomum sp. 1 provides an example in which host phylogeny
bridges an obvious ecological gap. Even though its principal host, johnny darter, is
benthic, Omithodiplostomum sp. 1 only occurred in other percids, including yellow
perch, which is pelagic. Neither this species nor any Omithodiplostomum were observed
in other benthic fishes. Similarly, golden shiner is a midwater feeder while bluntnose
minnow consumes organic detritus (Scott and Crossman 1973; data not shown, present
study), but Tetracotyle sp. 6 was nonetheless found only in these two minnows. Finally,
there were few cases of ecologically similar but distantly related hosts sharing parasites,
except those inhabiting the lens. For example, although yellow perch shares many
ecological attributes with the centrarchids sampled here (Scott and Crossman 1973), no
specialist species occurred both in yellow perch and centrarchids. Several relatively
abundant, specialist strigeids (D. baeri, Omithodiplostomum spp. 2 and 3,
Posthodiplostomum spp. 3, 4 and 7) were specific to one or two closely related hosts,
even in localities where these optimal hosts were less abundant (Table 3.1). If ecological
rather than compatibility-related factors governed host specificity in these metacercariae,
then these species should have been detected in ecologically similar, but phylogenetically
distant hosts.
A small but growing number of studies of host specificity have combined field
surveys with DNA-based identifications (e.g., Jousson et al. 2000; Steinauer et al. 2007;
84
Poulin and Keeney 2007). To our knowledge, this approach has not been applied
previously to trematode metacercariae. Few molecular surveys of any helminth parasites
have been conducted on a comparable scale. The breadth and design of the study, along
with the actual data, suggest most strigeid metacercariae are host specific and that their
distribution among host species has more to do with physiological than ecological
factors. In contrast to comparable studies of strigeids, substantial cryptic diversity was
uncovered and in at least one host additional species probably remain undetected in our
study area. It is clear that much remains to be learned about this group in North America
and globally and that DNA barcoding provides a practical means of moving forward.
85

Table 3.1 Review of molecular systematic studies of strigeids
Summary of molecular studies of strigeids that infect freshwater fish as metacercariae. In some
studies, cryptic species have been detected with molecular data, while in others, molecular
methods did not distinguish valid species or led to synonymization of invalid species. These
studies encompass a vast geographic scope and comparable host diversity to the 22 fish and five
avian host species surveyed in the present study. However, in several studies, morphologically
similar specimens from the same individual host or host species were assumed to be conspecific
and pooled in molecular analyses. This approach reduces the collective sample size from ~1500
to somewhat over 200 specimens, less than 20% of the individual specimens sequenced in the
present study. This may explain why there was no net change in diversity detected by traditional
methods and that subsequently recognized with molecular data in these studies, while we
encountered substantial cryptic diversity in a small geographic area (see Figure 3.6).
Taxon Locality
Diplostomum UK Continental Europe Continental Europe
Quebec, Canada
Species
Morphology, life-history
4
2
6
3
detected
Molecular methods
4
2
5
4
Molecular data
SDS-PAGE electrophoresis
RAPD
ITS1
ITS 1-2
Specimens used in
molecular analysis /
pooled into n samples
250/4
40/40
15*/ 15
19/19
n host species: mollusc / fish / bird
0 / 4 / 0
2 / 2 / 0
3 / 3 / 0
0 / 3 / 0
Source*
1
2
3
4
Ichthyocotylurus UK + cont. Europe
Apatemon UK
4
2
4
1
ITS1-2,C01
ITS1-2, COl
48*/24
96/31
0 / 4 / 0
0 / 5 / 0
5
6 Bolbophorus
Southern US 1 Southern US 1
Israel 2
ITS1-2, 18S. 2 28S,C01 21/21 0 / 1 / 2 2 18S,ITSl-2 1137/71 1 /1 /2
2 ITS1.2, 18S ? 0 / 0 / 2
Total: 21' 1625(225) 6 / 1 4 / 4 '
86
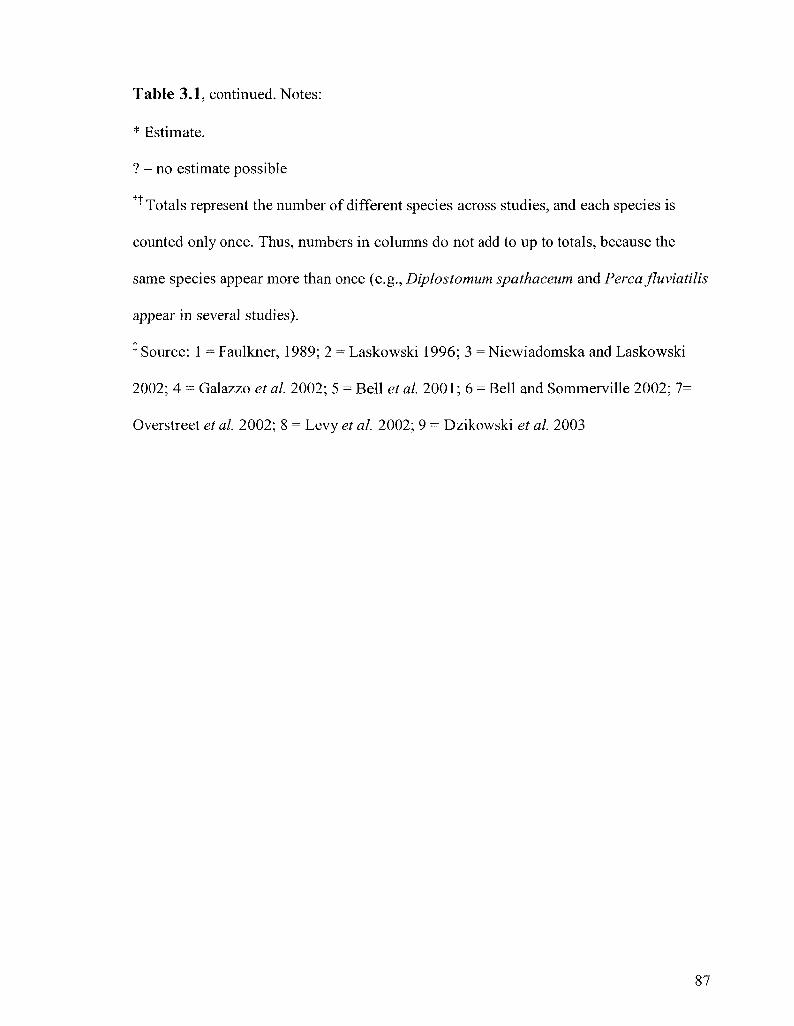
Table 3.1, continued. Notes:
* Estimate.
? = no estimate possible
'! Totals represent the number of different species across studies, and each species is
counted only once. Thus, numbers in columns do not add to up to totals, because the
same species appear more than once (e.g., Diplostomum spathaceum and Perca Jluviatilis
appear in several studies).
* Source: 1 = Faulkner, 1989; 2 = Laskowski 1996; 3 = Niewiadomska and Laskowski
2002; 4 = Galazzo et al. 2002; 5 = Bell et al. 2001; 6 = Bell and Sommerville 2002; 7=
Overstreet et al. 2002; 8 = Levy et al. 2002; 9 = Dzikowski et al. 2003
87

Table 3.2 Numbers offish collected in six focal species sampled at six localities in the St. Lawrence
River
Number offish in six intensively sampled host species examined at six localities in three
lakes of the St. Lawrence River during June-July 2006. Localities are numbered as in
Figure 3.2. Every attempt was made to collect at least 20 hosts in each species at each
locality, and cells < 20 indicate that species were more difficult to collect, thus less
abundant locally. In addition to the 705 hosts in this table, 112 fish in 16 additional
species were collected from the same or nearby localities, during the same season or in
2007-2008.
Cyprini formes
Perciformes
Cyprini dae
Percidae
Centrarchidae
Notemigonus crysoleucas Pimephales notatus Perca flavescens Etheostoma nigrum Lepomis gibbosus Ambloplites rupestris
Lake St. Francois 1 2
18
4
20
9
16
9
20
23
20
26
21
10
Lake St. Louis
3 4
14
18
26
55
23
21
21
26
24
41
24
10
Lake St. Pierre
5 6
20 20
20 20
26 21
0 0
22 26
12 19
88
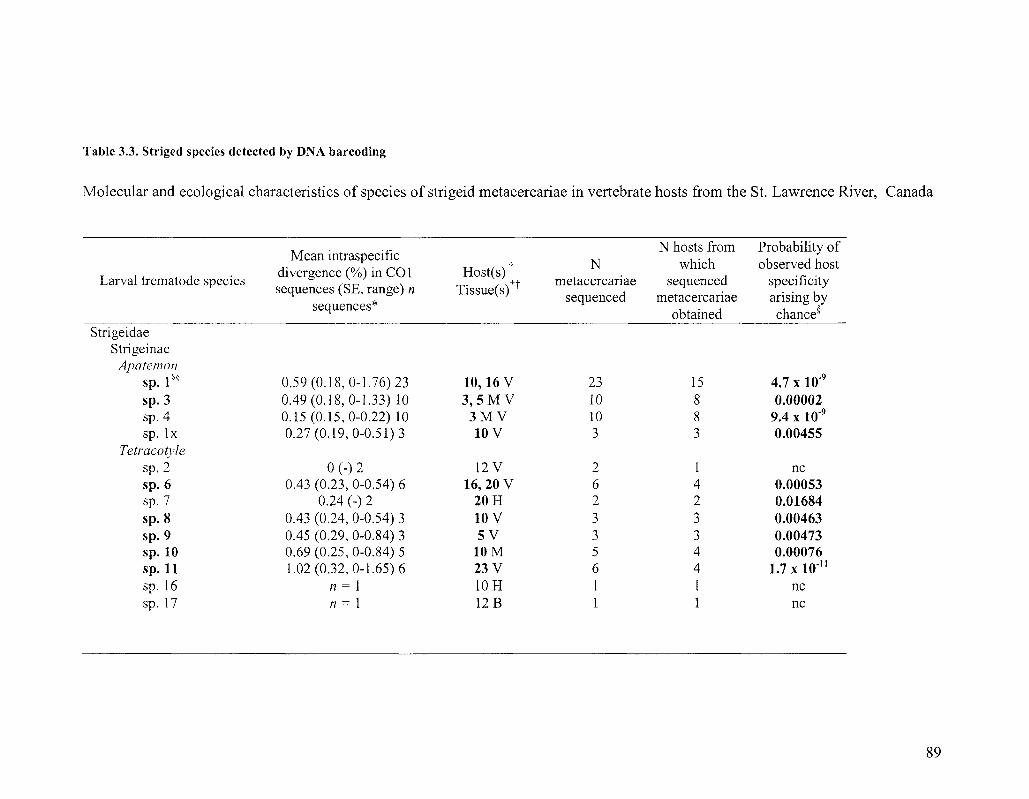
Table 3.3. Striged species detected by DNA barcoding
Molecular and ecological characteristics of species of strigeid metacercariae in vertebrate hosts from the St. Lawrence River, Canada
Larval trematode species
Strigeidae Strigeinae
Ap at em on sp. 1HS
sp. 3 sp. 4 sp. lx
Tetracotyle sp. 2 sp. 6 sp. 7 sp. 8 sp. 9 sp. 10 sp. 11 sp. 16 sp. 17
Mean intraspecific
divergence (%) in CO 1 sequences (SE, range) n
sequences*
0.59(0.18,0-1.76)23 0.49(0.18,0-1.33) 10 0.15(0.15,0-0.22) 10 0.27(0.19,0-0.51)3
0 (-) 2 0.43 (0.23, 0-0.54) 6
0.24 (-) 2 0.43 (0.24, 0-0.54) 3 0.45 (0.29, 0-0.84) 3 0.69 (0.25, 0-0.84) 5 1.02(0.32,0-1.65)6
n = 1 n = 1
Host(s)+
Tissue(s)
10,16 V 3 , 5 M V
3 M V 10 V
12 V 16, 20 V
20 H 10 V 5V
10 M 23 V 10 H 12B
N metacercariae
sequenced
23 10 10 3
2 6 2 3 3 5 6 1 1
N hosts from which
sequenced metacercariae
obtained
15 8 8 3
1 4 2 3 3 4 4 1 1
Probability of observed host
specificity arising by chance8
4.7 x 10'9
0.00002 9.4 x 10⁹
0.00455
nc 0.00053 0.01684 0.00463 0.00473 0.00076
1.7 x 10'11
nc nc
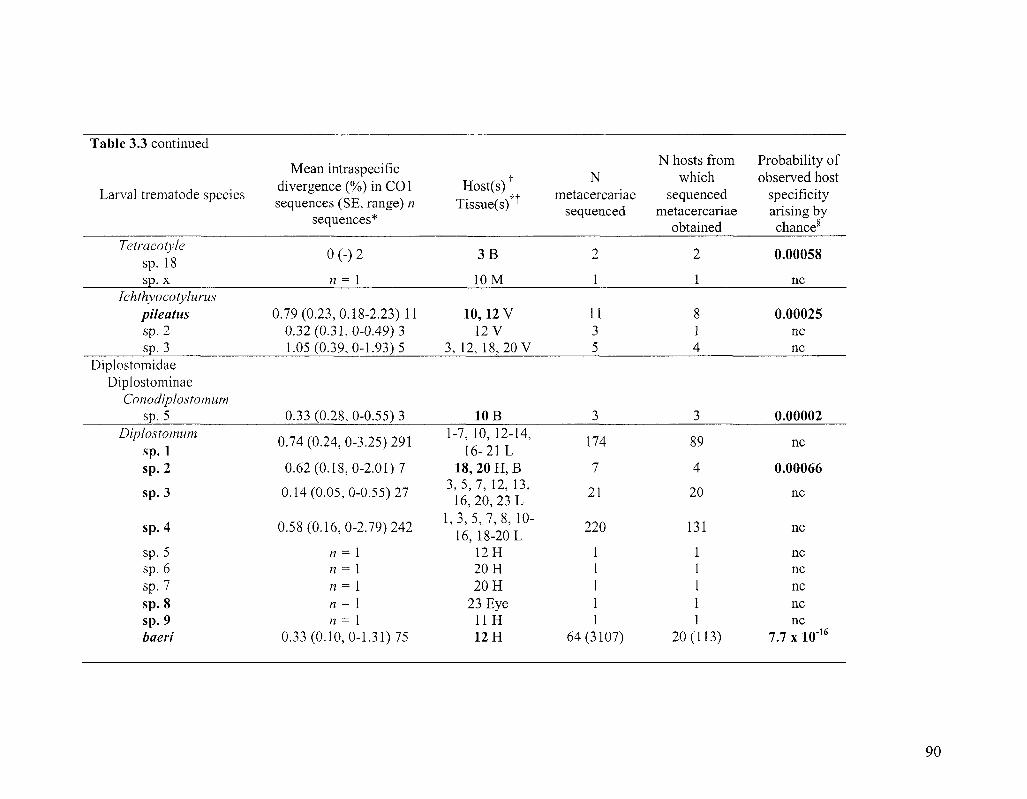
Table 3.3 continued
Larval trematode species
Mean intraspecific divergence (%) in CO 1 sequences(SE, range)n
sequences*
Host(s) Tissue(s)
t tf
N etacercariae sequenced
N hosts from which
sequenced metacercariae
obtained
Probability of observed host
specificity arising by chance8
Tetracotyle sp. 18 sp. X
Ichthyocotylurus pileatus sp. 2 sp. 3
Diplostomidae Diplostominae
Conodiplostomum sp. 5
Diplostomum sp. 1 sp. 2
sp. 3
sp. 4
sp. 5 sp. 6 sp. 7 sp. 8 sp. 9 baeri
0(-)2
n = 1
0.79(0.23,0.18-2.23)11 0.32(0.31,0-0.49)3 1.05(0.39,0-1.93)5
0.33 (0.28, 0-0.55) 3
0.74(0.24,0-3.25)291
0.62(0.18,0-2.01)7
0.14(0.05,0-0.55)27
0.58(0.16,0-2.79)242
n = 1 n = 1 « = 1 n = 1 n = 1
0.33(0.10,0-1.31)75
3B
10 M
10,12 V 12V
3, 12, 18,20 V
10 B 1-7, 10, 12-14,
16-21 L 18,20 H, B
3, 5, 7, 12, 13, 16, 20, 23 L
1 3 5 7 8 10-16, 18-20 L
12 H 20 H 20 H
23 Eye 11H 12 H
2
1
11 3 5
3
174
7
21
220
64(3107)
2
1
8 1 4
3
89
4
20
131
20(113)
0.00058
nc
0.00025 nc nc
0.00002
nc
0.00066
nc
nc
nc nc nc nc nc
7.7 x 10"16
90
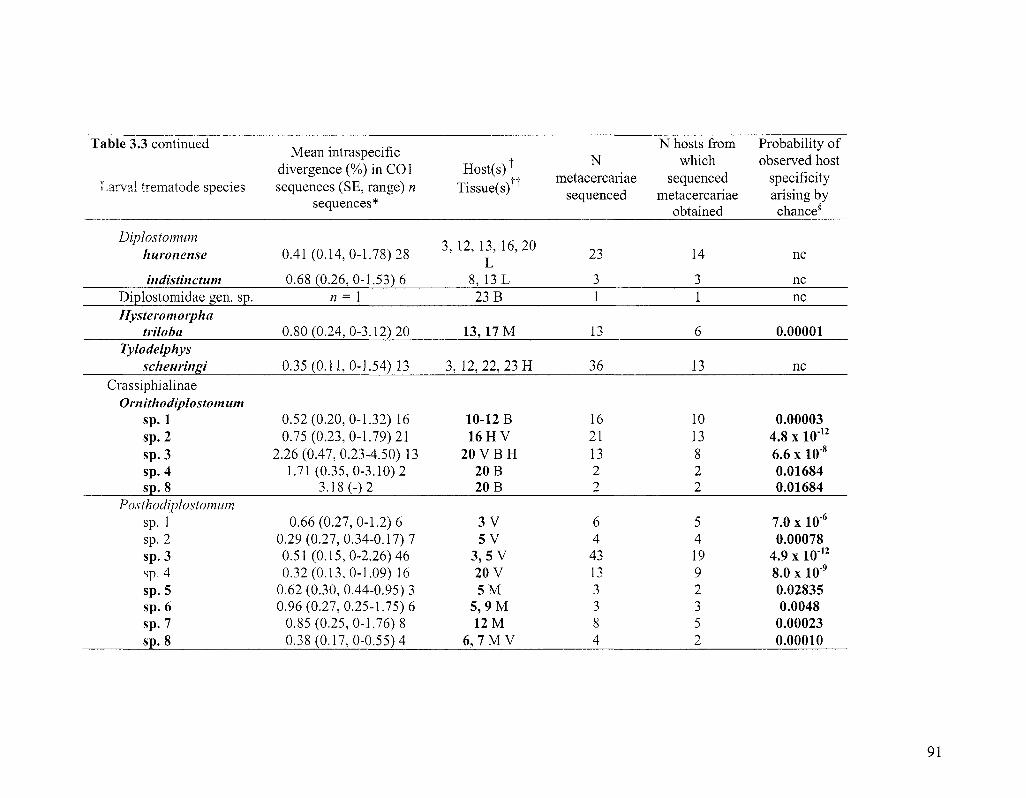
Table 3.3 continued
Larval trematode species
Mean intraspecific divergence (%) in COl sequences (SE, range) n
sequences*
Host(s) Tissue(s)
t N ft metacercariae
sequenced
N hosts from which
sequenced metacercariae
obtained
Probability of observed host
specificity arising by chance8
Diplostomum huronense
indistinctum Diplostomidae gen. sp. Hysteromorpha
triloba Tylodelphys
scheuringi Crassiphialinae
Orn ith odiplostom um sp. 1 sp. 2 sp. 3 sp. 4 sp.8
Posthodiplostomum sp. 1 sp. 2 sp. 3 sp. 4 sp. 5 sp. 6 sp. 7 sp.8
0.41(0.14,0-1.78)28
0.68(0.26,0-1.53)6 n = 1
0.80(0.24,0-3.12)20
0.35(0.11,0-1.54)13
0.52(0.20,0-1.32) 16 0.75(0.23,0-1.79)21
2.26 (0.47, 0.23-4.50) 13 1.71(0.35,0-3.10)2
3.18 (-) 2
0.66(0.27,0-1.2)6 0.29(0.27,0.34-0.17)7 0.51(0.15,0-2.26)46 0.32(0.13,0-1.09) 16
0.62 (0.30, 0.44-0.95) 3 0.96(0.27,0.25-1.75)6
0.85(0.25,0-1.76)8 0.38(0.17,0-0.55)4
3 12 13 16 20 L
8, 13 L 23 B
13,17M
3, 12, 22, 23 H
10-12 B 16 HV
2 0 V B H 20 B 20 B
3V 5V
3,5 V 20 V 5M
5, 9M 12 M
6 ,7MV
23
3 1
13
36
16 21 13 2 2
6 4 43 13 3 3 8 4
14
3 1
6
13
10 13 8 2 2
5 4 19 9 2 3 5 2
nc
nc nc
0.00001
nc
0.00003 4.8 x 10¹²
6.6 x 10"8
0.01684 0.01684
7.0 x 10'6
0.00078 4.9 x i<r" 8.0 x 10"9
0.02835 0.0048
0.00023 0.00010
91

Table 3.3 continued
Larval trematode species
Mean intraspecific divergence (%) in COl Host(s) sequences (SE, range) n Tissue(s)
sequences*
tt
N letacercariae sequenced
N hosts from which
sequenced metacercariae
obtained
Probability of observed host
specificity arising by chance5
Diplostomoidea fam. gen.sp.
Clinostomum sp
1.5(0.34,0.22-3.5)9
0.32(0.11,0-1.84)29
4,5M 2, 5-7, 10, 12, 16
M
9
24
3
13
0.0051
nc
Table 3.3 notes: nc = not calculated because parasite was found in only a single individual host or because the host assemblage is diverse and parasite is not considered host specific. *Based on Kimura 2-parameter distances (Kimura 1980) between sequences obtained from adults and metacercariae, pairwise deletion of gaps, and including sequences from lower quality DNA traces. Standard error calculated from 500 bootstrap replicates (Nei and Kumar 2000). Bold indicates the distribution is deemed host-specific, or potentially so. Only intermediate hosts shown. Hosts: 1 = Labidesthes
sicculus, 2 = Fundulus diaphanus, 3 = Ambloplites rupestris, 4 = Pomoxis nigromaculatus, 5 = Lepomis gibbosus, 6 = Micropterus dolomieu, 7 = Micropterus salmoides, 8 = Apollonia melanostomus, 9 - Morone americana, 10 = Etheostoma nigrum, 11 = Percina caprodes, 12 = Perca flavescens, 13 = Catostomus commersonii, 14 = Moxostoma macrolepidotum, 15 = Carpiodes cyprinus, 16 = Notemigonus crysoleucas, 17 = Notropis atherinoides, 18 = Notropis hudsonius, 19 = Notropis spilopterus, 20 = Pimephales notatus, 21 = Ictalurus nebulosus, 22 = Esox lucius, 23 = Rana pipiens 1 'Tissues: B = brain, M = musculature, V = viscera, H = vitreous humour, L = lens 51 Bold values indicate the probability of the observed host-specific distribution of sequenced metacercariae arising by chance was less than 0.05 in Fisher's exact test. w ITS sequence also obtained for species in bold, see Figure 3.5.
92
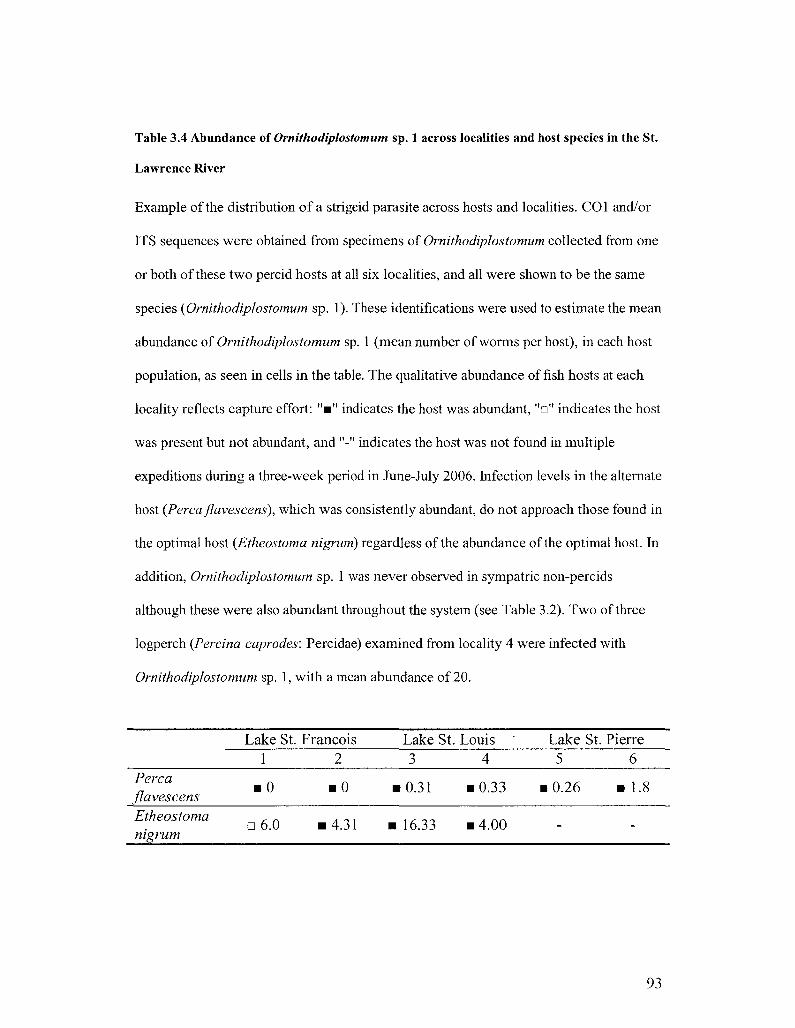
Table 3.4 Abundance of Ornithodiplostomum sp. 1 across localities and host species in the St.
Lawrence River
Example of the distribution of a strigeid parasite across hosts and localities. COl and/or
ITS sequences were obtained from specimens of Ornithodiplostomum collected from one
or both of these two percid hosts at all six localities, and all were shown to be the same
species {Ornithodiplostomum sp. 1). These identifications were used to estimate the mean
abundance of Ornithodiplostomum sp. 1 (mean number of worms per host), in each host
population, as seen in cells in the table. The qualitative abundance of fish hosts at each
locality reflects capture effort: "•" indicates the host was abundant, "D" indicates the host
was present but not abundant, and "-" indicates the host was not found in multiple
expeditions during a three-week period in June-July 2006. Infection levels in the alternate
host {Perca flavescens), which was consistently abundant, do not approach those found in
the optimal host {Etheostoma nigrum) regardless of the abundance of the optimal host. In
addition, Ornithodiplostomum sp. 1 was never observed in sympatric non-percids
although these were also abundant throughout the system (see Table 3.2). Two of three
logperch (Percina caprodes: Percidae) examined from locality 4 were infected with
Ornithodiplostomum sp. 1, with a mean abundance of 20.
Perca flavescens Etheostoma nigrum
Lake St. 1
• 0
a 6.0
Francois 2
• 0
• 4.31
Lake St. 3
• 0.31
• 16.33
Louis " 4
• 0.33
• 4.00
Lake St. Pierre 5 6
• 0.26 Bl.8
-
93
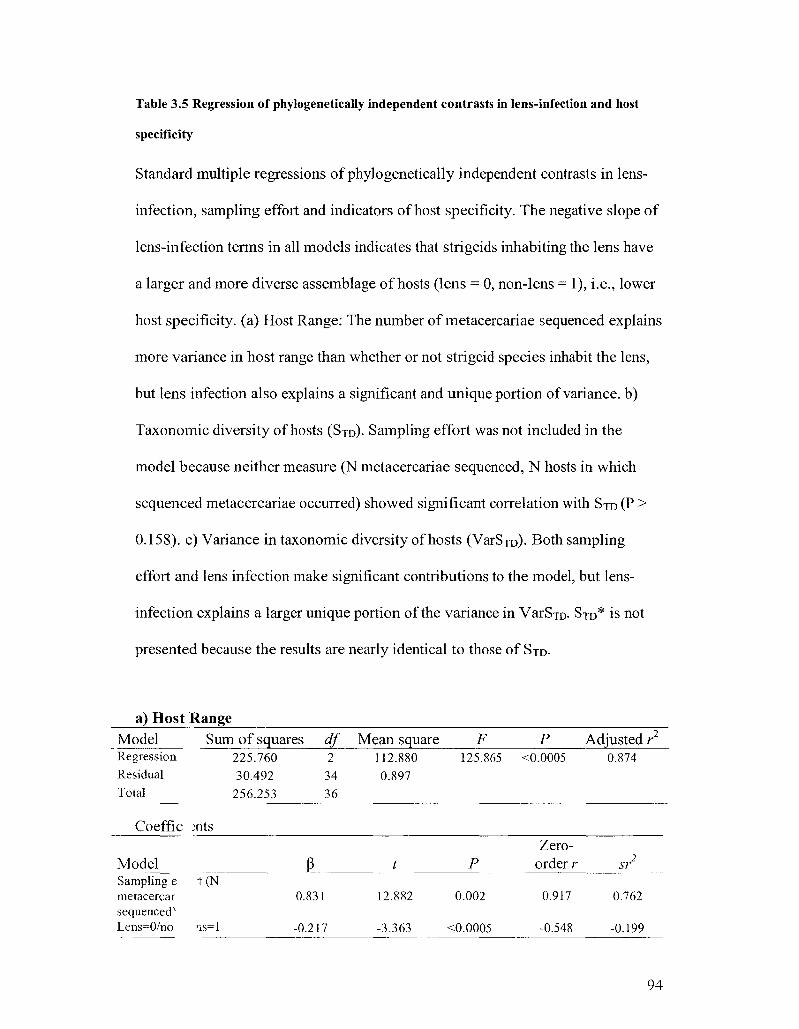
Table 3.5 Regression of phylogenetically independent contrasts in lens-infection and host
specificity
Standard multiple regressions of phylogenetically independent contrasts in lens-
infection, sampling effort and indicators of host specificity. The negative slope of
lens-infection terms in all models indicates that strigeids inhabiting the lens have
a larger and more diverse assemblage of hosts (lens = 0, non-lens = 1), i.e., lower
host specificity, (a) Host Range: The number of metacercariae sequenced explains
more variance in host range than whether or not strigeid species inhabit the lens,
but lens infection also explains a significant and unique portion of variance, b)
Taxonomic diversity of hosts (STD)- Sampling effort was not included in the
model because neither measure (N metacercariae sequenced, N hosts in which
sequenced metacercariae occurred) showed significant correlation with SJD (P >
0.158). c) Variance in taxonomic diversity of hosts (VarSTo)- Both sampling
effort and lens infection make significant contributions to the model, but lens-
infection explains a larger unique portion of the variance in VarSjD- STD* is not
presented because the results are nearly identical to those of STD-
a) Host Range Model Regression
Residual
Total
Coeffic
Model
Sum of squares
;nts
225.760
30.492
256.253
P
df 2
34
36
Mean square 112.880
0.897
t
F 125.865
P
P <0.0005
Zero-order r
Adjusted r2
0.874
2
sr Sampling e ~i (N metacercar 0.831 12.882 0.002 0.917 0.762 sequenced^ Lens=0/no >is=l -0.217 -3.363 <0.0005 -0.548 -0.199
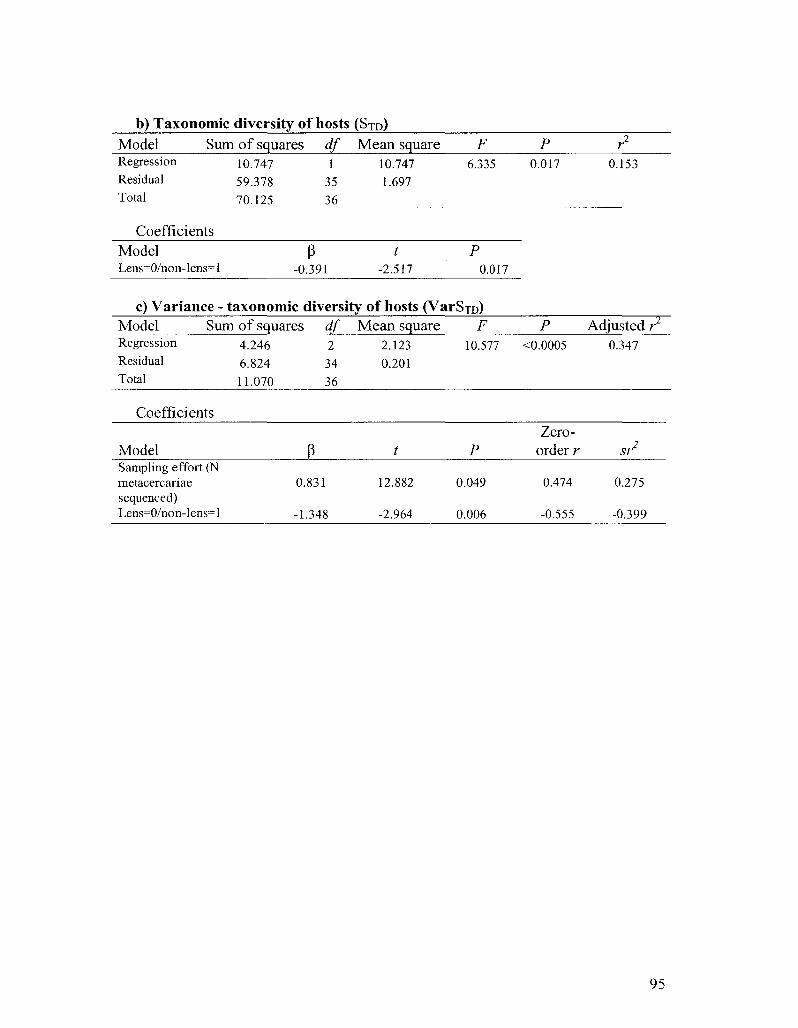
b) Taxonomic diversity of hosts (STD) Model Regression Residual Total
Sum of squares 10.747 59.378 70.125
df 1
35 36
Mean square 10.747 1.697
F 6.335
P 0.017
r2
0.153
Coefficients Model Lens=0/non-lens= 1
P -0.391
/ -2.517
P 0.017
c) Variance - taxonomic diversity of hosts (VarSxp) Model Sum of squares Regression Residual Total
4.246 6.824 11.070
df 2 34 36
Mean square 2.123 0.201
F 10.577
P <0.0005
Adjusted r1
0.347
Coefficients
Model Sampling effort (N metacercariae sequenced) Lens=0/non-lens= 1
P
0.831
-1.348
t
12.882
-2.964
P
0.049
0.006
Zero-order r
0.474
-0.555
2
sr
0.275
-0.399
95

Figure 3.1 The most common life-cycle pattern among strigeid trematodes
Adult parasites in the intestine of definitive hosts (a bird or mammal) reproduce sexually yielding
eggs that pass in host feces. Short-lived dispersal stages hatch from eggs and penetrate snails, the
first intermediate host. Larval stages in snails reproduce asexually, yielding large numbers of
free-living dispersal stages that penetrate fish, the second intermediate host, where they develop
into metacercariae. Metacercariae often form cysts in fish hosts and different strigeid taxa occur
in somatic tissues such as the eyes, brain, musculature, skin and viscera. Definitive hosts such as
piscivorous birds become infected after feeding on infected fish.
96

Figure 3.2 Sampling localities in the St. Lawrence River where most fish were collected
Sampling localities where most fish used in this study were collected during a three-week
period in June and July 2006. In addition to the fish in Table 3.2, 16 other species of fish
from these localities were collected in smaller numbers (1 < n < 20). Studies using mark-
recapture and population genetics have shown there is little mixing of yellow perch in the
St. Lawrence River among all sampling localities except 5 and 6, owing to distance
between sites and physical barriers such as regulatory structures and a dredged shipping
channel that is impassable to small fish (CSL 1996; Dumont 1996; Leclerc et al. 2008). It
is likely that populations of the other fish species under study are separated among these
localities much like yellow perch, and the fish communities sampled at each locality can
therefore be considered independent. Habitat varies at the six localities. The two
upstream localities (1,2) are in a shallow lake where depth is maintained by regulatory
97
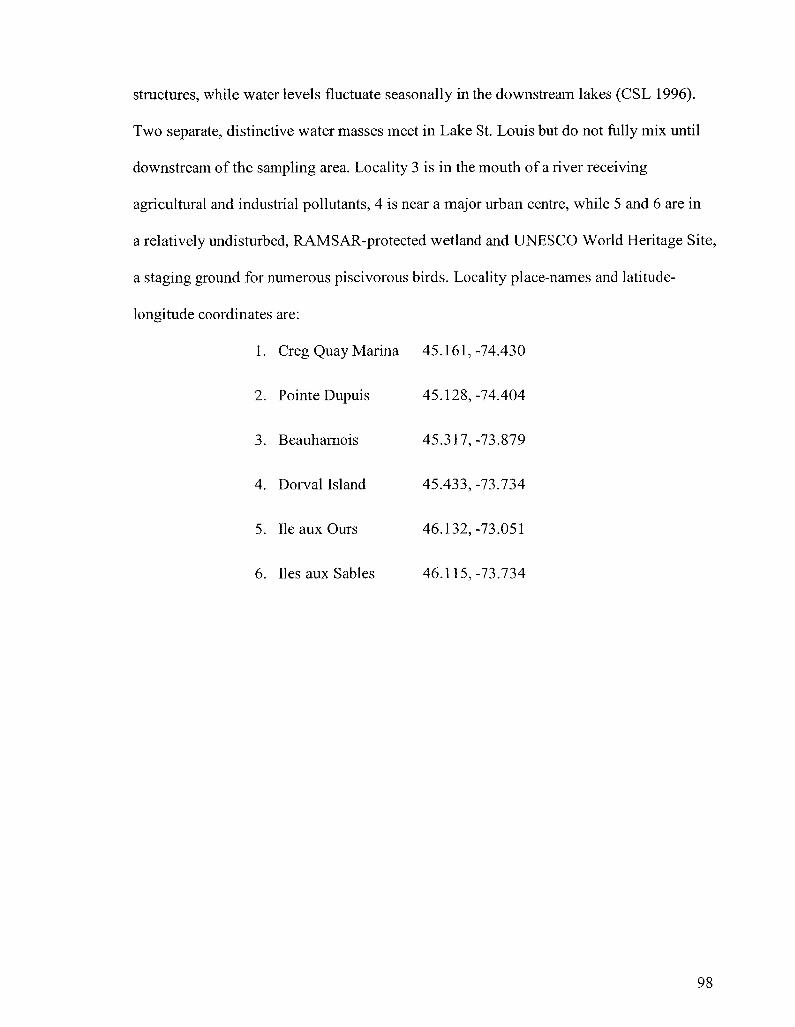
structures, while water levels fluctuate seasonally in the downstream lakes (CSL 1996).
Two separate, distinctive water masses meet in Lake St. Louis but do not fully mix until
downstream of the sampling area. Locality 3 is in the mouth of a river receiving
agricultural and industrial pollutants, 4 is near a major urban centre, while 5 and 6 are in
a relatively undisturbed, RAMSAR-protected wetland and UNESCO World Heritage Site,
a staging ground for numerous piscivorous birds. Locality place-names and latitude-
longitude coordinates are:
1. Creg Quay Marina 45.161,-74.430
2. PointeDupuis 45.128,-74.404
3. Beauharnois 45.317,-73.879
4. Dorval Island 45.433,-73.734
5. IleauxOurs 46.132,-73.051
6. lies aux Sables 46.115,-73.734
98

tE
ri±
• Tetracotyle sp 17 ex Perca flavescens — Tetracotyle sp 7 ex Pimephales notatus
• Tetracotyle sp 18 ex Ambloplites rupestns Tetracotyle sp 16 ex Etheostoma nigrum
— Tetracotyle sp 2 ex P flavescens
Apatemon sp 4 ex A rupestns
— Apatemon sp 3 ex A rupestns, L gibbosus
Apatemon sp 1 ex £ nigrum, Notemigonus crysoleucas — Apatemon sp 1xexE nigrum
• Tetracotyle sp 8 ex £ nigrum Tetracotyle sp 9 ex L gibbosus
• Conodiplostomulum sp 5 ex £ nigrum — Tetracotyle sp 10 ex £ nigrum
Tetracotyle sp X ex £ nigrum
— Tetracotyle sp 11 ex Rana pipiens
• Tetracotyle sp 6 ex N crysoleucas P notatus
— Ichthyocotylurus sp 3 ex diverse fishes (see Table 3 3)
— Ichthyocotylurus pileatus ex £ nigrum P flavescens
Ichthyocotylurus sp 2 ex P flavescens
Posthodiplostomum sp 7 ex P flavescens
Ornithodiplostomum sp 2 ex W crysoleucas
Ornithodiplostomum sp 3 ex P notatus
Ornithodiplostomum sp 4 ex P notatus
Ornithodiplostomum sp 8 ex P notatus
Posthodiplostomum sp 1 ex A rupestns -c Posthodiplostomum sp 2 ex L gibbosus Postho sp 6 ex L gibbosus M salmoides, M dolomieu
Posthodiplostomum sp 8 ex M salmoides, M dolomieu
Posthodiplostomum sp 3 ex A rupestns, L gibbosus
• Posthodiplostomum sp 4 ex P notatus
Ornithodiplostomum sp 1 ex £ nigrum P flavescens, Percina caprodes Posthodiplostomum sp 5 ex L gibbosus
- Tylodelphys scheunngi ex diverse fishes (see Table 3 3)
- Diplostomum sp 9 ex P caprodes Hysteromorpha triloba ex N crysoleucas, Catostomus
commersoni - Diplostomum sp 4 ex diverse fishes (see Table 3 3)
D mdistinctum ex Apolloma melanostoma C commersoni
Diplostomum sp 1 ex diverse fishes (see Table 3 3)
Diplostomum sp 3 ex diverse fishes (see Table 3 3)
- D huronense ex diverse fishes (see Table 3 3)
Diplostomidae gen sp ex R pipiens • Diplostomum sp 2 ex P notatus, Notropis hudsomus
Diplostomum sp 8 ex R pipiens
D baen ex P flavescens
Diplostomum sp 5 ex P flavescens
— Diplostomum sp 6 ex P notatus
- Diplostomum sp 7 ex P notatus Diplostomoidea fam gen sp ex Pomoxis nigromaculatus, L gibbosus
Clinostomum sp ex diverse fishes (see Table 3 3)
0 05
Figure 3.3 Neighbour-joining analysis of cytochrome c oxidase 1 sequences in strigeid
species detected in fish and frogs in the St. Lawrence River
99

Figure 3.3 continued. Neighbour-joining analysis of Kimura-2-parameter (K2P)
distances (Kimura 1980) between representative COl sequences from strigeids collected
from fish and frogs in the St. Lawrence River, Canada. Among the COl sequences over
400 bp from 955 strigeid specimens, the mean within-genus interspecific K2P divergence
ranged from 3.6 to 23.1% and was on average 13.3%.
100

(a)
25 n
2 0
15 •
10
to
n 5 -
..•<x> 0 • 0
• •
• - * •• p
0 0
0 5 10 15 20 25
Maximum intraspecific distance (%)
Figure 3.4. Variation of cytochrome c oxidase 1 sequences within and between species in 40 strigeid
species detected by DNA barcoding
Two ways of visualizing intraspecific and interspecific divergence in COl sequences
among 40 strigeid species detected in the present study. In (a) the shortest genetic
distance in COl sequences between 40 strigeid species is plotted against the maximum
distance within species (Kimura 2-parameter distance (%) between 794 specimens with
sequences over 420 bp). Diamonds indicate comparisons between species in which poor
quality trace files are believed to have inflated intraspecific variation. Although
sequences varied more than expected within nine species (Table 3.3, points above > 2%
along x-axis), COl sequences of the most divergent specimens were never closer to
members of another species than to conspecifics. This is indicated by all points occurring
101
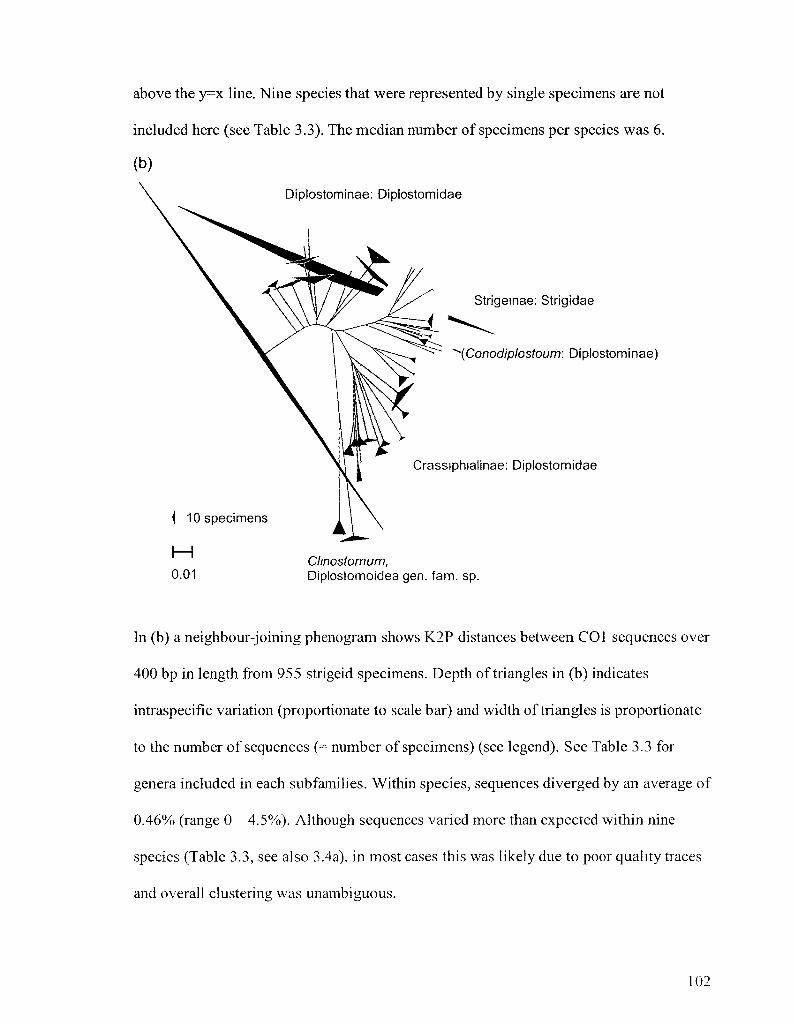
above the y=x line. Nine species that were represented by single specimens are not
included here (see Table 3.3). The median number of specimens per species was 6.
(b)
Diplostominae: Diplostomidae
Strigemae: Strigidae
"(Conodiplostoum: Diplostominae)
Crassiphialinae: Diplostomidae
{ 10 specimens
0.01 Clinostomum, Diplostomoidea gen. fam. sp.
In (b) a neighbour-joining phenogram shows K2P distances between COl sequences over
400 bp in length from 955 strigeid specimens. Depth of triangles in (b) indicates
intraspecific variation (proportionate to scale bar) and width of triangles is proportionate
to the number of sequences (= number of specimens) (see legend). See Table 3.3 for
genera included in each subfamilies. Within species, sequences diverged by an average of
0.46% (range 0 - 4.5%). Although sequences varied more than expected within nine
species (Table 3.3, see also 3.4a), in most cases this was likely due to poor quality traces
and overall clustering was unambiguous.
102
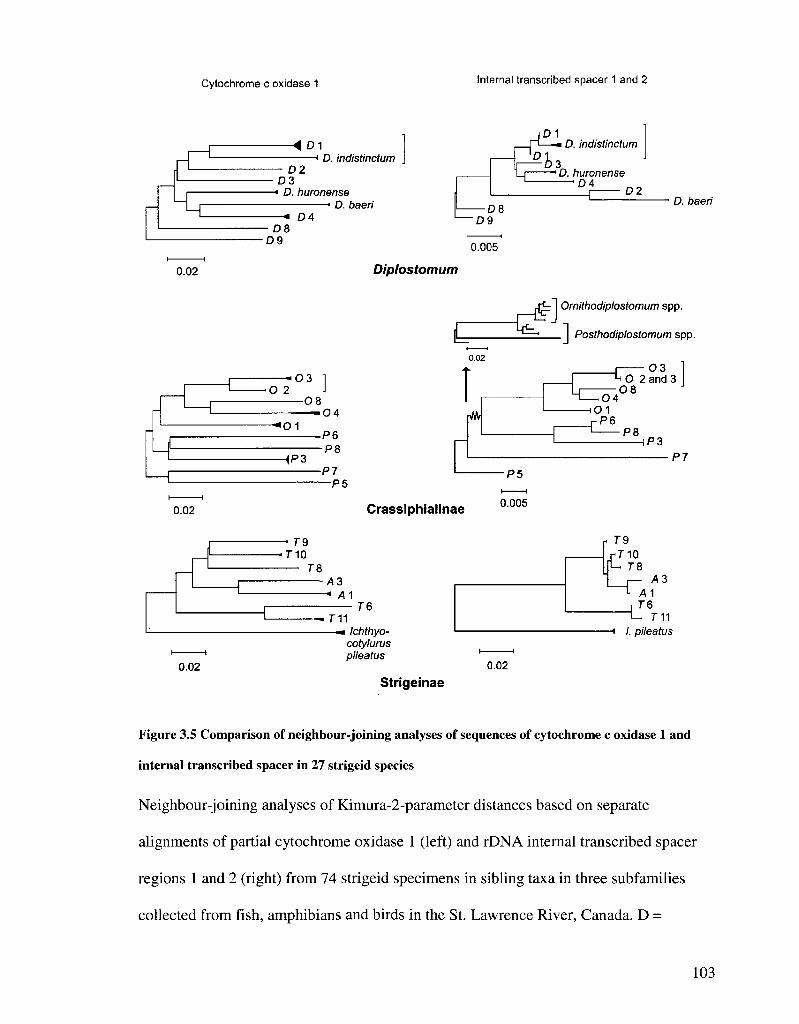
Cytochrome c oxidase 1 Internal transcribed spacer 1 and 2
^
0.02
0.02
0.02
•4D1 ' D. indistinctum
D2
D1
- D 3 -< D. huronense
• D. baeri -« D4
- D8 D9
| Q 3 •O 2
- 0 8
"01
HP3
• 0 4
-P6 - P 8
-P7 — P 5
I ' r 9
I _ ., * A 1 I 1 — T11
. . f
D. indistinctum
D. huronense 'DA
02
- 0 8 D. baeri
D9
0.005
Diplostomum
(=r-^
0.02
I
Crassiphialinae
- P 5 I 1
0.005
7 6
Ichthyo-cotylurus pileatus
0.02
Strigeinae
Ornithodiplostomum spp.
. I Posthodiplostomum spp.
— 0 4 H O I _ £ P i
j 0 3 "Li O 2 and 3
0 8
P8 | P 3
P 7
. 79 r 7 1 0 L - 78
>43 L /A1 I 7-6
•H /. pileatus
Figure 3.5 Comparison of neighbour-joining analyses of sequences of cytochrome c oxidase 1 and
internal transcribed spacer in 27 strigeid species
Neighbour-joining analyses of Kimura-2-parameter distances based on separate
alignments of partial cytochrome oxidase 1 (left) and rDNA internal transcribed spacer
regions 1 and 2 (right) from 74 strigeid specimens in sibling taxa in three subfamilies
collected from fish, amphibians and birds in the St. Lawrence River, Canada. D =
103

Diplostomum, O = Ornithodiplostomum, P = Posthodiplostomum, T = Tetracotyle, A =
Apatemon; see Table 3.3 for a guide to subfamilies. Width and depth of triangles on
branches represent sample size and intraspecific variation, respectively (see also Figure
3.4b). Topologies are not perfectly congruent, but both markers show the same species
boundaries except between D. indistinctum and Diplostomum sp. 1, and between
Ornithodiplostomum spp. 2 and 3. Both ITS and COl were sequenced in 48 other
specimens representing six other species (see Table 3.3) but because no sibling species
were encountered for these groups, they are not shown here.
104
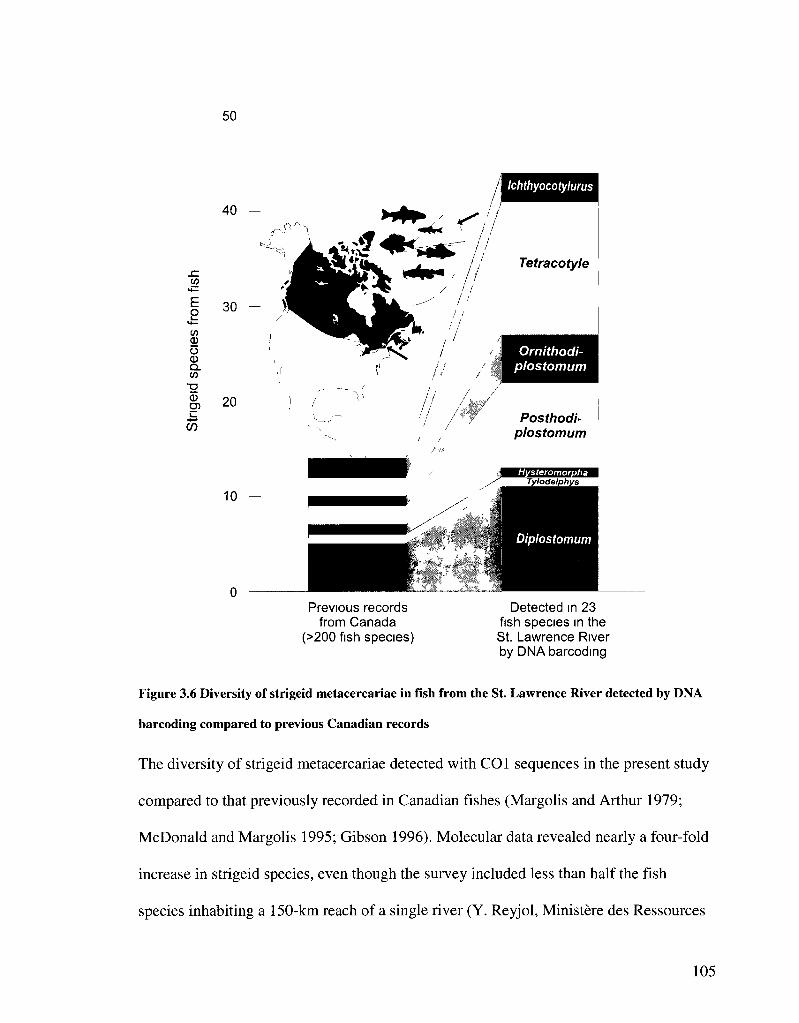
50
oo
E o i_ CO
o (D Q. 00
•g CD
CT i— * — »
CO
40
30
20
10
Ichthyocotylurus
Tetracotyle
Ornithodi-plostomum
Posthodi-plostomum
/ Tylodelphys
Diplostomum
Previous records from Canada
(>200 fish species)
Detected in 23 fish species in the St. Lawrence River by DNA barcoding
Figure 3.6 Diversity of strigeid metacercariae in fish from the St. Lawrence River detected by DNA
barcoding compared to previous Canadian records
The diversity of strigeid metacercariae detected with COl sequences in the present study
compared to that previously recorded in Canadian fishes (Margolis and Arthur 1979;
McDonald and Margolis 1995; Gibson 1996). Molecular data revealed nearly a four-fold
increase in strigeid species, even though the survey included less than half the fish
species inhabiting a 150-km reach of a single river (Y. Reyjol, Ministere des Ressources
105

Naturelles et de la Faune du Quebec, unpublished data), representing less than a tenth of
Canada's fish fauna (pie chart, inset) and a tiny fraction of its surface area (map, inset).
106
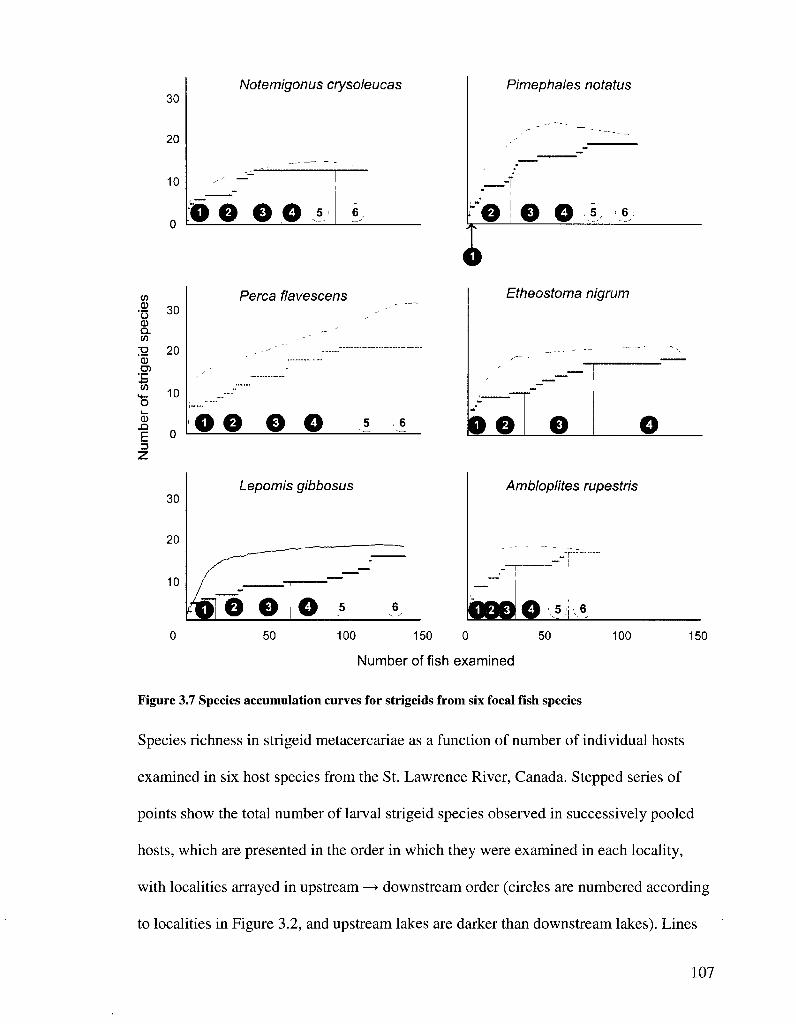
IS)
0 •5 Q. (/> •g 'o
30
20
10
Notemigonus crysoleucas
O O O O 5
30
10
n
Perca flavescens
OO O O 5
. - — •
6
Pimephales notatus
I O O P i.5,<
Etheostoma nigrum
o o
Lepomis gibbosus
50
Ambloplites rupestris
^&^J*W ^r '•-—•
100 150 0 50
Number of fish examined
100 150
Figure 3.7 Species accumulation curves for strigeids from six focal fish species
Species richness in strigeid metacercariae as a function of number of individual hosts
examined in six host species from the St. Lawrence River, Canada. Stepped series of
points show the total number of larval strigeid species observed in successively pooled
hosts, which are presented in the order in which they were examined in each locality,
with localities arrayed in upstream —> downstream order (circles are numbered according
to localities in Figure 3.2, and upstream lakes are darker than downstream lakes). Lines
107
are Chao2 estimates of total species richness, which are based on 999 randomizations and
the numbers of rare species that occur in only one or two individual hosts (Clarke and
Gorely 2006; Dove and Cribb 2006). Chao2 tends to overshoot and then converge on an
asymptote of estimated species richness. In Perca flavescens, the Chao2 function appears
to be beginning to converge on an asymptote, which suggests that < 10 additional strigeid
species would be encountered if more individual P. flavescens were sampled in the St.
Lawrence River. In the other five host species, Chao2 converges on observed species
richness, suggesting most strigeid species parasitizing these hosts at these localities in the
St. Lawrence River were detected in the present study. Geographically, observed species
richness increases with increasing numbers of hosts, but no particular locality or lake is
consistently associated with increased diversity.
108
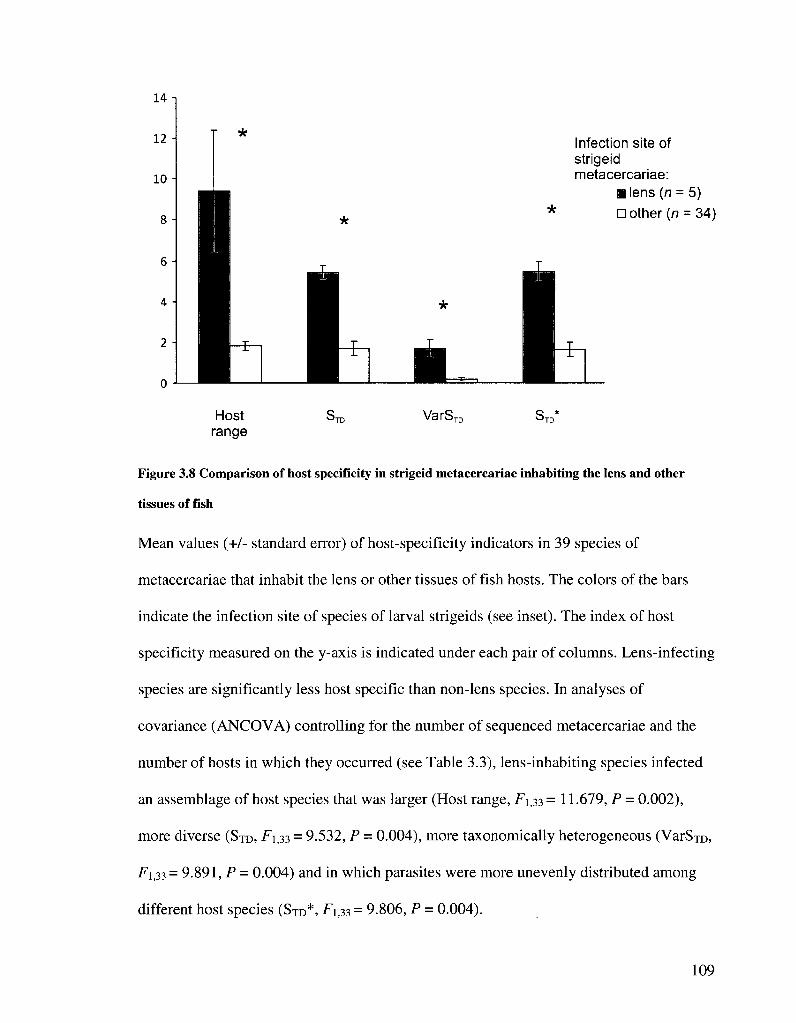
14 -i
Infection site of strigeid metacercariae:
• lens {n = 5) * • other (n = 34)
Host range
VarST
Figure 3.8 Comparison of host specificity in strigeid metacercariae inhabiting the lens and other
tissues of fish
Mean values (+/- standard error) of host-specificity indicators in 39 species of
metacercariae that inhabit the lens or other tissues of fish hosts. The colors of the bars
indicate the infection site of species of larval strigeids (see inset). The index of host
specificity measured on the y-axis is indicated under each pair of columns. Lens-infecting
species are significantly less host specific than non-lens species. In analyses of
covariance (ANCOVA) controlling for the number of sequenced metacercariae and the
number of hosts in which they occurred (see Table 3.3), lens-inhabiting species infected
an assemblage of host species that was larger (Host range, F133 = 11.679, P = 0.002),
more diverse (STD, ^1,33 = 9.532, P = 0.004), more taxonomically heterogeneous (VarSTD,
F133 = 9.891, P = 0.004) and in which parasites were more unevenly distributed among
different host species (STD*, Fi>33 = 9.806, P = 0.004).
109
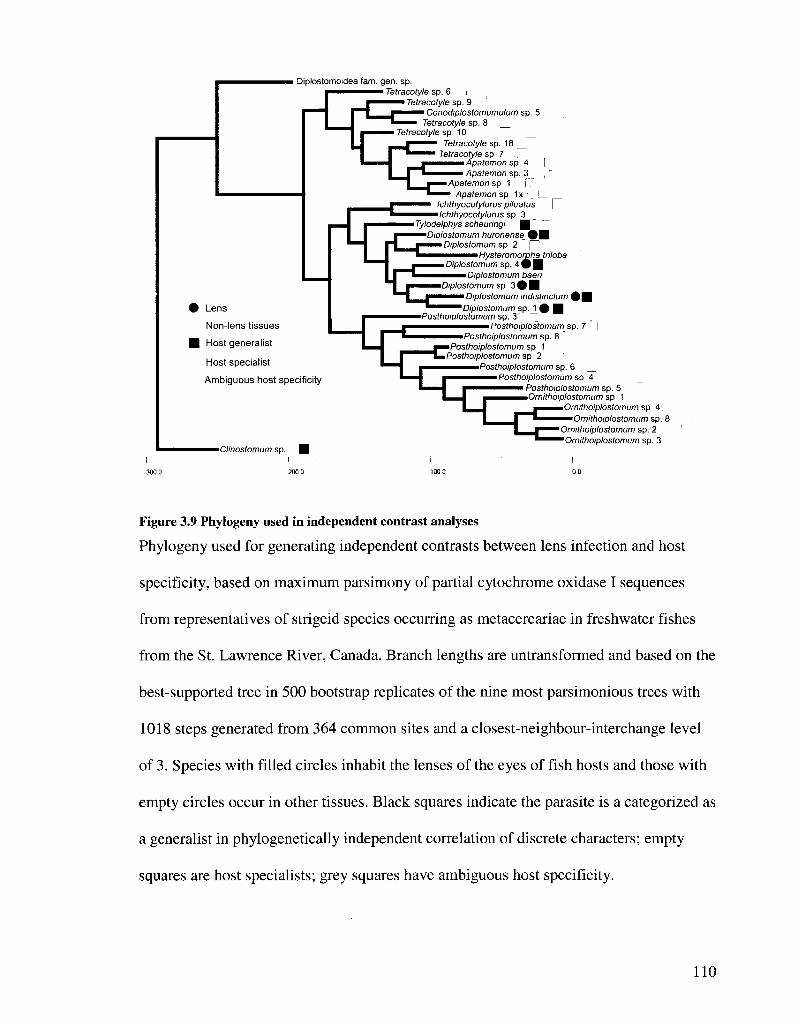
i Diplostomoidea fam. gen. sp. ' Tetracotyle sp. 6 i_
'Tetracotyle sp. 9
0 Lens
Non-lens tissues
• Host generalist
Host specialist
Ambiguous host specificity
Conodiplostomumulum sp. 5 Tetracotyle sp. 8
Tetracotyle sp 10 Tetracotyle sp. 18
Tetracotyle sp 7 _,[~~ Apatemon sp 4 [ Apatemon sp. 3_
Apatemon sp 1 [ J Apatemon sp 1 x • L
Ichthyocotylurus pileatus Ichthyocotylurus sp. 3
Tylodelphys scheuringi Diplostomum huronense (
Diplostomum sp 2 [""] mmmmmmmHysteromorpha triloba Diplostomum sp. 4 0 |
Diplostomum baen Diplostomum sp 3<
Diplostomum indistmctum £ | Diplostomum sp. 1 0 |
Posthoiplostomum sp. 3'_ Posthoiplostomum sp. 7
Posthoiplostomum sp. 8
•CTmostomum sp.
Posthoiplostomum sp 1 Posthoiplostomum sp 2
Posthoiplostomum sp. 6 Posthoiplostomum sp 4
Posthoiplostomum sp. 5 Ornithoiplostomum sp 1
Ornithoiplostomum sp 4'„ Ornithoiplostomum sp. 8
Ornithoiplostomum sp. 2 Ornithoiplostomum sp. 3
Figure 3.9 Phylogeny used in independent contrast analyses
Phylogeny used for generating independent contrasts between lens infection and host
specificity, based on maximum parsimony of partial cytochrome oxidase I sequences
from representatives of strigeid species occurring as metacercariae in freshwater fishes
from the St. Lawrence River, Canada. Branch lengths are untransformed and based on the
best-supported tree in 500 bootstrap replicates of the nine most parsimonious trees with
1018 steps generated from 364 common sites and a closest-neighbour-interchange level
of 3. Species with filled circles inhabit the lenses of the eyes of fish hosts and those with
empty circles occur in other tissues. Black squares indicate the parasite is a categorized as
a generalist in phylogenetically independent correlation of discrete characters; empty
squares are host specialists; grey squares have ambiguous host specificity.
110

Chapter 4 Hosts matter more than habitat for freshwater fish parasite communities
Introduction
Although the structure of parasite communities has been a focus of parasite
ecology for decades, few widely applicable generalizations have been discovered (Poulin
2007a), even in well-studied hosts such as freshwater fish (Kennedy 2009). Numerous
factors affect parasite communities with variable consistency in these hosts. In this study,
we compared the relative importance of host phylogeny and habitat in structuring parasite
communities in six species of freshwater fish from the St. Lawrence River, Canada.
A fundamental aspect of a parasite's ecology is its distribution among host taxa,
i.e., its host specificity. Although usually studied from the point of view of individual
parasite taxa, host specificity can also be considered to be an attribute of parasite
communities. Most parasite species are host specific (Poulin and Morand 2004) and
specificity should therefore emerge at the community level as well. An absolutely host-
specific community of parasites would be limited to a single host species, while the
boundaries of less host-specific parasite communities will encompass multiple host
species that are more distantly related. In this sense, host specificity is measured with
direct reference to the phylogeny of host taxa.
Parasite communities also vary along environmental gradients. In freshwater fish,
habitat attributes predictive of parasite community variation are related to water quality,
bathymetry, and overall fish community composition (Leong and Holmes, 1981;
Bergeron et al. 1997; Fellis and Esch 2005a; Goater et al. 2005). Much of the similarity
of parasite communities in separate host populations can be explained by the geographic
111
distance between them (Poulin and Morand 1999; Poulin 2003; Karvonen and Valtonen
2004; Fellis and Esch 2005a, b; Karvonen et al. 2005a). Essentially, parasite communities
that are closer together are more similar than distant ones, and a plausible explanation for
this relationship is that proximate habitats tend to be more similar than distant habitats
(Soininen et al. 2007; Vinarski et al. 2007). In the present study, geographic distance is
used as surrogate measure of habitat similarity.
Herein we compare the influence of these two fundamental sources of variation in
parasite communities, namely the phylogenetic distance between host species and
geographic distance between habitats. Both types of distance are tested simultaneously in
our analyses, but for rhetorical purposes, we might first consider phylogenetic distance
between hosts in isolation. Do closely related host species tend to have similar parasite
communities? Poulin (2010) found a weak relationship between the qualitative similarity
of parasite communities and phylogenetic distance in a meta-analysis of parasite data
from 45 species of freshwater fish. Using a more quantitative approach, Poulin (2005)
found no phylogenetic signal in infection levels of individual parasite taxa (rather than
communities) among sympatric freshwater fish species. Our dataset includes spatial
replicates of host species that are closely related but ecologically dissimilar and host
species that are ecologically similar but phylogenetically distant, allowing a robust
evaluation of this question at the level of the parasite community.
We wanted to test which of these two types of separation, phylogenetic distance
between host species, or geographic distance between host populations, is a stronger
predictor of their parasite community similarity. No study has examined this particular
question, but two related studies found that host phylogeny explains all (Seifertova et al.
112
2008) or much (Vignon and Sasal 2009) of parasite community structure, compared with
geographic distance. However, Poulin (2010) suggested that the phylogenetic distance
between hosts had a much smaller effect on parasite community similarity than
geographic distance.
Our study differs from other surveys of parasite communities in multiple host
species in several respects. Firstly, the study is based on original field data that minimizes
temporal and seasonal variation, and was designed to isolate spatial and phylogenetic
effects on parasite communities with appropriate replication. In addition, the entire
metazoan parasite community was inventoried in every fish, rather than only adult
helminths, and morphological parasite identifications were done by the same person and
thus are consistent within the study. In contrast, most comparable studies have not
controlled for one or more of these potentially confounding factors (Poulin and Morand
1999; Poulin 2003, 2005, 2010; Karvonen et al. 2005a; Seifertova et al. 2008; Perez-del-
Ohno et al. 2009; Timi et al. 2009). Secondly, molecular methods were used to
discriminate species in an important group of larval helminths (Locke et al. 2009; Locke
et al. in preparation - see Chapter 3). Thirdly, we employed non-parametric analyses
which have not been widely used in parasitology in order to examine the effects of
geographic and phylogenetic factors on parasite communities. These approaches can be
used with unbalanced designs and make no assumptions about data distribution or the
ratio of cases to observations, which make parasite ecological data problematic for
conventional multivariate techniques.
113
Materials and methods
Sampling
Six species of fish were collected at six localities in three fluvial lakes in the St.
Lawrence River near Montreal, Quebec during a three-week period in June-July of 2006
(Table 3.2; Figure 3.2). Seven hundred and five fish were collected using a beach seine
and only 1 + year-class, or the smallest sized fish available were retained. Fish were killed
in an overdose of clove oil solution and frozen until dissection. This ensured that fish
were local and had been exposed to the same pool of parasites for the same amount of
time prior to capture. At necropsy fish were thawed and weight and length were recorded.
Parasites were identified to the lowest taxonomic level possible using the keys of
Beverly-Burton (1984), Kabata (1988), Arai (1989), Gibson (1996) and Hoffman (1999).
Strigeid metacercariae were stored in 95% ethanol for DNA analysis as described in
Moszczynska et al. (2009) (Chapter 1), Locke et al. (2009) (Chapter 2) and Locke et al.
(in preparation - see Chapter 3). DNA was extracted from strigeid specimens and species
were distinguished based on sequences from the barcode region of cytochrome oxidase 1
(COl) and, in some cases, internal transcribed spacer (ITS) regions of rDNA. Larval
stages of nematodes, cestodes and acanthocephalans were identified to generic or family
level based on morphology and host specificity, using the above-mentioned keys.
Ecological analyses
The effects of host and habitat on parasite community similarity were assessed
using a range of non-parametric multivariate techniques with PRIMER v.6 and
PERMANOVA+ (PRIMER-E, Plymouth, UK). In many of these techniques the response
114
variable was the Bray-Curtis similarity (or dissimilarity) between the parasite
communities of two individual fish (i.e., infracommunities). Bray-Curtis similarity is both
quantitative and qualitative. If calculated based on the untransformed abundance of
parasites, this index will reflect the distribution of common parasite species.
Transformations can be performed on parasite abundance that place increasing emphasis
on rare parasites species. The most drastic transformation (presence/absence) assigns
equal weight to abundant and rare species and represents qualitative community
similarity. Thus, depending on the transformation of parasite abundance data, analyses
based on Bray-Curtis similarity reflect different aspects of parasite community structure,
including species richness, composition and abundance.
Similarities between parasite communities were visualized with non-metric multi
dimensional scaling (MDS) prior to subsequent analyses and to aid with their
interpretation. Although MDS is not a hypothesis-testing technique, it was clear that
parasite communities formed groups reflecting host phylogeny and subsequent analysis
sought to compare the influence of host phylogeny with that of habitat.
Two different approaches were used to determine whether attributes related to the
host or its habitat were more important for parasite community structure. One set of
analyses sought to identify which type of category (host or habitat) best discriminates
among parasite communities. The second approach examined which of the two types of
distance (host or habitat) were more strongly correlated with parasite community
similarity.
Among the categorical analyses, the first test compared whether host species or
local) y provided better discriminatory power in parasite infracommunities. A model II
115

(random effects) multivariate permutational analysis (PERMANOVA, Anderson 2001)
was used to determine the extent to which host species and sampling locality explained
multivariate similarity in parasite communities, while controlling for host length
(normalized within species). This technique is analogous to multivariate analysis of co-
variance (MANCOVA), but partitions the distances in the multivariate data cloud of
dissimilarities that can be attributed to different factors. The stratified sampling design
corresponded to a two-way crossed PERMANOVA design (host species x locality) with
two empty cells (because johnny darter was caught at four of six localities) and a high
number of residual degrees of freedom. PERMANOVA was based on square-root
transformed parasite abundance of the entire parasite community, with no dummy
variable added (i.e, no uninfected fish, see below). The square-root transformation
reduces the influence of abundant species and results in a scale of abundance ranging
from 0 to about 6 and therefore it is still a quantitative index of community similarity. By
constructing variance terms according to a random effects model, the hypothesis tested
regards not only the particular host species and localities surveyed, but any host species
from any localities of which these can be considered random representatives (Anderson
2001). In other words, this test could be thought of as an assessment of the effects of
these categories in parasite communities in cyprinid, centrarchid and percid hosts in
North American waters.
As a further investigation of categorical partitioning in parasite communities,
analysis of similarities (ANOSIM) was performed to examine the extent to which parasite
communities are structured by different hierarchical levels of categories relating to the
host (e.g., host species, family, and order) and its habitat (locality, lake). ANOSIM is
116

analogous to analysis of variance (ANOVA) and yields a global R statistic that is
proportionate to the magnitude of overall difference between factors, much like the F
statistic of ANOVA (Clarke 1993). Unlike PERMANOVA, which uses actual
dissimilarity values, ANOSIM ranks dissimilarities and tests whether ranks are, on
average, higher within or between factors.
Canonical analysis of principal coordinates (CAP) was conducted as a
complementary method of evaluating parasite community categories (Anderson and
Willis 2003). This ordination approach identifies axes through the multivariate cloud of
pairwise resemblances in order to maximize discrimination among a priori groups. In the
present context it was used to determine whether parasite communities are predictive of
membership in taxonomic and geographic groups. Because CAP is computationally
intensive, the data set was reduced from 705 infracommunities to 34 component
communities (all parasites in a host population, see Appendix), based on the average
abundance of each parasite species in a given host species at a given locality. CAP was
conducted on a Bray-Curtis resemblance matrix (based on square-root transformed
abundance) among these 34 component communities, and leave-one-out diagnostics were
used to designate the number of axes generated.
The foregoing analyses evaluated which of two types of categories, the host or its
habitat, corresponded more strongly to partitions in parasite communities. If host
phylogeny has a greater effect on parasite communities, then host-related categories will
describe parasite community boundaries. If habitat attributes are more important, then
spatial categories will be more important, because parasite communities from a given
locality or lake are subject to the same habitat conditions.
117

The second set of analyses addressed essentially the same host-versus-habitat
question, but from the point of view of distances between parasite communities. The
geographic distance between parasite communities was used as a surrogate measure of
habitat variation (Soininen et al. 2007; Vinarski et al. 2007). This was compared to the
phylogenetic distance between hosts, which was estimated using the classifications of
species, genus, subfamily, family, class, order and superorder (classifications followed
Nelson 2006). Conspecifics were assigned a taxonomic distance (TD) of zero and TD
increased by 1 unit in steps to a taxon common to both hosts. For example, golden shiner
(Notemigonus crysoleucas) and bluntnose minnow {Pimephales notatus) are in the same
subfamily (Leuciscinae), which results in all hosts in these species being separated by TD
= 2. Both these cyprinid hosts are in the same superorder as the other four hosts and are
therefore separated from the latter by TD — 6 (see inset to Figure 4.5).
Nonparametric correlations were used to quantify how strongly phylogenetic and
geographic distances between hosts were associated with the similarity of their parasite
communities. To avoid a biased view of community similarity, parasite abundance was
subject to a series of transformations giving progressively greater emphasis to rare
species (no transformation, square-root, fourth root, log (x+1), presence/absence). These
transformations were conducted for the entire parasite community as well as for two
separate guilds of parasites, namely allogenic parasites (which have at least one terrestrial
host) and autogenic parasites (which complete their life cycles in the aquatic
environment). Finally, for each of these guilds and transformations, similarities were also
calculated with a single individual in a dummy parasite species added to every fish. This
was done because Bray-Curtis similarity is undefined between empty communities. By
118
adding a dummy parasite, two uninfected fish (i.e., having no real parasites) are
calculated to be 100% similar. In the present case, including a dummy variable allowed
38 fish with no parasites out of 705 examined to be included in the analysis. This "zero-
adjustment" to Bray-Curtis similarity is appropriate when comparing communities that
lack species for the same biological reason (Clarke et al. 2006), which likely applies to
uninfected hosts exposed to the same pool of parasites.
The addition of a dummy parasite, transformations of parasite abundance data and
partitioning of the parasite community into guilds resulted in a proliferation of similarity
matrices. For each, it was desirable to see which of the two predictor matrices (taxonomic
or geographic distance) was the stronger correlate. To visualize the relationships between
these matrices, the correlation coefficients between them were themselves treated as a
distance measure in 2STAGE, which is essentially an ordination of ordinations (Clarke
and Gorley 2006).
Following 2STAGE analysis, three matrices were selected for statistical testing,
one of each type of predictor matrix, and one matrix based on community similarity.
However, matrix data are not independent because, in the present example, each
infracommunity was compared with the 704 remaining infracommunities, and the
resulting matrix yielded > 247 000 data points from 705 observations. To control for the
non-independence of pairwise comparisons, the relationships between matrices were first
evaluated using RELATE, a non-parametric form of the Mantel test (Clarke and Gorley
2006). If the relationship was significant, standard multiple regression was then
performed to see which of the two predictor matrices (host phylogeny, geographic
distance) explained more variance in the parasite community similarity matrix. Multiple
119

regression also included Euclidean distances between fish calculated based on another
expected correlate of parasite community similarity, fish length (normalized within
species) (Poulin, 1995).
Results
In total, 79 species of metazoan parasites were encountered in the six host species
(Appendix 4.1). Over half (47) were species of larval strigeids detected by DNA
barcoding (Locke et al. 2009; Locke et al. in preparation - see Chapter 3). On average,
fish were infected with 35 individual metazoan parasites and larval strigeids accounted
for 19 of these.
Across the six localities and host species, infracommunities and component
communities showed a pattern that strongly reflected the phylogeny of their hosts and
was less consistent with collection localities (Figures 4.1 and 4.2). A large effect of host
phylogeny also emerged in subsequent statistical tests.
Host and habitat as parasite community boundaries
The strongest predictor of parasite community structure in the two-way crossed
PERMANOVA was host species, as indicated by the large pseudo-F statistic associated
with this term (Table 4.1), followed by length and interaction effects. The small pseudo-F
statistic for locality (1.8617), although significant, shows that this factor describes
comparatively little parasite community structure compared with other factors.
There was a significant interaction effect between host species and locality. The
nature of the interaction can be visualized in an MDS of the component communities
(Figure 4.2b), which shows that the direction of locality effects on parasite communities
120
differs among host families, but at every locality there are differences between species.
To verify this, main effects and pairwise PERMANOVAs (model II) were conducted to
detect and assess differences in parasite infracomrnunities between host species within
each locality. These showed that there were significant differences in infracomrnunities
between every host species at every locality, except the two cyprinid hosts at locality 1
(PERMANOVA, pseudo-t = 1.4722, P = 0.093). However, this marginally significant
difference may be related to the small sample size (n = 4) of P. notatus at that locality
(see Table 3.2).
There was also a significant interaction between host species and fish length,
although the low pseudo-F value indicates the magnitude of this interaction was
comparatively small. Here again, the MDS of the component communities is instructive
(Figure 4.2c). Within each species, lengths are distributed heterogeneously among
localities. For example, the largest A. rupestris, P. flavescens, E. nigrum, and second
largest P. notatus were found at locality 1, where L. gibbosus and N. crysoleucas were
small. A series of ANOVAs showed there were significant differences in how lengths
within each host species were partitioned geographically at all localities except locality 5
(ANOVA F4.9g = 1.434, P = 0.229), where all fish were uniformly smaller than
conspecifics at other localities (normalized lengths ranging from -0.7 to -0.3). However,
both main effects and pairwise PERMANOVA tests (see above) indicated significant
separation between all host species at this locality as well. In conclusion, the effects of
length and locality differ in strength and direction among the six host species, although
effects of both are similar within host families. Nonetheless, parasite communities appear
to differ among all host species regardless of length and locality.
121
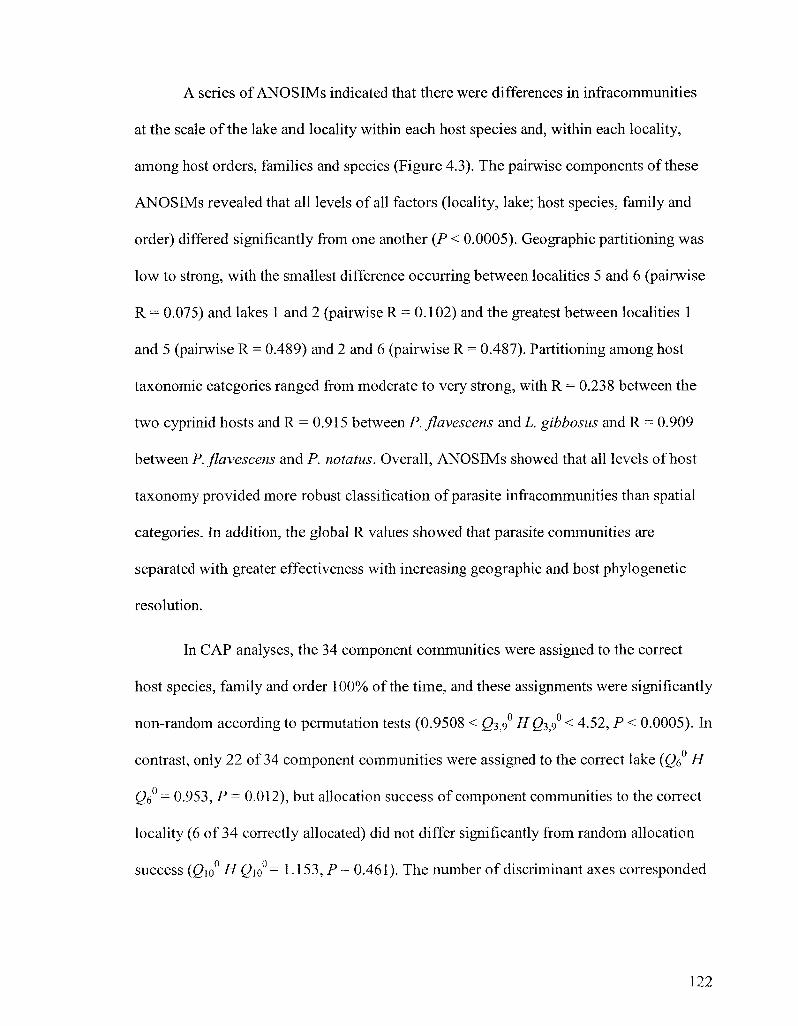
A series of ANOSIMs indicated that there were differences in infracommunities
at the scale of the lake and locality within each host species and, within each locality,
among host orders, families and species (Figure 4.3). The pairwise components of these
ANOSIMs revealed that all levels of all factors (locality, lake; host species, family and
order) differed significantly from one another (P < 0.0005). Geographic partitioning was
low to strong, with the smallest difference occurring between localities 5 and 6 (pairwise
R = 0.075) and lakes 1 and 2 (pairwise R = 0.102) and the greatest between localities 1
and 5 (pairwise R = 0.489) and 2 and 6 (pairwise R = 0.487). Partitioning among host
taxonomic categories ranged from moderate to very strong, with R = 0.238 between the
two cyprinid hosts and R = 0.915 between P. flavescens and L. gibbosus and R = 0.909
between P. flavescens and P. notatus. Overall, ANOSIMs showed that all levels of host
taxonomy provided more robust classification of parasite infracommunities than spatial
categories. In addition, the global R values showed that parasite communities are
separated with greater effectiveness with increasing geographic and host phylogenetic
resolution.
In CAP analyses, the 34 component communities were assigned to the correct
host species, family and order 100% of the time, and these assignments were significantly
non-random according to permutation tests (0.9508 < g3,9° #03,9° < 4.52, P < 0.0005). In
contrast, only 22 of 34 component communities were assigned to the correct lake (Qe H
Qe°- 0.953, P = 0.012), but allocation success of component communities to the correct
locality (6 of 34 correctly allocated) did not differ significantly from random allocation
success (2io° H Q]o°= 1.153, P = 0.461). The number of discriminant axes corresponded
122
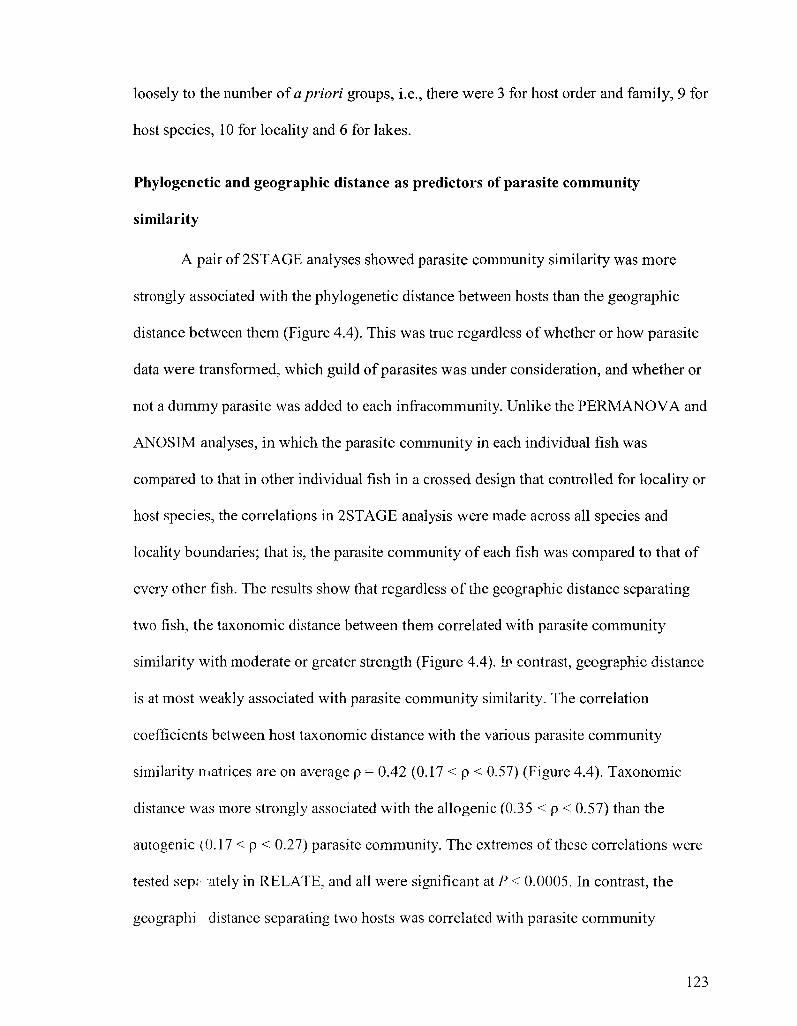
loosely to the number of a priori groups, i.e., there were 3 for host order and family, 9 for
host species, 10 for locality and 6 for lakes.
Phylogenetic and geographic distance as predictors of parasite community
similarity
A pair of 2STAGE analyses showed parasite community similarity was more
strongly associated with the phylogenetic distance between hosts than the geographic
distance between them (Figure 4.4). This was true regardless of whether or how parasite
data were transformed, which guild of parasites was under consideration, and whether or
not a dummy parasite was added to each infracommunity. Unlike the PERMANOVA and
ANOSIM analyses, in which the parasite community in each individual fish was
compared to that in other individual fish in a crossed design that controlled for locality or
host species, the correlations in 2STAGE analysis were made across all species and
locality boundaries; that is, the parasite community of each fish was compared to that of
every other fish. The results show that regardless of the geographic distance separating
two fish, the taxonomic distance between them correlated with parasite community
similarity with moderate or greater strength (Figure 4.4). Ir> contrast, geographic distance
is at most weakly associated with parasite community similarity. The correlation
coefficients between host taxonomic distance with the various parasite community
similarity matrices are on average p = 0.42 (0.17 < p < 0.57) (Figure 4.4). Taxonomic
distance was more strongly associated with the allogenic (0.35 < p < 0.57) than the
autogenic (0.17 < p < 0.27) parasite community. The extremes of these correlations were
tested sep?' ately in RELATE, and all were significant at P < 0.0005. In contrast, the
geographi distance separating two hosts was correlated with parasite community
123
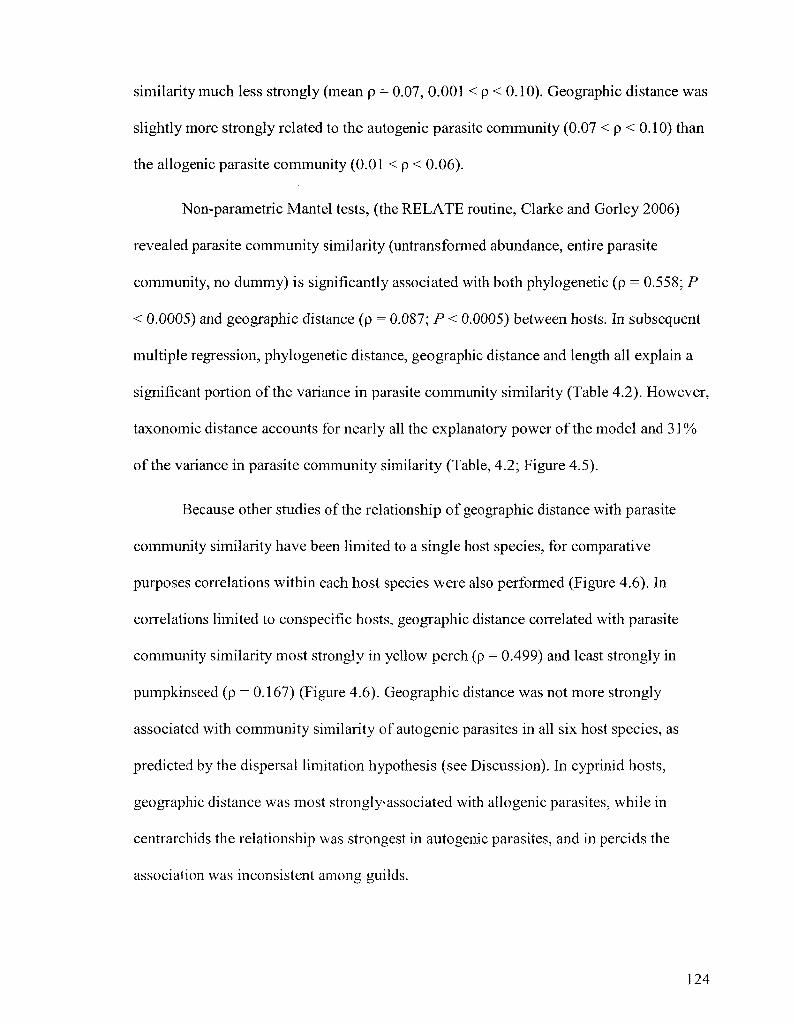
similarity much less strongly (mean p = 0.07, 0.001 < p < 0.10). Geographic distance was
slightly more strongly related to the autogenic parasite community (0.07 < p < 0.10) than
the allogenic parasite community (0.01 < p < 0.06).
Non-parametric Mantel tests, (the RELATE routine, Clarke and Gorley 2006)
revealed parasite community similarity (untransformed abundance, entire parasite
community, no dummy) is significantly associated with both phylogenetic (p = 0.558; P
< 0.0005) and geographic distance (p = 0.087; P < 0.0005) between hosts. In subsequent
multiple regression, phylogenetic distance, geographic distance and length all explain a
significant portion of the variance in parasite community similarity (Table 4.2). However,
taxonomic distance accounts for nearly all the explanatory power of the model and 31 %
of the variance in parasite community similarity (Table, 4.2; Figure 4.5).
Because other studies of the relationship of geographic distance with parasite
community similarity have been limited to a single host species, for comparative
purposes correlations within each host species were also performed (Figure 4.6). In
correlations limited to conspecific hosts, geographic distance correlated with parasite
community similarity most strongly in yellow perch (p = 0.499) and least strongly in
pumpkinseed (p = 0.167) (Figure 4.6). Geographic distance was not more strongly
associated with community similarity of autogenic parasites in all six host species, as
predicted by the dispersal limitation hypothesis (see Discussion). In cyprinid hosts,
geographic distance was most strongly*associated with allogenic parasites, while in
centrarchids the relationship was strongest in autogenic parasites, and in percids the
association was inconsistent among guilds.
124
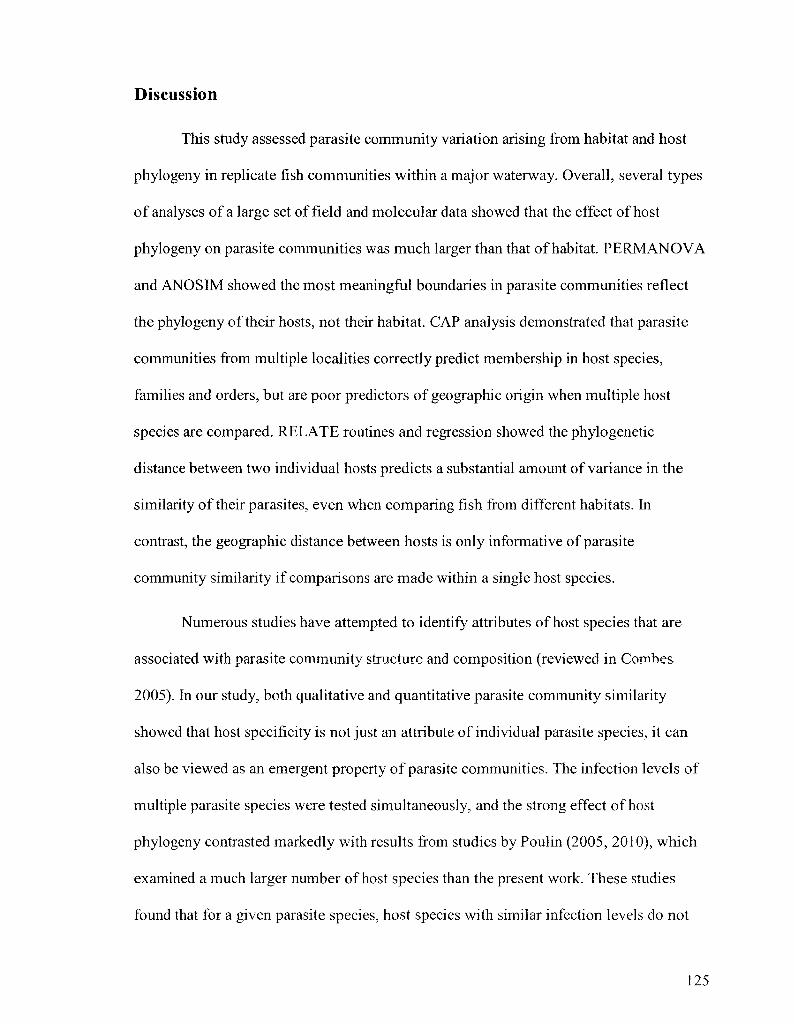
Discussion
This study assessed parasite community variation arising from habitat and host
phylogeny in replicate fish communities within a major waterway. Overall, several types
of analyses of a large set of field and molecular data showed that the effect of host
phylogeny on parasite communities was much larger than that of habitat. PERMANOVA
and ANOSIM showed the most meaningful boundaries in parasite communities reflect
the phylogeny of their hosts, not their habitat. CAP analysis demonstrated that parasite
communities from multiple localities correctly predict membership in host species,
families and orders, but are poor predictors of geographic origin when multiple host
species are compared. RELATE routines and regression showed the phylogenetic
distance between two individual hosts predicts a substantial amount of variance in the
similarity of their parasites, even when comparing fish from different habitats. In
contrast, the geographic distance between hosts is only informative of parasite
community similarity if comparisons are made within a single host species.
Numerous studies have attempted to identify attributes of host species that are
associated with parasite community structure and composition (reviewed in Combes
2005). In our study, both qualitative and quantitative parasite community similarity
showed that host specificity is not just an attribute of individual parasite species, it can
also be viewed as an emergent property of parasite communities. The infection levels of
multiple parasite species were tested simultaneously, and the strong effect of host
phylogeny contrasted markedly with results from studies by Poulin (2005, 2010), which
examined a much larger number of host species than the present work. These studies
found that for a given parasite species, host species with similar infection levels do not
125
tend to be closely related, and there is only a weak tendency for closely related hosts to
have similar parasite communities (Poulin 2005, 2010). However, there are important
differences between these studies and the present work. Poulin (2005) included only
autogenic parasites, while we inventoried the entire infracommunity. In addition, Poulin
(2005) included only parasite taxa present in four or more sympatric host species, which
is likely to have skewed his results in favour of generalists and arbitrarily reduced the
role of host phylogeny in infection levels. Poulin (2010) limited his analysis to qualitative
similarity among communities of parasite genera rather than species. In contrast, the
present study is based on original field data and attempts to control for confounding
influences that cannot be dealt with in meta-analyses. For example, data compiled by
Poulin (2005, 2010) was derived from studies offish of unknown age classes, collected in
different seasons and years (e.g., Leong and Holmes, 1981).
Nonetheless, the relationship we observed between taxonomic distance and
autogenic parasites was comparatively weak, and in that sense our results are consistent
with Poulin (2005), who found no relationship (and did not consider allogenic parasites).
Together these findings suggest that allogenic parasites are more host specific than
autogenic parasites. This emerged clearly in 2STAGE analysis, and can be attributed to
two basic attributes of the parasite communities surveyed here: first, most allogenic
parasites were larval strigeids (in terms of both abundance and diversity) and, second,
most strigeids were highly host specific (Locke et al. in preparation - see Chapter 3).
Although we examined parasite community similarities in only six host species, it
is worth emphasizing that two of them differ markedly in their ecology, but are closely
related. Johnny darter is benthic and smaller bodied than the pelagic yellow perch, yet the
126
overall communities of these two percids were still more similar to each other than to any
other hosts. The difference between the two fish was mostly attributable to high levels of
Diplostomum baeri, found only in yellow perch (data from SIMPER analysis, not
shown). If the ecological convergence of hosts was more important than phylogenetic
distance, we would expect the parasite communities of yellow perch to bear more
resemblance to those of the ecologically similar centrarchids (Scott and Crossman 1973).
Instead, the parasites of centrarchids are more similar to those of johnny darter, largely
because both johnny darter and pumpkinseed were infected by larval Dichylene in the
liver and shared low levels of Diplostomum spp. in the lens (SIMPER analysis, not
shown).
We used geographic distance principally as a surrogate for habitat variation
between individual fish, in order to compare its effects on parasite communities with the
effects of phylogenetic distance, similar to Seifertova et al. (2008). Those authors found
that phylogenetic distance was a stronger predictor of parasite community similarity than
geographic distance among European populations of Leuciscus cephalus (Cyprinidae). In
fact, the apparent effect of geographic distance was completely attributable to the genetic
distance in sequences of cytochrome b between host populations (Seifertova et al. 2008).
This study examined the same question on a much smaller geographic scale, but among
host species, rather than among populations of a single species. Like Seifertova et al.
(2008), we also found that phylogenetic distance was much more predictive of
quantitative and qualitative parasite community similarity.
In this respect, our study resembles that of Vignon and Sasal (2009), who also
examined the effects of spatial and host factors on parasite communities in eight tropical
127

fish species from multiple localities. Those authors found that the amount of variation in
parasite communities that could be attributed to geographic and host effects depended on
scale. In fish communities on islands 1500 km apart, geography and host species were
equivalent in predicting infection levels, while at smaller scales, host species was the
most important predictor in most cases. However, at the 1500-km scale, Vignon and
Sasal (2009) compared only a single pair of congeneric fish species. To reconcile the
implications of their results and ours, it seems that if host populations are separated by
geographic distances that are very large and phylogenetic distances that are sufficiently
small, the effect of habitat variation may approach that of host phylogeny. On the whole,
even though there are no units in which these distances can be compared, it seems
reasonable to maintain that host phylogenetic distance has a greater effect on parasite
communities than geographic distance (see Seifertova et al. 2008).
Two mechanisms have been advanced to explain the tendency of spatially
proximate communities to be similar, namely dispersal limitation and environmental
gradients (e.g., Soininen et al. 2007). Distant communities may tend to be dissimilar
because organisms are less likely to disperse across greater distances. If the dispersal
mechanism is accurate, the greater mobility of the terrestrial hosts of allogenic parasites
should reduce the effect of geographic distance on community similarity in this guild. In
our results, the relative strength of the distance-similarity relationship was not
consistently associated with any parasite guild in the six host species. This is in keeping
with studies to date. In some studies (Poulin 2003; Karvonen and Valtonen 2004;
Karvonen et al. 2005a), higher-dispersing allogenic parasites showed the expected
weaker relationships (or none) with geographic distance than lower-dispersing autogenic
128
parasite, while in others, the opposite trend was observed (Fellis and Esch, 2005a, b).
Taken together, this suggests that something else may explain this widely observed trend
in parasite communities (see also Vinarski et al. 2007), and our use of geographic
distance as a surrogate measure for habitat variation seems well justified in consequence.
Our study did not focus on the nature of the relationship between community
similarity and geographic distance in the same manner as recent works (Poulin 2003;
Fellis and Esch 2005b). For example, only two recent studies have examined this
relationship at the infracommunity level (Perez-del-Olmo et al. 2009; Timi et al. 2009)
and none have done so in freshwater fish hosts. Nor have any other studies looked the
decay of similarity with geographic distance in a replicated manner among multiple fish
communities. We suspect the lack of a similarity-distance relationship in some previous
studies of allogenic parasite communities may be due to depauperate communities (e.g., a
single allogenic parasite species in Karvonen and Valtonen (2004) and Karvonen et al.
(2005a), the taxonomic imprecision inherent in meta-analyses (Poulin 2003),
morphological identifications of metacercariae (Karvonen and Valtonen 2004; Karvonen
et al. 2005a), as well as pooling of samples collected in different years, seasons, or culled
from different studies (Karvonen and Valtonen 2004; Karvonen et al. 2005a; Poulin
2003). In contrast, our allogenic data set was rich in species, supported by molecular
identifications (Locke et al. in preparation - see Chapter 3), morphological identifications
were done by a single person, and temporal variation in parasite communities was
minimized by simultaneously sampling sympatric of hosts of approximately the same
age.
129
Indeed, the importance to the present work of species-level identification of
metacercariae cannot be overstated. The molecular techniques and data which underpin
community analyses presented here are discussed elsewhere (Moszczynska et al. 2009,
Locke et al. 2009, Locke et al. in preparation - see Chapter 3). Without these data, our
results would likely have been strikingly different, as strigeid metacercariae would have
been treated as few dominant generalist genera. Molecular data were essential to
uncovering the diversity and specificity of this dominant group of parasites. A
surprisingly small proportion of field studies employing molecular data do so to study
purely ecological processes (Johnson et al. 2009). The present study provides an
additional example of how molecular information can lead to novel conclusions with far-
reaching implications in the community ecology of parasites.
130

Table 4.1 Multivariate permutational analysis (PERMANOVA) of host and locality as descriptors of
parasite communities in freshwater fish
Results of model II (random effects) PERMANOVA based on Bray-Curtis similarities of
square-root transformed abundance of parasite infracommunities, with no dummy
variable. Parasite communities in three outlier fish excluded. The sums of squares are
sequential (Type I) and 999 permutations of residuals were performed under a reduced
model.
Factors: Name Type
Length (normalized within species)
Locality
Species
Levels
covariate (random) continuous
random 6
random 6
Source Sum of squares df Mean square Pseudo-F
Unique permutations
Length Locality Species Length x locality Length x species Locality x species * Length x locality x species Residuals Total
30 309
188 690
124 500
17 768
63 510
235 300
1 5 5
5
5
23
30 309.0
37 738.0
224 900.0
3 553.6
12 702.0
10 231.0
4.0679
1.8617
17.5350
1.2627
3.1144
5.8510
998 996 999
998
997
998
0.001
0.003
0.001
0.076
0.001
0.001
0 0
152 600 660 1746.4
812 700 704
No test
*Two empty cells
Significant effects in bold.
131

Table 4.2 Predictive power of geographic and taxonomic distance for the similarity of parasite
communities in six freshwater fish species from the St. Lawrence River
Results of backward regressions with three factors used to predict parasite community
similarity (Bray-Curtis similarity based on untransformed abundance, no dummy
variable). A model with three predictors (taxonomic and geographic (km) distance
between hosts and Euclidian distance between fish hosts calculated from length,
normalized within species) explained significantly more variance in similarity than one
based on taxonomic distance alone (indicated by the significant changes in R2). However,
the magnitude of change in R2 was small; the taxonomic distance between hosts accounts
for over 96% of the explanatory power of the model. Thus, in comparisons of multiple
species offish from multiple localities, the phylogenetic distance between individual fish
predicts the similarity of their parasite communities much more strongly than the
geographic distance between them does.
Predictors in model Taxonomic distance Length Km
Taxonomic distance Length
Taxonomic distance
Regression
Residual Total
Regression
Residual Total
Regression
Residual Total
Sum of squares
19427797.537
40999202.691 60427000.227
18853543.844
41573456.383 60427000.227
18790053.199
41636947.029 60427000.227
df 3
247452 247455
2
247453 247455
1
247454 247455
Mean square
6475932.512
165.685
9426771.922
168.005
18790053.199
168.261
F
39085.698
56109.912
111671.824
R2
0.322
0.312
0.311
p *
<0.0005
<0.0005
<0.0005
* P-values indicate the significance of both the model and the change in R'. F and other
statistics refer to the model, not the change in R~.
132

Figure 4.1 Non-metric multi-dimensional scaling (MDS) of parasite infracommunities in 705 fish
from the St. Lawrence River
MDS of Bray-Curtis similarity among infracommunities (untransformed abundance, no
dummy parasite). Both plots are identical, but points are coded according to host species
in (a) and locality in (b). Points that are close together represent parasite communities
that are similar. Stress indicates the degree to which inter-point distances correlate with
similarity rankings. Values less than 0.1 leave little room for misinterpretation; values
less than 0.2 are useful visualizations of relationships, while stress > 0.3 may show
misleading relationships (Clarke 1993). Infracommunities clearly separate into clusters
consistent with host phylogeny, forming groups that correspond to both host species and
family, while geographic clustering is more difficult to discern.
133
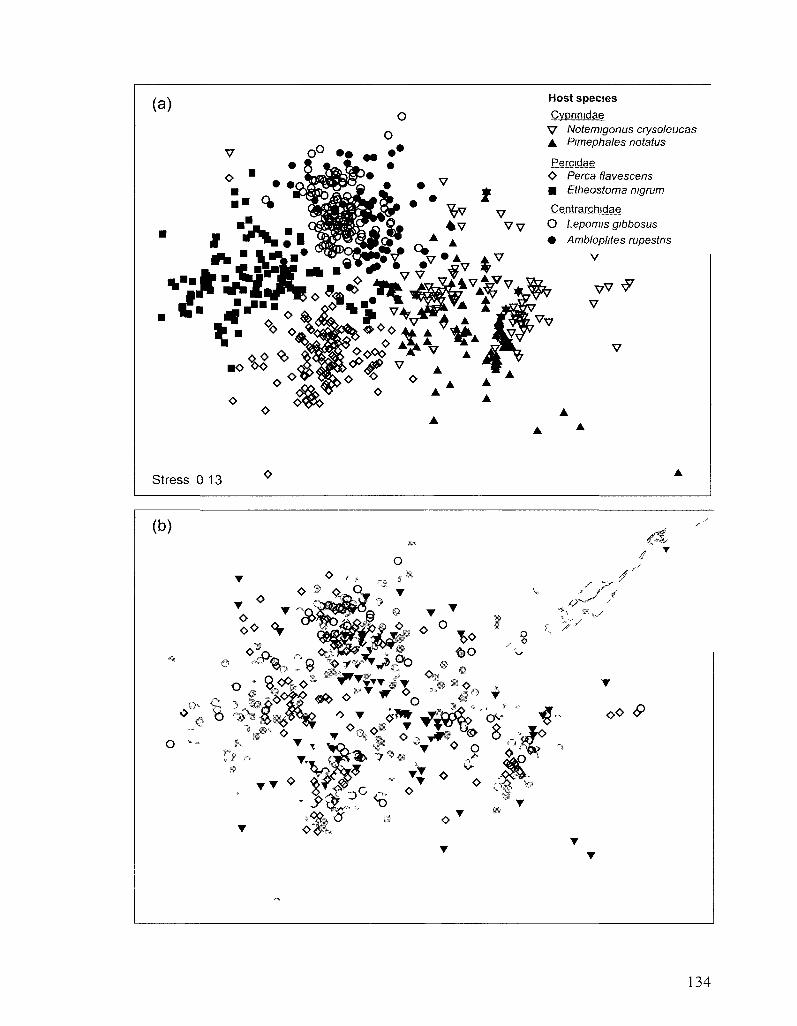
(a) Host species
Cypnnidae V Notemigonus crysoleucas A Pimephales notatus
Percidae <> Perca flavescens • Etheostoma nigrum
Centrarchidae
O Lepomis gibbosus
• Ambloplites rupestns
V
y V \P
Stress 0 13
(b)
„0* £ 3 «*> o w o ,*» •
K • x w ^ jj* •*>_ 0 O
< -
P '
<y
T
oo <P
134
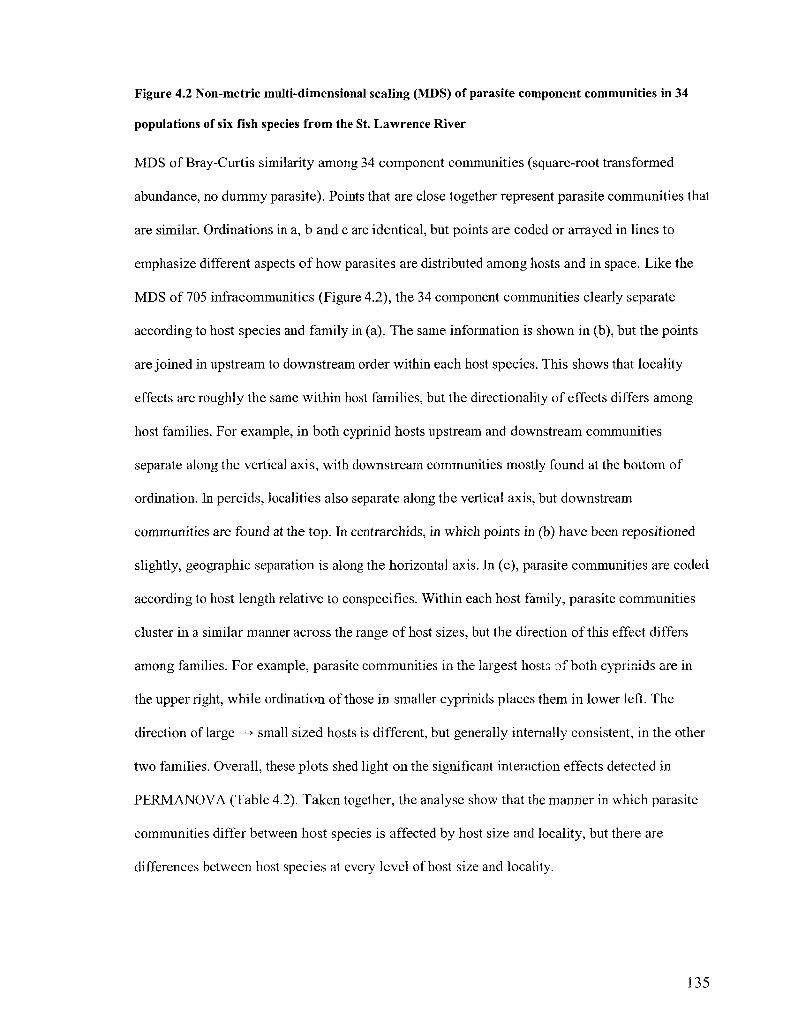
Figure 4.2 Non-metric multi-dimensional scaling (MDS) of parasite component communities in 34
populations of six fish species from the St. Lawrence River
MDS of Bray-Curtis similarity among 34 component communities (square-root transformed
abundance, no dummy parasite). Points that are close together represent parasite communities that
are similar. Ordinations in a, b and c are identical, but points are coded or arrayed in lines to
emphasize different aspects of how parasites are distributed among hosts and in space. Like the
MDS of 705 infracommunities (Figure 4.2), the 34 component communities clearly separate
according to host species and family in (a). The same information is shown in (b), but the points
are joined in upstream to downstream order within each host species. This shows that locality
effects are roughly the same within host families, but the directionality of effects differs among
host families. For example, in both cyprinid hosts upstream and downstream communities
separate along the vertical axis, with downstream communities mostly found at the bottom of
ordination. In percids, localities also separate along the vertical axis, but downstream
communities are found at the top. In centrarchids, in which points in (b) have been repositioned
slightly, geographic separation is along the horizontal axis. In (c), parasite communities are coded
according to host length relative to conspecifics. Within each host family, parasite communities
cluster in a similar manner across the range of host sizes, but the direction of this effect differs
among families. For example, parasite communities in the largest hosts of both cyprinids are in
the upper right, while ordination of those in smaller cyprinids places them in lower left. The
direction of large —> small sized hosts is different, but generally internally consistent, in the other
two families. Overall, these plots shed light on the significant interaction effects detected in
PERMANOVA (Table 4.2). Taken together, the analyse show that the manner in which parasite
communities differ between host species is affected by host size and locality, but there are
differences between host species at every level of host size and locality.
135

Host species Cyprinidae
V Notemigonus crysoleucas A Pimephales notatus
Percidae O Perca flavescens M Etheostoma nigrum
Centrarchidae
(a) Stress: 0.16
2f 6 O
5 O 3
1
2o<>
O Lepomis gibbosus • Amblopiites rupestris
4 1 #*2 3
(b)
3 •
5 ° 6 2 » 3
0 5 * 1 4 O 5 ' 6 0 ^ ° 0
C 1 O
i
_ _
1 i
1 •
(c)
4 •
1 3
^A 4
4 A 3 . V 2 V v V 5
5A V 6
A6 -
D 1
^ / « 1
(separated for clarity)
1 A
1
V
Parasite communities ordered upstream -* downstream within each host species
2 4
o ;
%
V
Size of symbol proportionate to fish length
5 6

1 .00 ->
0.75 -
0.50 -
0.25 - , . i
0.00 \—' ' •—' ' — i — ' ' •—' ' 1 — ' ' — i
Lake Locality Order Family Species
within species within locality
Figure 4.3 Effects of host phylogenetic and spatial categories in analyses of similarity (ANOSIM) in
parasite infracommunities
Global R values from two-way crossed ANOSIMs based on untransformed Bray-Curtis
distances between parasite communities in 705 fish in the Saint Lawrence River, Canada.
The global R values are all significant at P < 0.0005. The magnitude of the R values,
which vary from -1 to 1, corresponds to the degree of partitioning in the
multidimensional cloud of Bray-Curtis resemblances that is attributable to each factor. A
global R value = 1 indicates that every community is, on average, more similar to other
communities in the same grouping factor than it is to members of any other factor.
"Error" bars show the range of pairwise R-values associated with different levels of each
factor. For example, differences among lakes within species range from R = 0.107 (Lake
St. Francois compared to Lake St. Louis) to R = 0.424 (Lake St. Francois compared to
Lake St. Pierre).
137
a: "55 _o U)
CO O
Figure 4.4 Second-stage ordination (2STAGE) of correlations between parasite infracommunity similarity and taxonomic and geographic distance
between individual hosts
Correlations between parasite infracommunity similarity and (a) taxonomic and (b) geographic distance. The height of each column
shows the correlation (p) of these factors with the similarity of parasite communities separated into allogenic/autogenic guilds
(indicated by colors in legend) (2STAGE, Clarke and Gorley 2006). Five transformations to parasite abundance data recur in the same
order (see legend) in a progression from quantitative to qualitative similarity, and a dummy parasite was added to each
infracommunity in columns with a line and "D" underneath, which are subject to the same series of five transformations. The
taxonomic distance between individual hosts correlates more strongly with parasite community similarity than geographic proximity,
regardless of how parasite data are transformed, which guild is under consideration, or whether a dummy parasite is added to
infracommunities.
138

5^
CD
c ZJ
o o £ 'GO
TO co Q.
Q.
C g TO O I— o o
CD C 0
-t—'
C/)
1.0
0.9
0.8
0.7
0.6
0.5
0.4
0.3
0.2
0.1
0.0
Parasite community:
• All
• Allogenic
I ] Autogenic
«
Transformation of parasite abundance:
None
v Square root
© Fourth root © Log(x+1)
I Presence/absence
1 dummy parasite added D to every infracommunity
w\
IIIII.IUI 1® I v &G I - f ^G I i© i >n#G<i ;@ I
D D
(a) Taxonomic distance
v #© I W<H©'I J©'! V'®G'I <^$©'l < '^©# l ' l
D
(b) Geographic distance

Psrcioss Perciformes ______— perca flavescens
i -—— Etheostoma nigrum 1 ' ' —•—•— Lepomis gibbosus
Ambloplites rupestris Actinopterygii • Centrarchidae
Notemigonus crysoleucas Pimephales notatus
Leuciscinae
ro I w w t
o
m
100
80
60
40
20 • 0 1 2 3 4 5 6
Taxonomic distance
Figure 4.5 Effect of taxonomic distance between hosts on parasite infracommunity similarity in 705
fish from six different species and six different localities in the St. Lawrence River
Boxplot of 247 456 Bray-Curtis similarities between parasite communities in 705 fish in
six species from the St. Lawrence River, Canada (based on untransformed abundance of
all parasites, no dummy variable). Lines within boxes represent median values in
similarity, boxes contain the upper and lower quartiles of the distribution, and whiskers
encompass 99% of the distribution. Conspecific fish (taxonomic distance = 0) have the
most similar parasite communities, while more distantly related fish have less similar
parasites. Inset, the tree used to calculate taxonomic distances between all 705 fish.
Taxonomic distance between fish accounts for 31% of the variance in parasite
community similarity (see Table 4.2).

• Al l
• Allogenic
• Autogenic
Figure 4.6 Correlation between geographic distance and parasite infracommunity similarity broken
down by host species and parasite guild
Strength of correlation between parasite community similarity (untransformed abundance,
no dummy variable) and geographic distance (km) in 705 individual fish hosts,
partitioned by parasite guild. Absolute values of correlation coefficients are used; parasite
communities are increasingly dissimilar with increasing distance. In all cases P < 0.0005
(RELATE test, Clarke and Gorley 2006). The effect of distance between localities on
community similarity in different guilds varies in the six hosts species, with no clear
pattern emerging across hosts.
141

Appendix 4.1
Mean abundance of metazoan parasites collected from six species offish at six localities in the St. Lawrence River, QC.
Perca flavescens (Percidae) (n - 137)
Ectoparasites
Monogenea Copepoda Hirudinidae Unidentified Urocleidus adspectus Argulus sp. Ergasilus sp. Unidentified 0.2928 0.02857 0.01429 0.007 0.0786
Endoparasites
Acanthocephala Unidentified cystacanth 0.1071
Nematoda Unidentified larval stage 0.5643
Raphidascarus n , . , Philometra Dichelyne sp. " fhilometra sp.
acus 0.01429 0.1786 0.036
Cestoda Unidentified metacestode 0.064286
Bothriocephalus cuspidatus 0.01
Digenea Apatcmnn Apnphallus Bunodera Azygia Clinnsfomum Cryptogonimus Crepidostomum Diplostomum Diplostomum sp. 2 brevis sacculata angusticauda sp. chili farionis spp. sp. 1 0.0214 10.8571 0.036 0.0714 0.1 0.1000 0.1000 0.3499 0.08571
D. baeri D. huronense
22.04 0.0071
Diplostomum Diplostomum Diplostomum T , , , Ichthyocotylurus sp. Neochasmus « . , Ichthyocotylurus sao. «
sp. 3 sp. 4 sp. 5 3 sp. 0.0143 0.557 0.0071 2.3 0.0071 2.028
Omithodiplostomum sp. 1
0.4286
Posthodiplostomum sp. 7 0.9286
Phyllodistomum superbum 0.1000
Proterometra macrostoma 0.3499
Rhipidocotyle sp.
0.0071
Tylodelphys sp.
0.5857
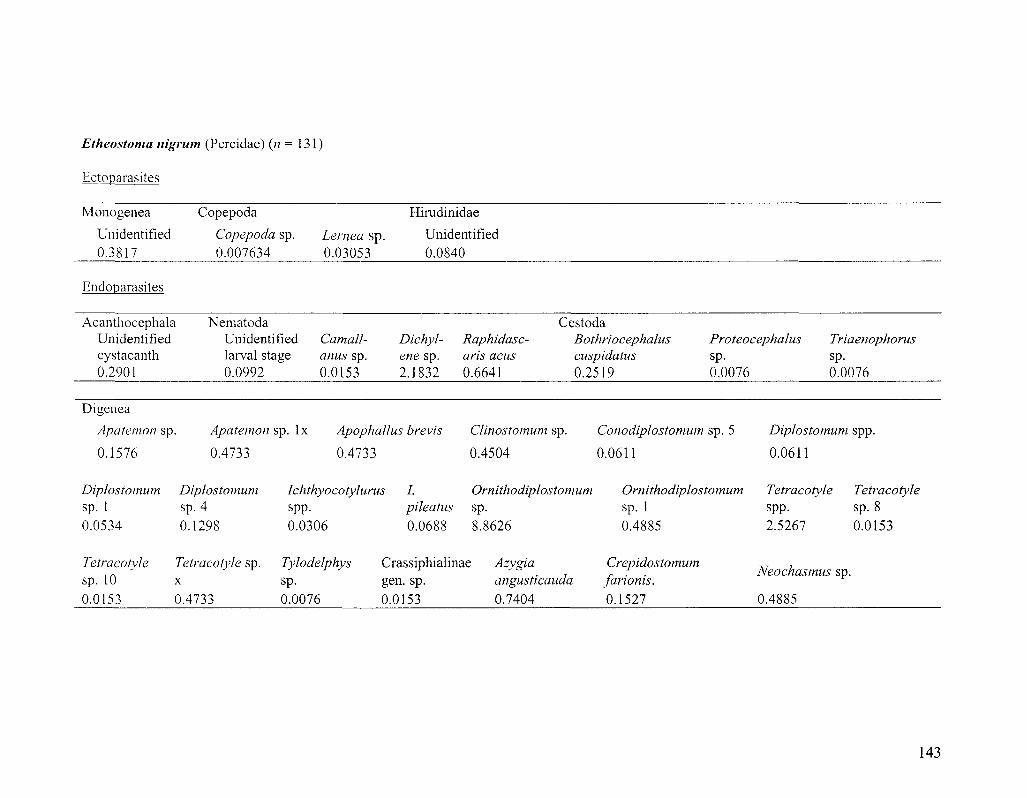
Etheostoma nigrum (Percidae) (n = 131)
Ectoparasites
Monogenea Copepoda
Unidentified Copepoda sp. Lernea sp. 0.3817 0.007634 0.03053
Hirudinidae
Unidentified 0.0840
Endoparasites
Acanthocephala Unidentified cystacanth 0.2901
Nematoda Unidentified Camall-larval stage anus sp. 0.0992 0.0153
Dichyl- Raphidasc-ene sp. arts acus 2.1832 0.6641
Cestoda Bothriocephalus cuspidatus 0.2519
Proteocephalus sp. 0.0076
Triaenophorus sp. 0.0076
Digenea
Apatemon sp.
0.1576
Apatemon sp. lx Apophallus brevis Clinostomum sp.
0.4733 0.4733 0.4504
Conodiplostomum sp. 5
0.0611
Diplostomum spp.
0.0611
Diplostomum Diplostomum Ichthyocotylurus I. Ornithodiplostomum sp. 1 sp. 4 spp. pileatus sp.
0.0534 0.1298 0.0306 0.0688 8.8626
Ornithodiplostomum Tetracotyle Tetracotyle sp. 1 spp. sp. 8
0.4885 2.5267 0.0153
Tetracotyle sp. 10 0.0153
Tetracotyle sp. X
0.4733
Tylodelphys sp. 0.0076
Crassiphialinae gen. sp. 0.0153
Azygia angusticauda 0.7404
Crepidostomum farionis. 0.1527
Neochasmus sp.
0.4885
143
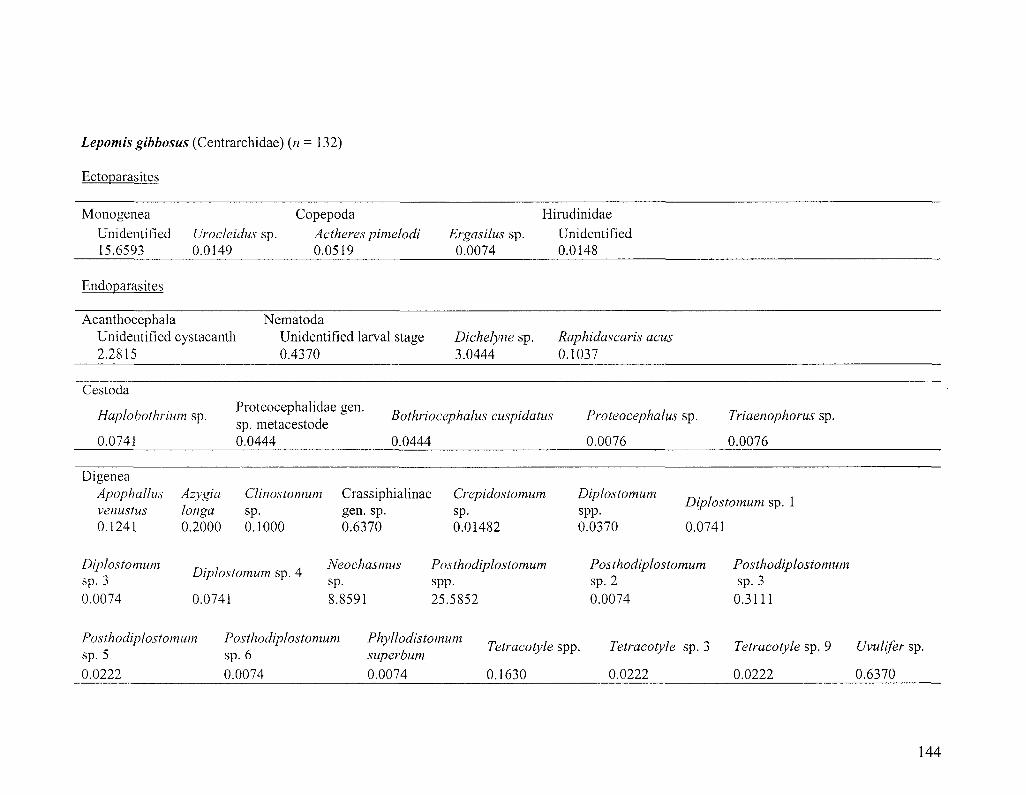
Lepomis gibbosus (Centrarchidae) (n = 132)
Ectoparasites
Monogenea Copepoda Unidentified Urocleidus sp. Adherespimelodi 15.6593 0.0149 0.0519
Hirudinidae Ergasilus sp. Unidentified 0.0074 0.0148
Endoparasites
Acanthocephala Unidentified cystacanth 2.2815
Nematoda Unidentified larval stage 0.4370
Dichefyne sp. Raphidascaris acus 3.0444 0.1037
Cestoda
Haplobothrium sp. , „ , Bothriocephalus cuspidatus Proteocephalus sp. sp. metacestode I
0.0741 0.0444 0.0444 0.0076
Triaenophorus sp.
0.0076
Digenea ApophaUus venustus 0.1241
Diplostomum sp. 3 0.0074
Azygia Clwostomum longa sp. 0.2000 0.1000
Diplostomum sp. 4
0.0741
Crassiphialinae Crepidostomum gen. sp. sp. 0.6370
Neochasmus sp.
8.8591
0.01482
Posthodiplostomum spp.
25.5852
Diplostomum „ . , , Diplostomum sp. 1
spp. 0.0370 0.0741
Posthodiplostomum Posthodiplostomum sp. 2 sp. 3 0.0074 0.3111
Posthodiplostomum Posthodiplostomum Phyllodistomum „ , - , , Tetracotyle spp.
sp. 5 sp. 6 super bum 0.0222 0.0074 0.0074 0.1630
Tetracotyle sp. 3 Tetracotyle sp. 9 Uvulifer sp.
0.0222 0.0222 0.6370
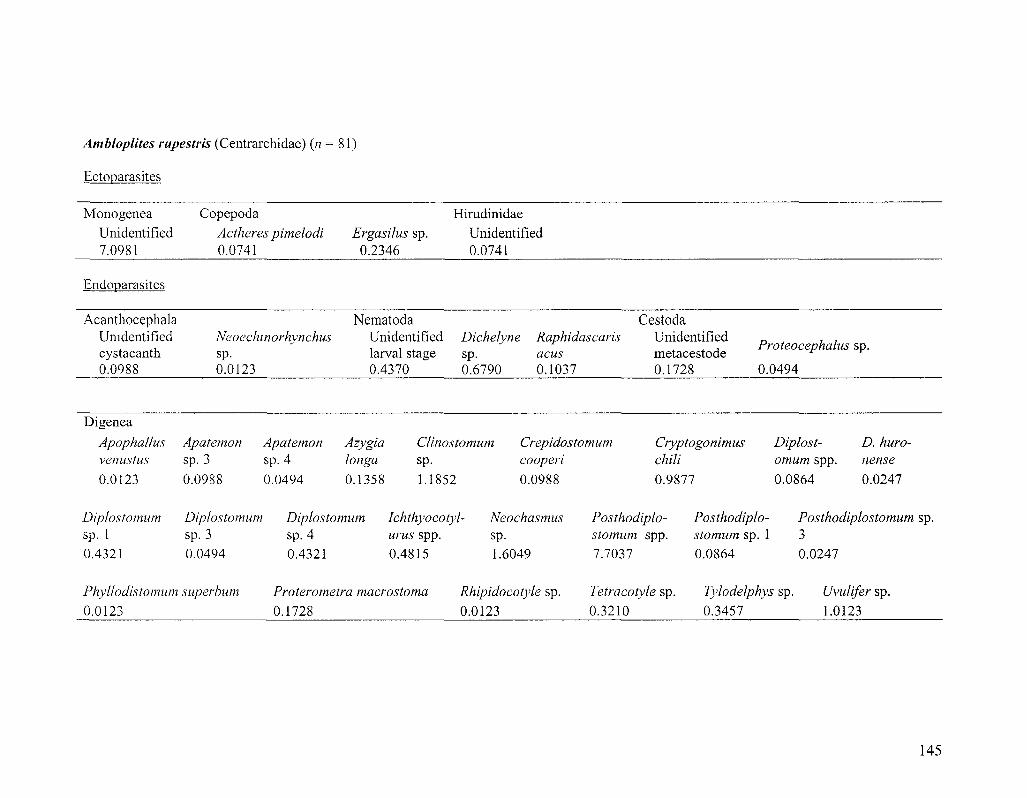
Ambloplites rupestris (Centrarchidae) (n
Ectoparasites
81)
Monogenea Unidentified 7.0981
Copepoda Adheres pimelodi 0.0741
Ergasilus sp. 0.2346
Hirudinidae Unidentified 0.0741
Endoparasites
Acanthocephala Unidentified cystacanth 0.0988
Nematoda Cestoda Neoechmorhynchus Unidentified Dichelyne Raphidascaris Unidentified sp. larval stage sp. acus metacestode 0.0123 0.4370 0.6790 0.1037 0.1728
Proteocephalus sp.
0.0494
Digenea Apophallus Apatemon Apatemon Azygia venustus sp. 3 sp. 4 longa 0.0123 0.0988 0.0494 0.1358
Clinostomum sp. 1.1852
Crepidostomum cooperi 0.0988
Cryptogonimus Diplost- D. huro-chili omum spp. nense 0.9877 0.0864 0.0247
Diplostomum Diplostomum Diplostomum Ichthyocotyl- Neochasmus sp. 1 sp. 3 sp. 4 urus spp. sp. 0.4321 0.0494 0.4321 0.4815 1.6049
Posthodiplo- Posthodiplo- Posthodiplostomum sp. stomum spp. stomum sp. 1 3 7.7037 0.0864 0.0247
Phyllodistomum superbum Proterometra macrostoma Rhipidocotyle sp. 0.0123 0.1728 0.0123
Tetracotyle sp. Tylodelphys sp. Uvulifer sp. 0.3210 0.3457 1.0123
145

Notemigonus crysoleucas (Cyprinidae) (« = 113)
Ectoparasites
Monogenea Copepoda Hirudinidae Unidentified Gyrodactylus sp. Urocleidus sp. Adherespimelodi Ergasilus sp. Unidentified 0.0442 0.0177 0.0442 0.0741 0.0177 0.0089
Endoparasites
Acanthocephala Unidentified cystacanth 0.0089
Neoechinorhynchus rutili 0.0123
Nematoda Unidentified larval stage 0.0619
Raphidascaris acus 0.0177
Cestoda Pliovitellaria sp. 0.0354
Digenea Apatemon sp. 1 0.0089
Apophallus brevis 0.1150
Azygia angusticauda 0.0177
Centrovarium lobotes 0.0442
Clinostomum sp. 0.0089
Crassiphialinae gen. sp. 0.0177
Diplostomum spp,
5.1681
D. huronense Diplostomum sp. 1 Diplostomum sp. 3 Diplostomum sp. 4 Hysteromorpha triloba Neochasmus sp. 0.1150 0.2124 0.0530 0.0177 0.7612 0.7611
Neochasmus sp. Ornithodiplostomum spp. Plagioporus sp. Posthodiplostomum sp. Tetracotyle sp. 6 0.7611 3.3800 0.5664 0.0177 0.0354
146
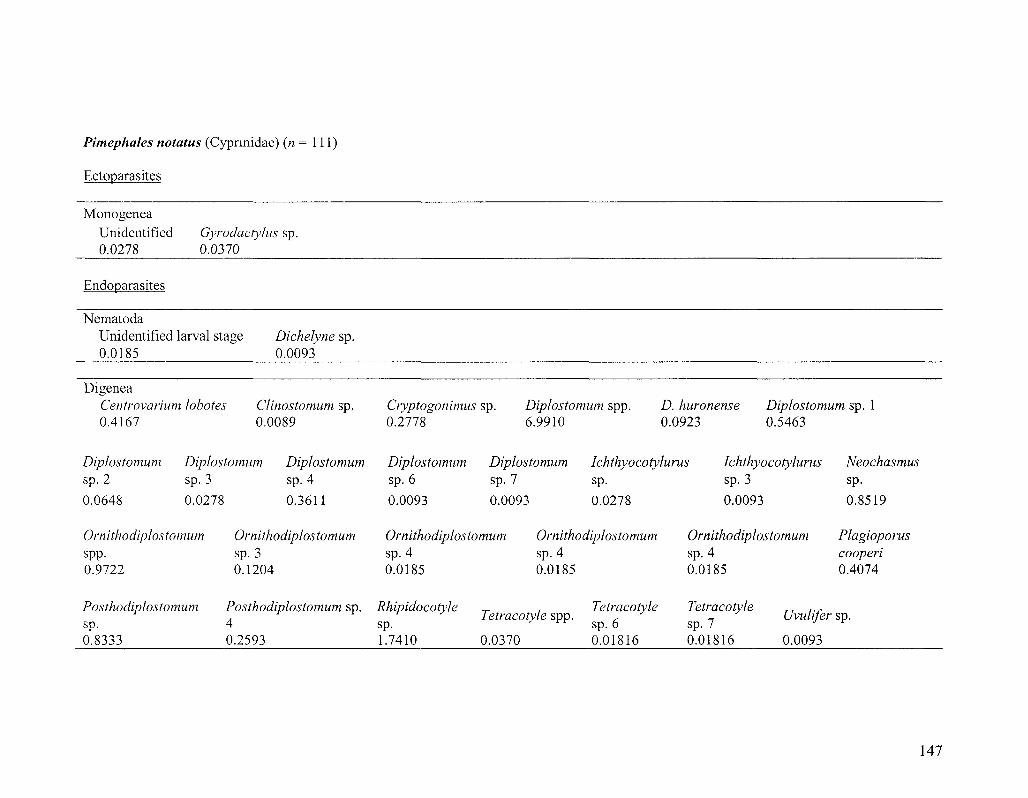
Pimephales notatus (Cypnnidae) (n = 111)
Ectoparasites
Monogenea Unidentified 0.0278
Gyrodactylus sp. 0.0370
Endoparasites
Nematoda Unidentified larval stage Dichelyne sp. 0.0185 0.0093
Digenea Centrovarium lobotes Clinostomum sp. 0.4167 0.0089
Cryptogonimus sp. 0.2778
Diplostomum spp. 6.9910
D. huronense 0.0923
Diplostomum sp. 1 0.5463
Diplostomum Diplostomum Diplostomum Diplostomum Diplostomum Ichthyocotylurus sp. 2 sp. 3 sp. 4 sp. 6 sp. 7 sp.
0.0648 0.0278 0.3611 0.0093 0.0093 0.0278
Ichthyocotylurus Neochasmus sp. 3 sp.
0.0093 0.8519
Omithodiplostomum spp. 0.9722
Omithodiplostomum Omithodiplostomum Omithodiplostomum Omithodiplostomum Plagioporus sp. 3 sp. 4 sp. 4 sp. 4 cooperi 0.1204 0.0185 0.0185 0.0185 0.4074
Posthodiplostomum Posthodiplostomum sp. Rhipidocotyle sp. 4 0.8333 0.2593
sp. 1.7410
Tetracotyle spp.
0.0370
Tetracotyle Tetracotyle sp. 6 sp. 7 0.01816 0.01816
Uvulifer sp.
0.0093
147

General conclusions
Parasites are difficult to identify to the species level using morphology, and this
poses a problem in studies of parasite community and evolutionary ecology. Larval
stages are particularly problematic in this regard. For example, it is virtually impossible
to discriminate among congeneric species of strigeid metacercariae, which are common
pathogens in fish from the St. Lawrence River and around the world (Szidat 1969; Lemly
and Esch 1984; Chappell 1995; Gibson 1996; Sandland and Goater 2001; Overstreet and
Curran 2004; Marcogliese et al. 2006).
In Chapter 1 of this thesis, two sets of novel primers were presented that can be
used to sequence the barcode region of the mitochondrial cytochrome c oxidase I (COI)
gene (Moszczynska et al. 2009). COI sequences were used to discriminate species in a
large sample of strigeid metacercariae from fish in the St. Lawrence River (Locke et al.
2009; Chapter 3). Chapters 2 and 3 presented data showing that these mitochondrial
markers resolve strigeid species more clearly than more commonly used internal
transcribed spacer (ITS) regions between nuclear genes encoding ribosomal subunits,
even though the amount of COI variation was higher than expected within a small
number of species. In most cases, species indicated by molecular data were specific to
certain tissues of a small number of closely related fish species, which constituted a
separate line of evidence that these species boundaries were accurate. Both markers
revealed a nearly fourfold increase in the number strigeid species known from Canadian
fishes. This is remarkable because only a small number offish were surveyed in part of a
single river, and the parasites of Canada's freshwater fishes are among the most well
148

studied in the world (Margolis and Arthur 1979; Gibson 1996; McDonald and Margolis
1995; Poulin 2010).
Sequence data presented in Chapters 2 and 3 showed that most strigeid
metacercariae are highly host specific, with the exception of species inhabiting the lens of
the eye. The diversity and host specificity of strigeid metacercariae described here
contrast markedly with the previous conception that strigeid metacercariae consist of a
few species capable of infecting diverse fish taxa (Gibson 1996; Hoffman 1999). The
limited immune response in the lens is a likely explanation for significantly lower host
specificity in strigeid species inhabiting this site. The strigeid species with metacercariae
that inhabit other tissues showed consistently higher host specificity across separate and
ecologically distinctive fish communities. The distribution of some strigeid species was
constrained by the phylogenetic affinity rather than the ecological convergence of their
fish host species. Overall, these findings suggest that physiologic interactions between
host and parasite are more important than ecological factors in determining host
specificity in strigeid metacercariae.
The host specificity of larval strigeids had important effects on parasite
communities as a whole. Closely related host species had significantly more similar
parasite communities. This effect was much stronger than the tendency of parasite
communities in spatially proximate fish to be similar, which is emerging as one of the
few truly general features of parasite communities (Poulin and Morand 1999; Poulin
2003; Karvonen and Valtonen 2004; Fellis and Esch 2005a, b; Karvonen et al. 2005a;
Vinarski et al. 2007; Seifertova et al. 2008: Perez-del-Olmo et al. 2009; Timi et al. 2009).
The effect of spatial proximity on parasite community similarity was pronounced only if
149
comparisons were limited to fish of the same species. Categories relating to host
phylogeny were much more predictive of parasite community attributes than spatial
categories. Since spatial categories are a reasonable surrogate for habitat variation, this
suggests that, in comparison with host phylogeny, habitat has a minor role in determining
parasite community composition and structure.
150

References
Adamson ML, Caira JN. 1994. Evolutionary factors influencing the nature of parasite
specificity. Parasitology 109, S85-S95
Anderson MJ. 2001. A new method for non-parametric multivariate analysis of variance.
Austral Ecology 26, 32-46
Anderson MJ, Willis TJ. 2003. Canonical analysis of principal coordinates: a useful
method of constrained ordination for ecology. Ecology 84: 511-525
Arai HP. 1989. Acanthocephala in Margolis L and Kabata Z, eds. Guide to the Parasites
of Fishes of Canada. Canadian Special Publication of Fisheries and Aquatic
Sciences 107
Avise JC. 1994. Molecular Markers, Natural History and Evolution. Chapman and Hall,
London.
Bell AS, Sommerville S. 2002. Molecular evidence for the synonymy of two species of
Apatemon Szidat, 1928, A gracilis (Rudolphi, 1819) and .4. annuligemm (von
Nordmann, 1832) parasitic as metacercariae in British fishes. Journal of
Helminthology 76, 193-198
Bell AS, Sommerville S, Valtonen ET. 2001. A molecular phylogeny of the genus
Ichthyocotylurus (Digenea, Strigeidae). International Journal for Parasitology 31,
833-842
Benesh DP, Hasu T, Suomalainen LR, Valtonen ET, Tiirola M. 2006. Reliability of
mitochondrial DNA in an acanthocephalan: the problem of pseudogenes.
International Journal for Parasitology 36, 247-254
151
Bergeron M, Marcogliese DJ, Magnan P. 1997. The parasite fauna of brook trout
Salvelinus fontinalis (Mitchill) in relation to lake morphometries and the
introduction of creek chub Semotilus atromaculatus (Mitchill). Ecoscience 4, 427-
436
Beverly-Burton M. 1984. Monogenea and Turbellaria in Margolis L and Kabata Z, eds.
Guide to the Parasites of Fishes of Canada. Canadian Special Publication of
Fisheries and Aquatic Sciences 74
Bortolus A. 2008. Error cascades in the biological sciences: the unwanted consequences
of using bad taxonomy in ecology. Ambio 37, 114-118
Bowles J, Blair D, McManus DP. 1995. A molecular phylogeny of the human
schistosomes. Molecular Phylogenetics and Evolution 4, 103-109
Blair D. 2006. Ribosomal DNA variation in parasitic flatworms in Maule AG, Marks NJ
eds) Parasitic Flatworms: Molecular Biology, Biochemistry, Immunology and
Control. CABI Publishing, Wallingford, UK pp. 96-123
Blankespoor HD. 1974. Host-induced variations in Plagiorchis noblei Park, 1936
(Plagiorchiidae: Trematoda). The American Midland Naturalist 92, 415-433
Brassard P, Rau ME, Curtis MA. 1982. Parasite induced susceptibility to predation in
diplostomiaisis. Parasitology 85, 495-501
Chappell LH. 1995. The biology of diplostomatid eye flukes of fishes. Journal of
Helminthology 69, 97-101
Chappell LH, Hardie LJ, Secombes CJ. 1994. Diplostomiaisis: the disease and host-
parasite interactions. In: Pike AW, Lewis JW. (Eds.), Parasitic Diseases of Fish.
Samara Publishing, Tresaith, UK pp. 59-86
152
Clarke KR. 1993. Non-parametric multivariate analysis of changes in community
structure. Australian Journal ofEcology 18, 117-143
Clarke KR, Gorely RN. 2006. PRIMER V6: User Manual/Tutorial. Primer-E, Plymouth,
UK
Clarke KR, Somerfeld PJ, Chapman MG. 2006. On resemblance measures for ecological
studies, including taxonomic dissimilarities and a zero-adjusted Bray-Curtis
coefficient for denuded assemblages. Journal of Experimental Marine Biology
and Ecology 330, 55-80
Combes C. 2001. Parasitism: the Ecology and Evolution of Intimate Interactions.
University of Chicago Press, Chicago, USA
Combes C. 2005. The Art of Being a Parasite. University of Chicago Press, Chicago,
USA
Criscione CD, Poulin R. Blouin, MS. 2005. Molecular ecology of parasites: Elucidating
ecological and microevolutionary processes. Molecular Ecology 14, 2247-2257
CSL (Centre Saint-Laurent). 1996. Rapport-synthese sur I'etat du Saint-Laurent. Volume
1: L 'ecosysteme du Saint-Laurent. Environnement Canada-region du Quebec,
Conservation de 1'Environnement. Editions Multimondes, Montreal, Canada
Cywinska A, Hunter FF, Hebert PDN. 2006. Identifying Canadian mosquito species
through DNA barcodes. Medical and Veterinaiy Entomology 20, 413-424
Desalle R, Egan MG, Siddall M. 2005. The unholy trinity: taxonomy, species
delimitation and DNA barcoding. Philosophical Transactions of the Royal Society
of London B: Biological Sciences 360, 1905-1916
153
de Meeus T. 2000. Adaptive diversity, specialisation, habitat preference and parasites in
Poulin R, Morand S, Skorping A, eds. Evolutionary Biology of Host-Parasite
Relationships: Theory Meets Reality Elsevier Science, Amsterdam NED pp. 27-
42.
Dezfuli BS, Giari L, Shinn AP. 2007. The role of rodlet cells in the inflammatory
response in Phoxinus phoxinus brains infected with Diplostomum. Fish and
Shellfish Immunology 23, 300-304
Dogiel VA, Polyanski YI and Kheisin EM. 1966. General Parasitology. Academic Press,
New York and London
Dove AD, Cribb TH. 2006. Species accumulation curves and their applications in
parasite ecology. Trends in Parasitology 22, 568-574
Dumont P. 1996. Comparaison de la Dynamique des Populations de Perchaudes (Perca
flavescens) Soumises a des Niveaux Differents de Stress Anthropique. Ministere
de l'Environnement et de la Faune, Service de l'amenagement et de l'exploitation
de la Faune, Rapport technique 06-46, Montreal, Canada
Dzikowski R, Levy M, Poore MF, Flowers JR, Paperna I. 2003. Genetic and morphologic
differentiation ofBolbophoms confusus and B. levantinus (Digenea:
Diplostomatidae), based on rDNA SSU polymorphism and SEM. Diseases of
Aquatic Organisms 57, 231-235
Elsasser SC, Floyd R, Hebert, PDN, Schulte-Hostedde AI. 2009. Species identification of
North American guinea worms (Nematoda: Dracunculus) with DNA barcoding.
Molecular Ecology Resources 9, 707-712
154
Faulkner M. 1989. The application of sodium dodecyl sulphate-polyacramide gel
electrophoresis to the taxonomic identification of the total body protein band
profiles of Diplostomum spp. metacercariae (Digenea), parasites of fish eyes.
Electrophoresis 10,260-264
Fellis JK, Esch GW. 2005a. Autogenic-allogenic status affects interpond community
similarity and species area relationship of macroparasites in the bluegill sunfish,
Lepomis macrochirus, from a series of freshwater ponds in the Piedmont area of
North Carolina. Journal of Parasitology 91, 764-767
Fellis JK, Esch GW 2005b. Variation in life cycle affects the distance decay of similarity
among bluegill sunfish parasite communities. Journal of Parasitology 91, 1484-
1486
Ferri E, Barbuto M, Bain O, Galimberti A, Uni S, Guerrero R, Ferte H, Bandi C, Martin
C, Casiraghi M. 2009. Integrated taxonomy: traditional approach and DNA
barcoding for the identification of filarioid worms and related parasites
(Nematoda). Frontiers in Zoology 6, 1.
Folmer O, Black M, Hoeh W, Lutz R, Vrijenhoek R. 1994. DNA primers for
amplification of cytochrome c oxidase subunit I from diverse metazoan
invertebrates. Molecular Marine Biology and Biotechnology 3, 294-299
Frezal L, Leblois R. 2008. Four years of DNA barcoding: current advances and prospects.
Infection, Genetics and Evolution 8, 721-136
Galazzo DE, Dayanandan S, Marcogliese DJ, McLaughlin JD. 2002. Molecular
systematics of some North American species of Diplostomum (Digenea) based on
155
rDNA-sequence data and comparisons with European congeners. Canadian
Journal of Zoology 30, 2207-2217
Gibson DI. 1996. Trematoda in Margolis L and Kabata Z, eds. Guide to the Parasites of
Fishes of Canada. Canadian Special Publication of Fisheries Aquatic Sciences
124
Goater CP, Baldwin RE, Scrimgeour GJ. 2005. Physico-chemical determinants of
helminth component community structure in whitefish (Coregonus clupeaformes)
from adjacent lakes in Northern Alberta, Canada. Parasitology 131, 713-722
Graczyk T. 1991. Variability of metacercariae of Diplostomum spathaceum (Rudolphi,
1819). (Trematoda, Diplostomidae). Acta Parasitologica 36, 135-139
Hajibabaei M, Singer GAC, Hickey DA. 2006. Benchmarking DNA barcodes: an
assessment using available primate sequences. Genome 49, 851-854
Hansen H, Bakke TA, Bachmann L. 2007. DNA taxonomy and barcoding of
monogenean parasites: lessons from Gyrodactylus. Trends in Parasitology 23,
363-367
Hebert PDN, Cywinska A, Ball SL, deWaard JR. 2003a. Biological identifications
through DNA barcodes. Proceedings of the Royal Society of London B 270, 313-
321
Hebert PDN, Ratnasingham S, deWaard JR. 2003b. Barcoding animal life: cytochrome c
oxidase 1 divergences among closely related species. Philosophical Transactions
of the Royal Society of London B: Biological Sciences 270, S596-S599.
Hebert PDN, Stoeckle MY, Zemlak TS, Francis CM. 2004. Identification of birds
through DNA barcodes. Public Library of Science Biology, 2, e312
156

Hickerson MJ, Meyer CP, Moritz C 2006. DNA barcoding will often fail to discover new
animal species over broad parameter space. Systematic Biology 55, 729-739
Hillis DM, Dixon MT. 1991. Ribosomal DNA: molecular evolution and phylogenetic
inference. Quarterly Review of Biology 66, 411-426
Hoffman GL. 1999. Parasites of North American Freshwater Fishes, 2nd edn. Cornell
University Press, Ithaca USA
Hong S-T, Shoop WL. 1994. Neodiplostomum seoulensis N. Comb. (Trematoda:
Neodiplostomidae). Journal of Parasitology 80, 660-663
Hurst GD, Jiggins FM. 2005. Problems with mitochondrial DNA as a marker in
population, phylogeographic and phylogenetic studies: the effects of inherited
symbionts. Proceedings of the Royal Society of London, Series B 272, 1525-1534
Irwin DE. 2002. Phylogeographic breaks without geographic barriers to gene flow.
Evolution, 56, 2383-2394
Ivanova NV, deWaard JR, Hebert PDN. 2006. An inexpensive automation-friendly
protocol for recovering high-quality DNA. Molecular Ecology Notes 6, 998-1002
Ivanova N, Zemlak S, Hanner RH, Hebert PDN. 2007. Universal primer cocktails for fish
DNA barcoding. Molecular Ecology Notes 7, 544-548
Johnson JB, Peat SM, Adams BJ. 2009. Where's the ecology in molecular ecology?
OikosU8, 1601-1609
Jousson O, Bartoli P, Pawlowski J. 2000. Cryptic speciation among intestinal parasites
(Trematoda: Digenea) infecting sympatric host fishes (Sparidae). Journal of
Evolutionary Biology 13, 778-785
157

Kabata Z. 1988. Copepoda and Branchiura in Margolis L and Kabata Z, eds. Guide to the
Parasites of Fishes of Canada. Canadian Special Publication of Fisheries and
Aquatic Sciences 101
Karvonen A, Valtonen ET. 2004. Helminth assemblages of whitefish (Coregonus
lavaretus) in interconnected lakes: similarity as a function of species specific
parasites and geographical separation. Journal of Parasitology 90, 471-476
Karvonen A, Hudson PJ, Seppala O, Valtonen ET. 2004a. Transmission dynamics of a
trematode parasite: exposure, acquired resistance and parasite aggregation.
Parasitology Research 94, 183-188
Karvonen A, Seppala O, Valtonen ET. 2004b. Parasite resistance and avoidance
behaviour in preventing eye fluke infection in fish. Parasitology 129, 159-164
Karvonen A, Cheng GH, Valtonen ET. 2005a. Within-lake dynamics in the similarity of
parasite assemblages of perch (Perca fluviatilis). Parasitology 131, 817-823
Karvonen A, Paukku S, Seppala O, Valtonen ET. 2005b. Resistance against eye flukes:
naive versus previously infected fish. Parasitology Research 91, 55-59
Kennedy CR. 2009. The ecology of parasites of freshwater fishes: the search for patterns.
Parasitology 136, 1653-1662
Kimura M. 1980. A simple method for estimating evolutionary rate of base substitutions
through comparative studies of nucleotide sequences. Journal of Molecular
Evolution 16, 111-120
Kreider T, Anthony RM, Urban Jr JF, Gause WC. 2007. Alternatively activated
macrophages in helminth infections. Current Opinion in Immunology 19, 448-453
158
Kumar S, Tamura K, Nei M. 2004. MEGA3: Integrated software for molecular
evolutionary genetics analysis and sequence alignment. Briefings in
Bioinformatics 5, 150-163
Kunz W. 2002. When is a parasite species a species? Trends in Parasitology 18, 121-124
Kuo CH, Avise J. 2005. Phylogeographic breaks in low-dispersal species: the emergence
of concordance across gene trees. Genetica 124, 179-186
Laskowski Z. 1996. Species identification of Diplostomum pseudospathaceum
Niewiadomska, 1984 and D. paracaudum (lies, 1959) metacercariae using DNA
polymorphism amplified by arbitrary primers. Acta Parasitologica 4, 26-29
Leclerc E, Mailhot Y, Mingelbier M, Bernatchez L. 2008. The landscape genetics of
yellow perch {Perca flavescens) in a large fluvial ecosystem. Molecular Ecology
17, 1702-1717
Lemly AD, Esch GW. 1984. Effects of the trematode Uvulifer ambloplitis on juvenile
bluegill sunfish, Lepomis machrochirus: ecological implications. Journal of
Parasitology 70, 475-492
Leong TS, Holmes JC. 1981. Communities of metazoan parasites in open water fishes of
Cold Lake, Alberta. Journal of Fish Biology 18, 693-713
Lester RJG, Huizinga, HW. 1977. Diplostomum adamsi sp. n.: description, life cycle, and
pathogenesis in the retina ofPerca flavescens. Canadian Journal of Zoology 55,
64-73
Levy M, Flowers GJR, Poore MF, Mullen, JE, Khoo H, Paperna I, Dzikowski R, Litaker
W. 2002. Morphologic, pathologic, and genetic investigations of Bolbophorus
159
species affecting cultured channel catfish in the Mississippi Delta. Journal of
Aquatic Animal Health 14,235-246
Littlewood DTJ, Waeschenbach W, Nikolov PN. 2008. In search of mitochondrial
markers for resolving the phylogeny of cyclophyllidean tapeworms
(Platyhelminfhes Cestoda) - a test study with Davaineidae. Acta Parasitologica
53,133-144
Locke SA, McLaughlin JD, Dayanandan S, Marcogliese DJ. 2009. Diversity and
specificity in Diplostomum spp. metacercariae in freshwater fishes revealed by
cytochrome c oxidase I and internal transcribed spacer sequences. International
Journal for Parasitology, online early, doi: 10.1016/j.ijpara.2009.08.012
Marcogliese DJ, Compagna S. 1999. Diplostomatid eye flukes in young-of-the-year and
forage fishes in the St. Lawrence River, Quebec. Journal of Aquatic Animal
Health 11,275-282
Marcogliese DJ. Compagna S, Bergeron E, McLaughlin JD. 2001a. Population biology of
eyeflukes in fish from a large fluvial ecosystem: the importance of gulls and habitat
characteristics. Canadian Journal of Zoology 79, 1102-1113
Marcogliese DJ, Dumont P, Gendron AD, Mailhot Y, Bergeron E, McLaughlin JD. 2001b.
Spatial and temporal variation in Diplostomum spp. in walleye (Stizostedion
vHreurri) and white suckers (Catostomus commersoni) from the St. Lawrence River.
• madian Journal of Zoology 79, 355-369
Marcog cse DJ, Gendron AD, Plante C, Fournier M, Cyr D. 2006. Parasites of spottail
tuners {Notropis hudsonius) in the St. Lawrence River: effects of municipal
•'fiuents and habitat. Canadian Journal of Zoology 84, 1461-1481
160

Margolis L, Arthur JR. 1979. Synopsis of the Parasites of Fishes of Canada. Bulletin of
the Fisheries Research Board of Canada 199
Mariaux J. 1998. A molecular phylogeny of the Eucestoda. Journal of Parasitology 84,
114-124
McDonald TE, Margolis L. 1995. Synopsis of the parasites of fishes of Canada:
Supplement (1978-1993). Canadian Special Publication of Fisheries and Aquatic
Sciences 122
Medlin L, Elwood HJ, Stickel S, Sogin ML. 1988. The characterization of enzymatically
amplified eukaryotic 16S-like rRNA-coding regions. Gene 71, 491-499
Meeusen EMT, Balic A. 2000. Do eosinophils have a role in the killing of helminth
parasites? Parasitology Today 16, 95-101
Meusnier I, Singer GAC, Landry JF, Hickey DA, Hebert PDN, Hajibabaei M. 2008. A
universal DNA mini-barcode for biodiversity analysis. BMC Genomics 9,
doi:10.1186/1471-2164-9-214
Miura O, Kuris AM, Torchin ME, Hechinger RF, Dunham EJ, Chiba S. 2005. Molecular-
genetic analyses reveal cryptic species of trematodes in the intertidal gastropod,
Batillaria cumingi (Crosse). International Journal for Parasitology 35, 793-801
Miura O, Torchin ME, Kuris AM, Hechinger RF, Chiba S. 2006. Introduced cryptic
species of parasites exhibit different invasion pathways. Proceedings of the
National Academy of Sciences 103, 19818-19823
Morgan JA, Blair D. 1998. Relative merits of nuclear ribosomal internal transcribed
spacers and mitochondrial COl and ND1 genes for distinguishing among
Echinostoma species (Trematoda). Parasitology 116, 289-297
161
Morgan JA, Dejong RJ, Adeoye GO, et al. 2005. Origin and diversification of the human
parasite Schistosoma mansoni. Molecular Ecology 14, 3889-3902
Moszczynska A, Locke SA, McLaughlin JD, Marcogliese DJ, Crease TJ. 2009.
Development of primers for the mitochondrial cytochrome c oxidase I gene in
digenetic trematodes illustrates the challenge of barcoding parasitic helminths.
Molecular Ecology Resources 9, 75-82
Nei M, Kumar S. 2000. Molecular Evolution and Phylogenetics. Oxford University Press,
New York
Nelson J. 2006. Fishes of the World, 4th edn. John Wiley and Sons, Hoboken, USA
Niewiadomska K. 1996. The genus Diplostomum — taxonomy, morphology and biology.
Acta Parasitologica 41, 55-66
Niewiadomska K. 2002. Superfamily Diplostomoidea in Gibson DI, Jones A, Bray RA,
eds. Keys to the Trematoda, Volume ICABI Publishing, Wallingford, UK pp.
159-242
Niewiadomska K, Laskowski Z. 2002. Systematic relationships among six species of
Diplostomum Nordmarm, 1832 (Digenea) based on morphological and molecular
data. Acta Parasitologica 47, 20-28
Niewiadomska K, Szymahski S. 1991. Host-induced variability of Diplostomum
paracaudum (lies, 1959) metacercariae (Digenea). Acta Parasitologica Polonica
36, 11-17
Noble ER, Noble GA, Schad GA Maclnnes AJ. 1989. Parasitology: The Biology of
Animal Parasites, 6th edn. Lea and Febiger, Philadelphia, USA
162
Nolan MJ, Cribb TH. 2005. The use and implications of ribosomal DNA sequencing for
the discrimination of digenean species. Advances in Parasitology 60, 102-163
Olson PD, Tkach VV. 2005. Advances and trends in the molecular systematics of the
parasitic Platyhelminthes. Advances in Parasitology 60, 165-242
Olson PD, Cribb TH, Tkach VV, Bray RA, Littlewood DTJ. 2003. Phylogeny and
classification of the Digenea (Platyhelminthes: Trematoda). InternationalJournal
for Parasitology 33, 733-755
Overstreet RM, Curran SS. 2004. Defeating diplostomoid dangers in USA catfish
aquaculture. Folia Parasitologica 51, 153-165
Overstreet RM Curran SS, Pote LM, King DT, Blend CK, Grater WD. 2002.
Bolbophorus damnificus n. sp. (Digenea: Bolbophoridae) from the channel catfish
Ictaluruspunctatus and American white pelican Pelecanus erythrorhynchos in the
USA based on life-cycle and molecular data. Systematic Parasitology 52, 81-96
Pagel MD. 1994. Detecting correlated evolution on phylogenies: a general method for the
comparative analysis of discrete characters. Proceedings of the Royal Society of
London B 255, 37-45
Park JK, Kim KH, Kang S, Kim W, Eom KS, Littlewood DTJ. 2007. A common origin
of complex life cycles in parasitic flatworms: evidence from the complete
mitochondrial genome of Microcotyle sebastis (Monogenea: Platyhelminthes).
BMC Evolutionary Biology 7, doklO.l 186/1471-2148-7-11
Perez-del-Olmo A, Fernandez M, Raga JA, Kostadinova A, Morand S. 2009. Not
everything is everywhere: similarity-decay relationship in a marine host-parasite
system. Journal of Biogeography 36, 200-209
163
Perez-Ponce de Leon GP. 1995. Host-induced morphological variability in adult
Posthodiplostomum minimum (Digenea: Neodiplostomidae). Journal of
Parasitology 81, 818-820
Poulin R. 1995. Phylogeny, Ecology, and the Richness of Parasite Communities in
Vertebrates. Ecological Monographs 65, 283-302
Poulin R. 2003. The decay of similarity with geographical distance in parasite
communities of vertebrate hosts. Journal of Biogeography 30, 1609-1615
Poulin R. 2005. Relative infection levels and taxonomic distances among the host species
used by a parasite: insights into parasite specialization. Parasitology 130, 109-115
Poulin R. 2007a. Are there general laws in parasite ecology? Parasitology 134, 763-776
Poulin R. 2007b. Evolutionary Ecology of Parasites, 2nd edn. Princeton University Press,
Princeton, USA
Poulin R. 2010. Decay of similarity with host phylogenetic distance in parasite faunas.
Parasitology, online early
Poulin R, Keeney DB. 2007. Host specificity under molecular and experimental scrutiny.
Trends in Parasitology 24, 24-28
Poulin R, Morand S. 1999. Geographical distances and the similarity among parasite
communities of conspecifics host populations. Parasitology 119, 369-374
Poulin R, Morand S. 2004. Parasite Biodiversity. Smithsonian Books, Washington, USA
Poulin R, Mouillot D. 2003. Parasite specialization from a phylogenetic perspective: a
new index of host specificity. Parasitology 126, 473-480
Poulin R, Mouillot D. 2005a. Combining phylogenetic and ecological information into a
new index of host specificity. Journal of Parasitology 91,511-514
164
Poulin R, Mouillot D. 2005b. Host specificity and the probability of discovering helminth
parasites. Parasitology 130, 709-715
Rauch G, Kalbe B, Reusch TBH. 2005. How a complex life cycle can improve a
parasite's sex life. Journal of Evolutionary Biology 18, 1069-1075
Rauch G, Kalbe B, Reusch TBH. 2006. One day is enough: rapid and specific host-
parasite interactions in a stickleback-trematode system. Biology Letters 2, 382-
384
Rauch G, Kalbe B, Reusch TBH. 2008. Partitioning average competition and extreme-
genotype effects in genetically diverse infections. Oikos 117, 399-405
Reite OB, Evenson O. 2006. Inflammatory cells of teleostean fish: a review focusing on
mast cells/eosinophilic granule cells and rodlet cells. Fish and Shellfish
Immunology 20, 192-208
Rintamaki-Kinnunen P, Karvonen A, Anttila P, Valtonen ET. 2004. Diplostomum
spathaceum metacercarial infection and color change in salmonid fish.
Parasitology Research 93, 51-55
Roberts LS Janovy J. 2000.Gerald D. Schmidt & Larry S. Roberts' Foundations of
Parasitology, 6th edn. McGraw Hill, Boston, USA
Sambrook J, Russell DW. 2001. Molecular Cloning: A Laboratory Manual. Cold Spring
Harbor Press, New York, USA
Sandland GJ, Goater CP. 2001. Parasite-induced variation in host morphology: brain-
encysting trematodes in fathead minnows. Journal of Parasitology 87, 267-272
165
Saunders GW. 2008. A DNA barcode examination of the red algal family Dumontiaceae
in Canadian waters reveals substantial cryptic species diversity. 1. The foliose
Dilsea-Neodilsea complex and Weeksia. Botany 86, 773-789
Scott WB, Crossman EJ. 1973. Freshwater Fishes of Canada. Gait House Publications
Ltd, Oakville, Canada
Seifertova M, Vyskocilova M, Morand S, Simkova A. 2008. Metazoan parasites of
freshwater cyprinid fish (Leuciscus cephalus): testing biogeographical hypotheses
of species diversity. Parasitology 135, 1417-1435
Seppala O, Karvonen A, Valtonen ET. 2005a. Host manipulation by parasites and risk of
non-host predation: is manipulation costly in an eye fluke-fish interaction?
Evolutionary Ecology Research 8, 871-879
Seppala O, Karvonen A, Valtonen ET. 2005b. Manipulation offish host by eye flukes in
relation to cataract formation and parasite infectivity. Animal Behaviour 70, 889-
894
Seppala O, Karvonen A, Valtonen ET. 2005c. Impaired crypsis offish infected with a
trophically transmitted parasite. Animal Behaviour 70, 895-900
Seppala O, Karvonen A, Valtonen ET. 2006. Susceptibility of eye fluke-infected fish to
predation by bird hosts. Parasitology 132, 575-579
Shariff M, Richards RH, Sommerville C. 1980. The histopathology of acute and chronic
infections of rainbow trout Salmo gairdneri Richardson with eye flukes,
Diplostomum spp. Journal of Fish Diseases 3, 455-465
Shoop WL. 1989. Systematic analysis of the Diplostomidae and Strigeidae (Trematoda).
Journal of Parasitology-, 75, 21-32
166
Shostak AW, Tomkins JC, Dick TA. 1987. The identification and morphological
variation of Diplostomum baeri bucculentum from two gull species, using
metacercarial infections from least cisco from the Northwest Territories.
Canadian Journal of Zoology 65, 2287-2291
Sitja-Bobadilla A. 2008. Living off a fish: a trade-off between parasites and the immune
system. Fish and Shellfish Immunology 25, 358-372
Smith MA, Fisher BL, Hebert PDN. 2005. DNA barcoding for effective biodiversity
assessment of a hyperdiverse arthropod group: the ants of Madagascar.
Philosophical Transactions of the Royal Society of London B: Biological Sciences
360,1825-1834
Smith MA, Wood DM, Janzen DH, Hallwachs W, Hebert PDN. 2007. DNA barcodes
affirm that 16 species of apparently generalist tropical parasitoid flies (Diptera
Tachinidae) are not all generalists. Proceedings of the National Academy of
Sciences of the USA 104, 4967-4972
Soininen J, McDonald R, Hillebrand H. 2007. The distance decay of similarity in
ecological communities. Ecography 30, 3-12
Sonnenberg R, Nolte AW, Tautz D. 2007. An evaluation of LSU rDNA D1-D2
sequences for their use in species identification. Frontiers in Zoology 4
Steinauer ML, Nickol BB, Orti G. 2007. Cryptic speciation and patterns of phenotypic
variation of a highly variable acanthocephalan parasite. Molecular Ecology 16,
4097-4109
167
Stein-Streilein JW, Streilein J. 2002. Anterior chamber associated immune deviation
(ACAID): regulation, biological relevance, and implications for therapy.
International Reviews of Immunology 21, 123-152
Szidat L. 1969. Structure, development, and behavior of new strigeatoid metacercariae
from subtropical fishes of South America. Journal of the Fisheries Research
Board of Canada 26, 753-786
Tamura K, Dudley J, Nei M, Kumar S. 2007. MEGA4: Molecular Evolutionary Genetics
Analysis (MEGA) software version 4.0. Molecular Biology and Evolution 24,
1596-1599
Thompson JD, Higgins DG, Gibson TJ. 1994. CLUSTAL W: improving the sensitivity of
progressive multiple sequence alignments through sequence weighting, position
specific gap penalties and weight matrix choice. Nucleic Acids Research 22,
4673-4680
Timi JT, Lanfranchi AL, Luque JL. 2009. Similarity in parasite communities of the
teleost fish Pinguipes brasilianus in the southwestern Atlantic: Infracommunities
as a tool to detect geographical patterns? International Journal for Parasitology,
online early, doi:10.1016/j.ijpara.2009.07.006
van Herwerden L, Blair D, Agatsuma T. 2000. Multiple lineages of the mitochondrial
gene NADH dehydrogenase subunit 1 (ND1) in parasitic helminthes: implications
for molecular evolutionary studies of facultatively anaerobic eukaryotes. Journal
of Molecular Evolution 11, 157-163
168
Vignon M, Sasal P. 2009. Multiscale determinants of parasite abundance: A quantitative
hierarchical approach for coral reef fishes, International Journal for Parasitology,
online early, doi:10.1016/j.ijpara.2009.09.010
Vilas R, Criscione CD, Blouin MS. 2005. A comparison between mitochondrial DNA
and ribosomal internal transcribed regions prospecting for cryptic species of
platyhelminth parasites. Parasitology, 131, 839-846
Vinarski MB, Korallo NB, Krasnov BR, Shenbrot GI, Poulin R. 2007. Decay of
similarity of gamasid mite assemblages parasitic on Palaearctic small mammals:
geographic distance, host-species composition or environment. Journal of
Biogeography 34, 1691-1700
Voutilainen A, Taskinen J. 2009. Infectivity oi Diplostomum spp. in arctic charr: aspects
of exposure duration and cercariae morphology. Journal of Parasitology 95, 527-
531
Ward RD, Zemlak TS, Innes BH, Last PR, Hebert PDN. 2005. DNA barcoding
Australia's fish species. Philosophical Transactions of the Royal Society of
London B: Biological Sciences 360, 1847-1857
Waugh J. 2007. DNA barcoding in animal species: progress, potential and pitfalls
BioEssays 29, 188-197
Whyte SK, Chappell LH, Secombes CJ. 1990. Protection of rainbow trout, Oncorhynchm
mykiss (Richardson), against Diplostomum spathaceum (Digenea): the role of
specific antibody and activated macrophages. Journal of Fish Diseases 13, 281-
291
169
Zarowiecki MZ, Huyse T, Littlewood DTJ. 2007. Making the most of mitochondrial
genomes - markers for phylogeny molecular ecology and barcodes in
Schistosoma (Platyhelminthes: Digenea). International Journal for Parasitology
37,1401-1418
170