1 solid state diffusion chapter 6. 2 objectives of chapter 6 examine the principles and...
Post on 22-Dec-2015
285 views
TRANSCRIPT

1
Solid Solid StateState
DiffusionDiffusion
Chapter Chapter 66
2
Objectives of Chapter 6 Examine the principles and applications of diffusion in
materials. How Diffusion Proceeds How Diffusion Can be Used in Material Processing How to Predict The RATE Of Diffusion Be Predicted For
Some Simple Cases Fick’s FIRST and second Laws How Diffusion Depends On Structure And Temperature Discuss, how diffusion is used in the synthesis and
processing of advanced materials as well as manufacturing of components using advanced materials.

3
Chapter Outline 6.1 Applications of Diffusion 6.2 Stability of Atoms and Ions 6.3 Mechanisms for Diffusion 6.4 Activation Energy for Diffusion 6.5 Rate of Diffusion (Fick’s First Law) 6.6 Factors Affecting Diffusion 6.7 Permeability of Polymers 6.8 Composition Profile (Fick’s Second
Law) 6.9 Diffusion and Materials Processing
4
Section 6.1 Applications of Diffusion
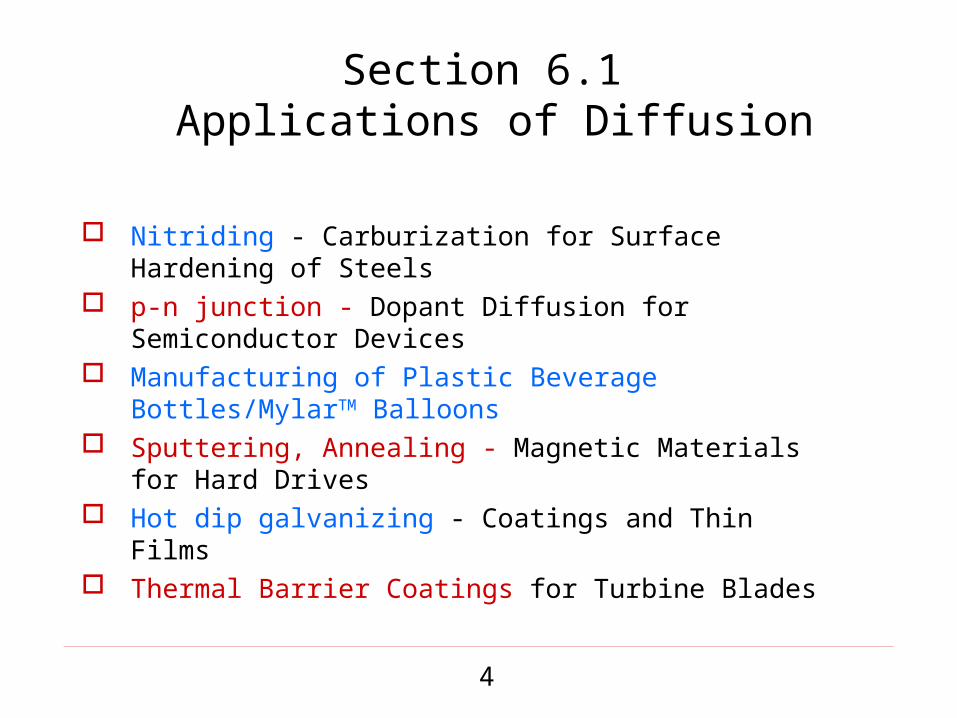
Nitriding - Carburization for Surface Hardening of Steels
p-n junction - Dopant Diffusion for Semiconductor Devices
Manufacturing of Plastic Beverage Bottles/MylarTM Balloons
Sputtering, Annealing - Magnetic Materials for Hard Drives
Hot dip galvanizing - Coatings and Thin Films Thermal Barrier Coatings for Turbine Blades

5
Figure 6.1 Furnace for heat treating steel using the carburization process. (Courtesy of Cincinnati Steel Treating).

6
Figure 6.2 Schematic of a n-p-n transistor. Diffusion plays a critical role in formation of the different regions created in the semiconductor substrates. The creation of millions of such transistors is at the heart of microelectronics technology
©20
03 B
rook
s/C
ole,
a d
ivis
ion
of T
hom
son
Lea
rnin
g, I
nc.
Tho
mso
n L
earn
ing ™
is a
trad
emar
k us
ed h
erei
n un
der
lice
nse.
7
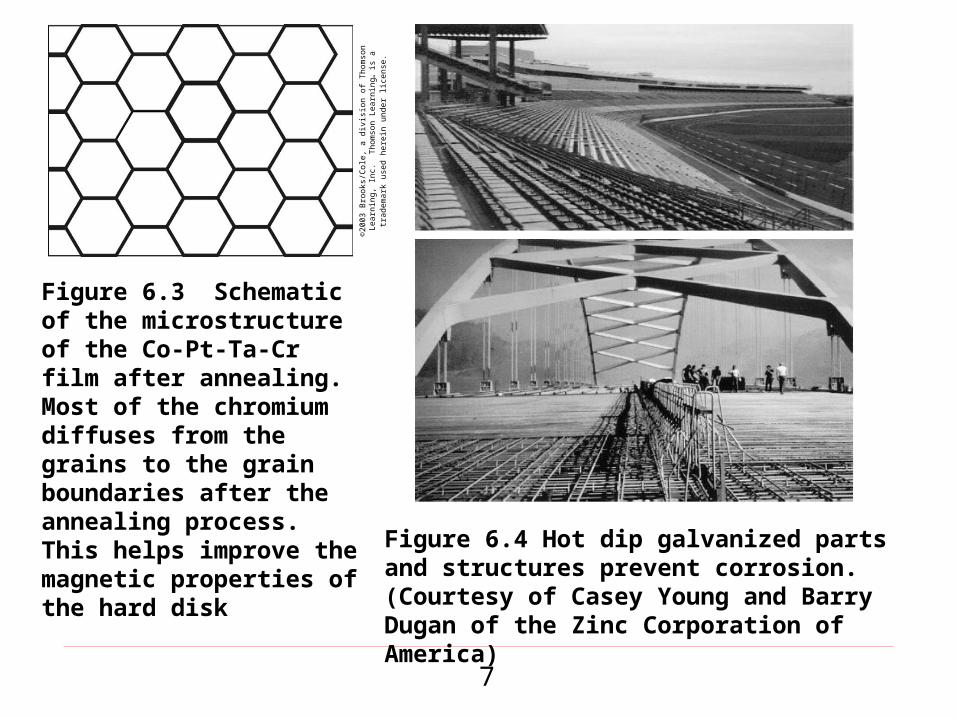
Figure 6.3 Schematic of the microstructure of the Co-Pt-Ta-Cr film after annealing. Most of the chromium diffuses from the grains to the grain boundaries after the annealing process. This helps improve the magnetic properties of the hard disk
©20
03 B
rook
s/C
ole,
a d
ivis
ion
of T
hom
son
Lea
rnin
g, I
nc.
Tho
mso
n L
earn
ing ™
is a
trad
emar
k us
ed h
erei
n un
der
lice
nse.
Figure 6.4 Hot dip galvanized parts and structures prevent corrosion. (Courtesy of Casey Young and Barry Dugan of the Zinc Corporation of America)
8
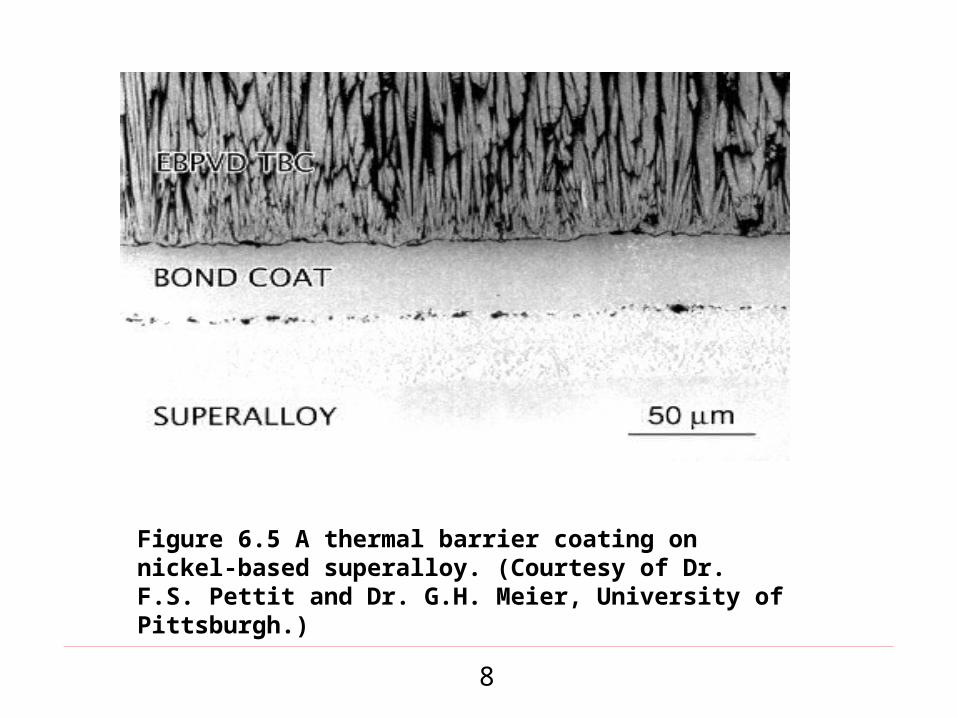
Figure 6.5 A thermal barrier coating on nickel-based superalloy. (Courtesy of Dr. F.S. Pettit and Dr. G.H. Meier, University of Pittsburgh.)
9
Example 6.1
Diffusion of Ar/He and Cu/Ni
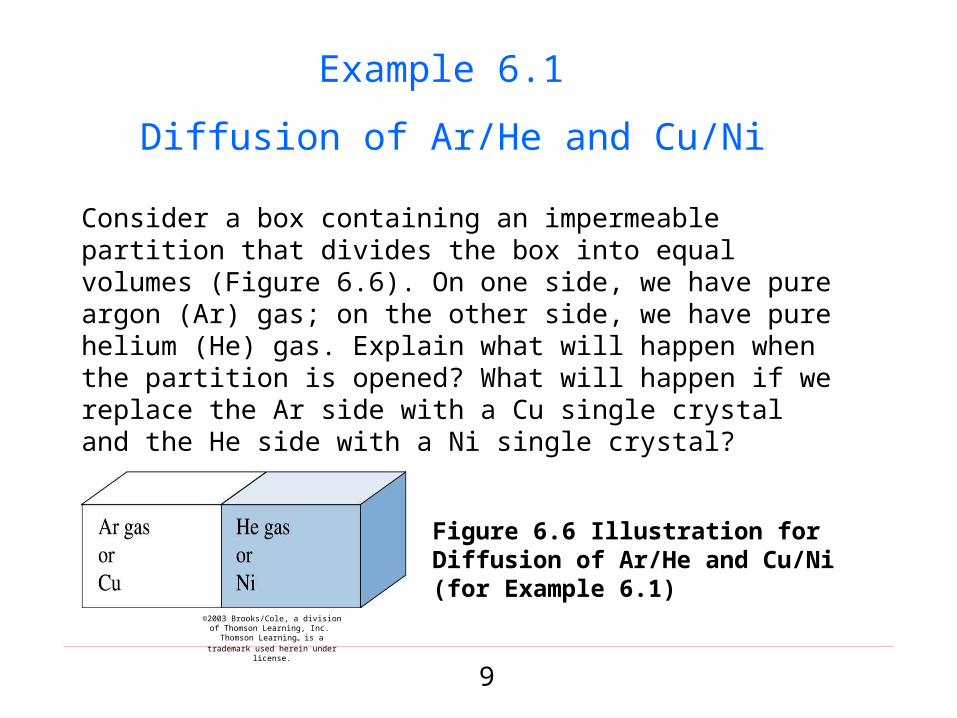
Consider a box containing an impermeable partition that divides the box into equal volumes (Figure 6.6). On one side, we have pure argon (Ar) gas; on the other side, we have pure helium (He) gas. Explain what will happen when the partition is opened? What will happen if we replace the Ar side with a Cu single crystal and the He side with a Ni single crystal?
Figure 6.6 Illustration for Diffusion of Ar/He and Cu/Ni (for Example 6.1)
©2003 Brooks/Cole, a division of Thomson Learning, Inc. Thomson Learning™ is a
trademark used herein under license.

10
Example 6.1 SOLUTION
Before the partition is opened, one compartment has no argon and the other has no helium (i.e., there is a concentration gradient of Ar and He). When the partition is opened, Ar atoms will diffuse toward the He side, and vice versa.
If we open the hypothetical partition between the Ni and Cu single crystals at room temperature, we would find that, similar to the Ar/He situation, the concentration gradients exist but the temperature is too low to see any significant diffusion of Cu atoms into Ni single crystal and vice-versa.

11
InterDiffusionInterDiffusion In a SOLID Alloy, Atoms will Move From regions of HIGH
Concentration to Regions of LOW Concentration Initial Condition After Time+Temp
100%
Concentration Profiles0
Cu Ni100%
Concentration Profiles0
12
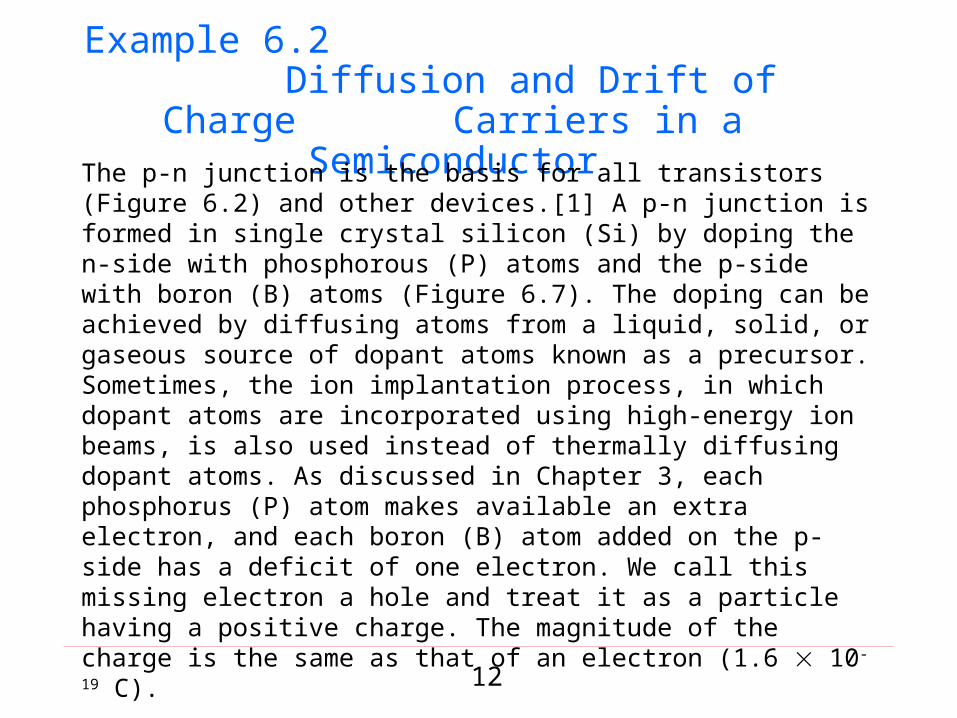
Example 6.2 Diffusion and Drift of Charge Carriers in a
SemiconductorThe p-n junction is the basis for all transistors (Figure 6.2) and other devices.[1] A p-n junction is formed in single crystal silicon (Si) by doping the n-side with phosphorous (P) atoms and the p-side with boron (B) atoms (Figure 6.7). The doping can be achieved by diffusing atoms from a liquid, solid, or gaseous source of dopant atoms known as a precursor. Sometimes, the ion implantation process, in which dopant atoms are incorporated using high-energy ion beams, is also used instead of thermally diffusing dopant atoms. As discussed in Chapter 3, each phosphorus (P) atom makes available an extra electron, and each boron (B) atom added on the p-side has a deficit of one electron. We call this missing electron a hole and treat it as a particle having a positive charge. The magnitude of the charge is the same as that of an electron (1.6 10-19 C).

13
Example 6.2 (Continued)Consider that diffusion of a species is initiated by temperature and concentration gradients and that external electric and magnetic fields can initiate the drift of carriers, then:
(a) Show schematically which way the electrons and holes will diffuse when a p-n junction is formed.
(b) Compare this situation with the diffusion of Cu and Ni atoms in the previous example.
(c) Based on this comment on the electric field driven drift of electrons and holes in the p-n junction. Assume the temperature is 300 K.

14
©2003 Brooks/Cole, a division of Thomson Learning, Inc. Thomson Learning™ is a trademark used herein under license.
Figure 6.7 Directions for diffusion and drift of charge carriers in a semiconductor (for Example 6.2)
Example 6.2 SOLUTION
15
Pn-juction

16
• Intrinsic: # electrons = # holes (n = p) --case for pure Si
• Extrinsic: --n ≠ p --occurs when impurities are added with a different # valence electrons than the host (e.g., Si atoms)
Intrinsic vs Extrinsic Conduction
• n-type Extrinsic: (n >> p)
no applied electric field
5+
4+ 4+ 4+ 4+
4+
4+4+4+4+
4+ 4+
Phosphorus atom
valence electron
Si atom
conduction electron
hole
een
• p-type Extrinsic: (p >> n)
no applied electric field
Boron atom
3+
4+ 4+ 4+ 4+
4+
4+4+4+4+
4+ 4+ hep

17
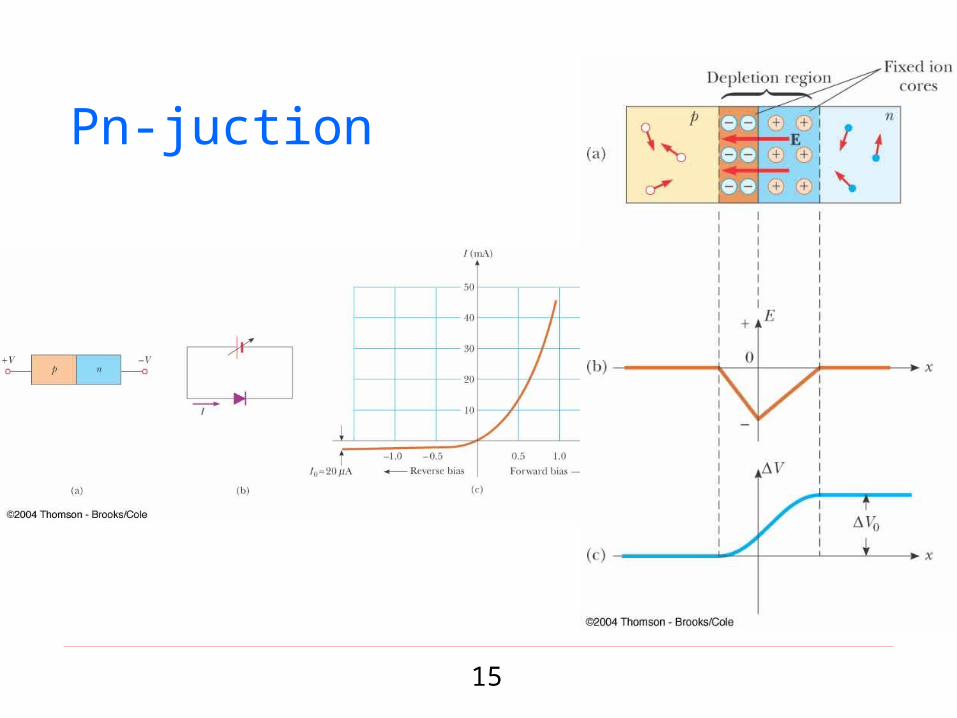
• Allows flow of electrons in one direction only (e.g., useful to convert alternating current to direct current.• Processing: diffuse P into one side of a B-doped crystal.• Results:
--No applied potential: no net current flow.
--Forward bias: carrier flow through p-type and n-type regions; holes and electrons recombine at p-n junction; current flows.
--Reverse bias: carrier flow away from p-n junction; carrier conc. greatly reduced at junction; little current flow.
p-n Rectifying Junction
++
++
+- ---
-p-type n-type
+ -
++ +
++
--
--
-
p-type n-type
+++
+
+
---
--
p-type n-type- +
18
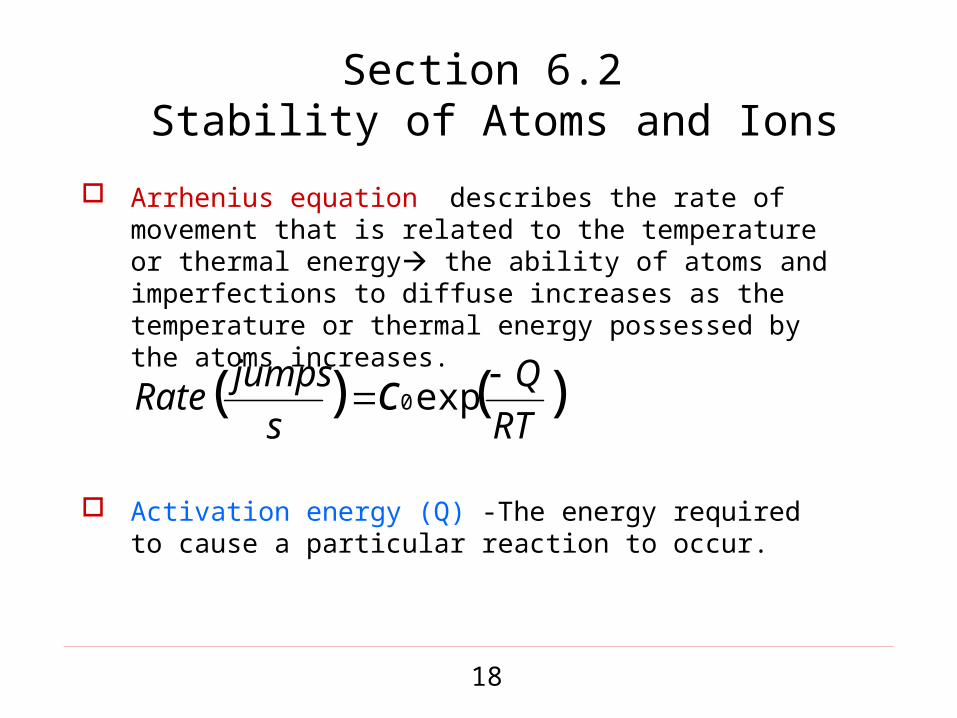
Section 6.2 Stability of Atoms and Ions
Arrhenius equation describes the rate of movement that is related to the temperature or thermal energy the ability of atoms and imperfections to diffuse increases as the temperature or thermal energy possessed by the atoms increases.
Activation energy (Q) -The energy required to cause a particular reaction to occur.
)()( exp0RT
Q
s
jumpsRate c

19
Figure 6.8 The Arrhenius plot of in (rate) versus 1/T can be used to determine the activation energy required for a reaction
©20
03 B
rook
s/C
ole,
a d
ivis
ion
of T
hom
son
Lea
rnin
g, I
nc.
Tho
mso
n L
earn
ing ™
is a
trad
emar
k us
ed h
erei
n un
der
lice
nse.
20
Example 6.3 Activation Energy for Interstitial Atoms
Suppose that interstitial atoms are found to move from one site to another at the rates of 5 108 jumps/s at 500oC and 8 1010 jumps/s at 800oC. Calculate the activation energy Q for the process.
21
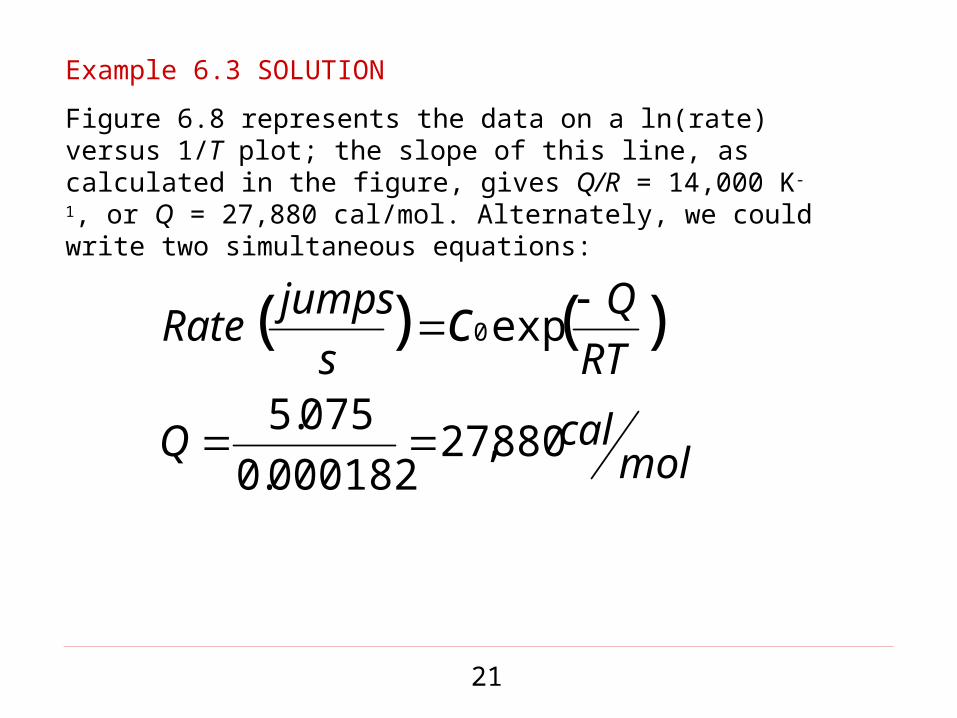
Example 6.3 SOLUTION
Figure 6.8 represents the data on a ln(rate) versus 1/T plot; the slope of this line, as calculated in the figure, gives Q/R = 14,000 K-1, or Q = 27,880 cal/mol. Alternately, we could write two simultaneous equations:
molcalQ
RT
Q
s
jumpsRate c
880,27000182.0
075.5
exp )()( 0
22
Section 6.3 Mechanisms for Diffusion
Self-diffusion - The random movement of atoms within an essentially pure material.
Vacancy diffusion - Diffusion of atoms when an atom leaves a regular lattice position to fill a vacancy in the crystal.
Interstitial diffusion - Diffusion of small atoms from one interstitial position to another in the crystal structure.

23
Diffusion MechanismsDiffusion Mechanisms Substitutional Diffusion
• applies to substitutional impurities
• atoms exchange position with lattice-vacancies
• rate depends on:– Number/Concentration of vacancies (Nv by Arrhenius)
– Activation energy to exchange (the “Kick-Out” reaction)
increasing elapsed time

24
Substitutional Diff SimulationSubstitutional Diff Simulation Simulation of
interdiffusion across an interface
Rate of substitutional diffusion depends on:• Vacancy
concentration
• Jumping Frequency
25
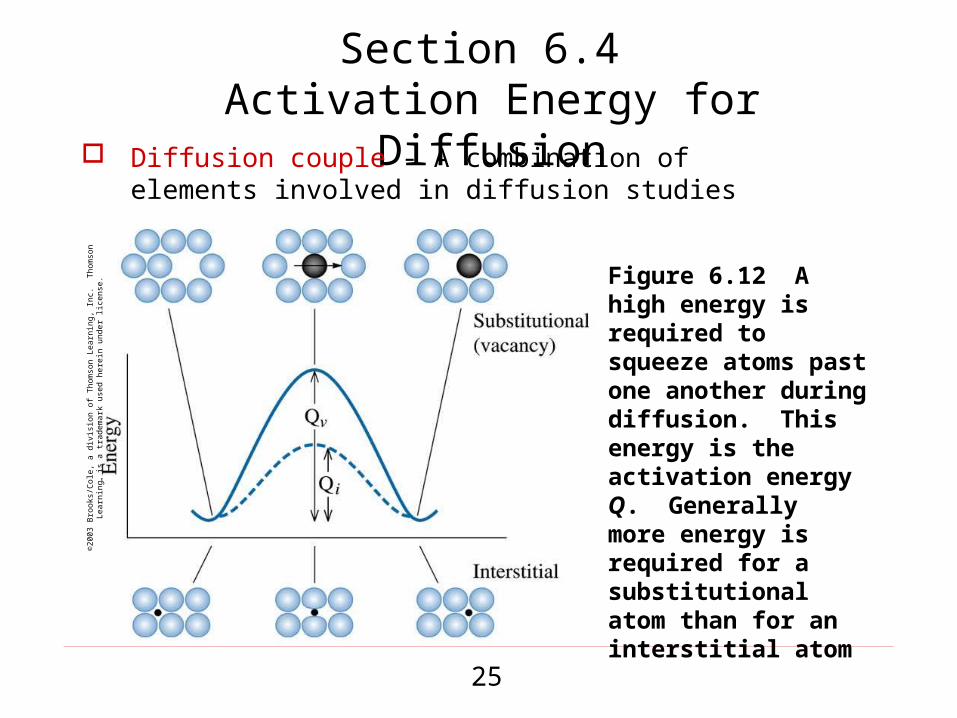
Section 6.4 Activation Energy for Diffusion
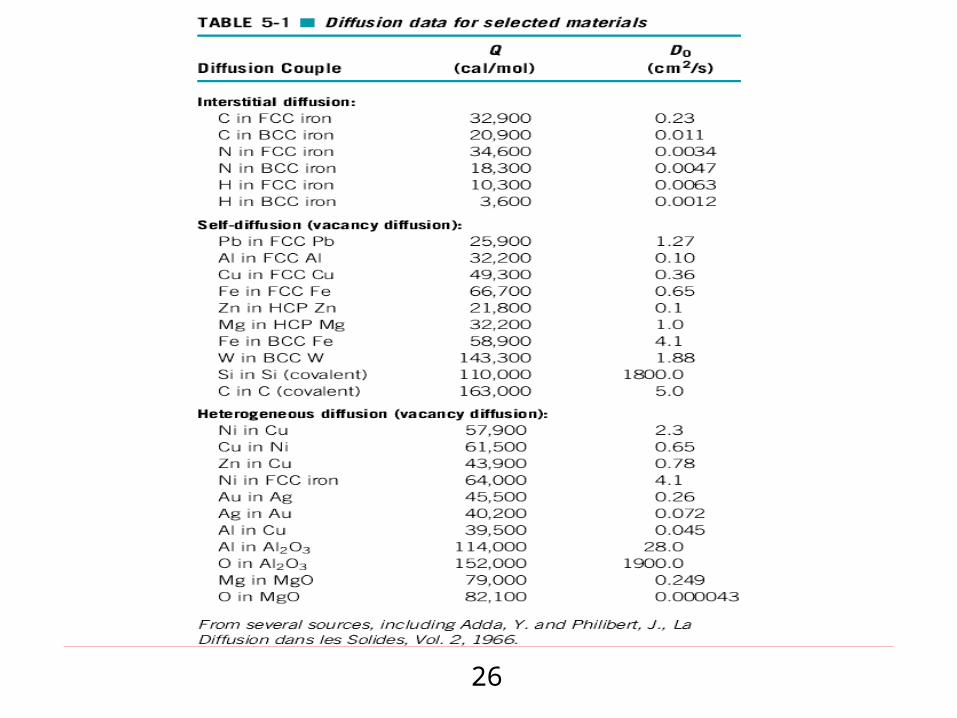
Diffusion couple - A combination of elements involved in diffusion studies
©20
03 B
rook
s/C
ole,
a d
ivis
ion
of T
hom
son
Lea
rnin
g, I
nc.
Tho
mso
n L
earn
ing ™
is a
trad
emar
k us
ed
here
in u
nder
lice
nse.
Figure 6.12 A high energy is required to squeeze atoms past one another during diffusion. This energy is the activation energy Q. Generally more energy is required for a substitutional atom than for an interstitial atom
26
27
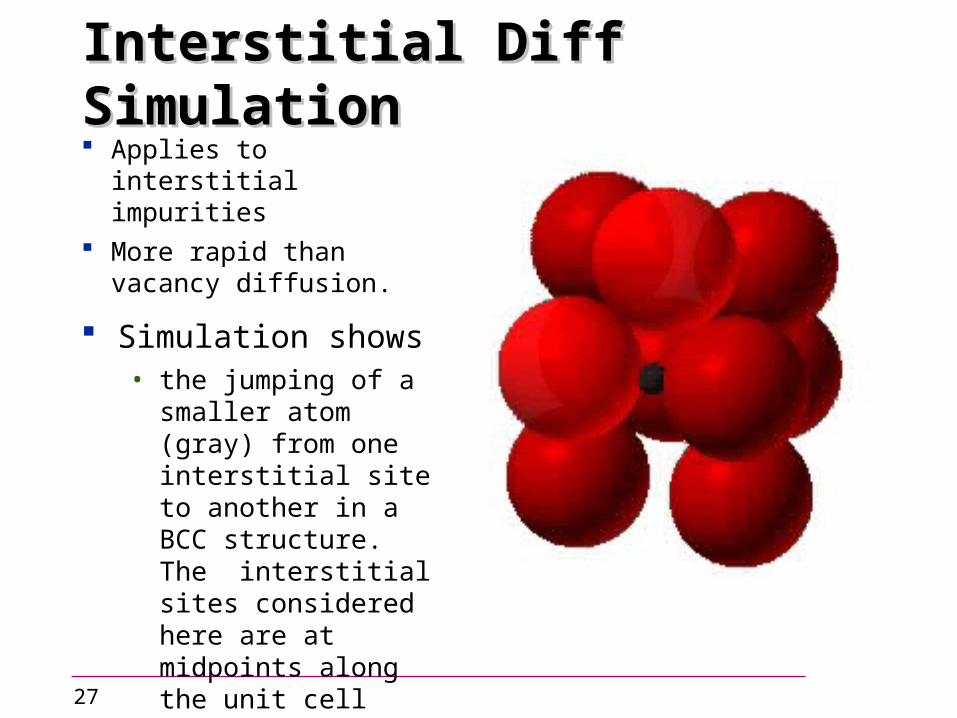
Interstitial Diff SimulationInterstitial Diff Simulation Applies to interstitial
impurities More rapid than
vacancy diffusion.
Simulation shows• the jumping of a smaller
atom (gray) from one interstitial site to another in a BCC structure. The interstitial sites considered here are at midpoints along the unit cell edges.

28
Diffusion in Processing Case1Diffusion in Processing Case1 Example: CASE Hardening
• Diffuse carbon atoms into the host iron atoms at the surface.
• Example of interstitial diffusion is a case Hardened gear.
Result: The "Case" is• hard to deform: C atoms "lock"
xtal planes to reduce shearing
• hard to crack: C atoms put the surface in compression
ShearResistant
CrackResistant

29
©20
03 B
rook
s/C
ole,
a d
ivis
ion
of T
hom
son
Lea
rnin
g, I
nc.
Tho
mso
n L
earn
ing ™
is a
trad
emar
k us
ed h
erei
n un
der
lice
nse.
Figure 6.10 Diffusion of copper atoms into nickel. Eventually, the copper atoms are randomly distributed throughout the nickel

30
Figure 6.11 Diffusion mechanisms in material: (a) vacancy or substitutional atom diffusion and (b) interstitial diffusion
©2003 Brooks/Cole, a division of Thomson Learning, Inc. Thomson Learning™ is a trademark used herein under license.
31
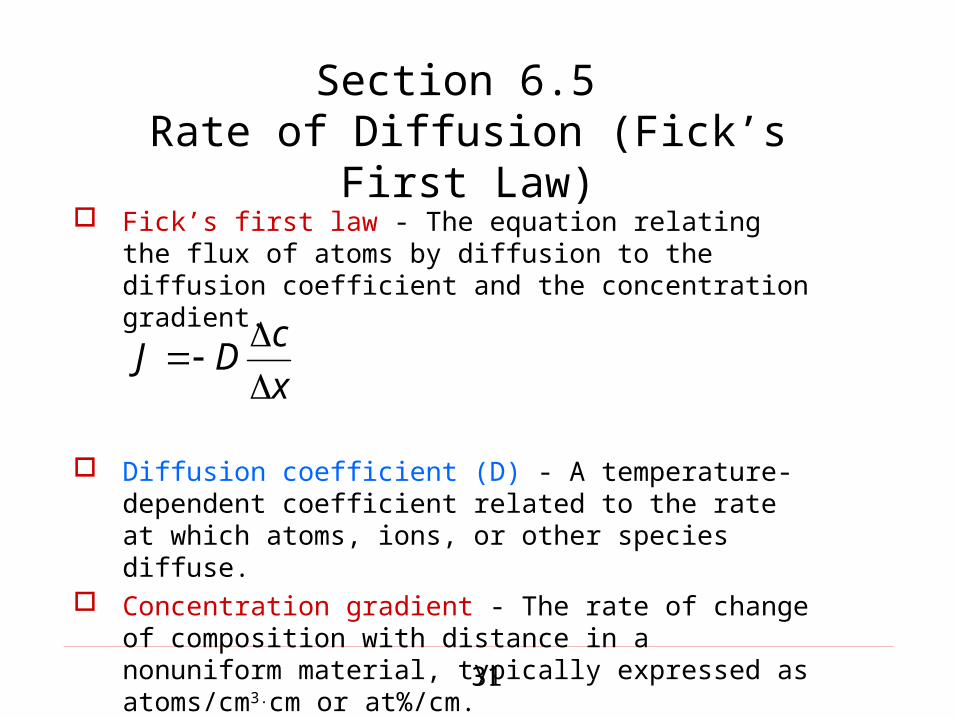
Section 6.5 Rate of Diffusion (Fick’s First Law)
Fick’s first law - The equation relating the flux of atoms by diffusion to the diffusion coefficient and the concentration gradient.
Diffusion coefficient (D) - A temperature-dependent coefficient related to the rate at which atoms, ions, or other species diffuse.
Concentration gradient - The rate of change of composition with distance in a nonuniform material, typically expressed as atoms/cm3.cm or at%/cm.
x
cDJ

32
©20
03 B
rook
s/C
ole,
a d
ivis
ion
of T
hom
son
Lea
rnin
g, I
nc.
Tho
mso
n L
earn
ing ™
is a
trad
emar
k us
ed h
erei
n un
der
lice
nse.
Figure 6.14 The flux during diffusion is defined as the number of atoms passing through a plane of unit area per unit time
x
cDJ

33
©20
03 B
rook
s/C
ole,
a d
ivis
ion
of T
hom
son
Lea
rnin
g, I
nc.
Tho
mso
n L
earn
ing ™
is a
trad
emar
k us
ed h
erei
n un
der
lice
nse.
Figure 6.15 Illustration of the concentration gradient
x
cDJ

34
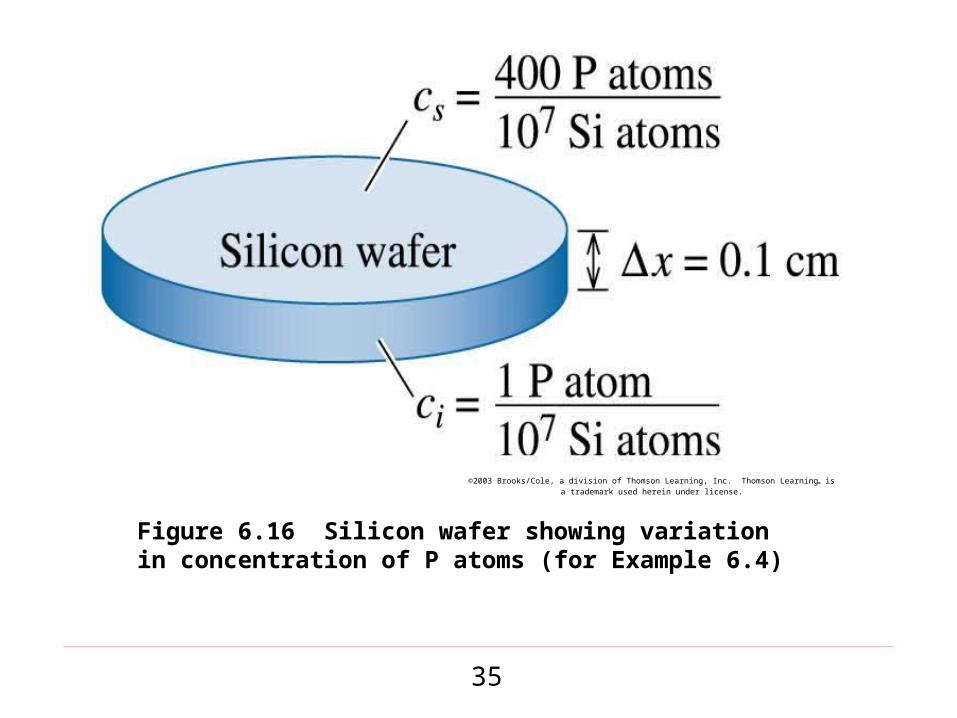
Example 6.4 Semiconductor Doping
One way to manufacture transistors, which amplify electrical signals, is to diffuse impurity atoms into a semiconductor material such as silicon (Si). Suppose a silicon wafer 0.1 cm thick, which originally contains one phosphorus atom for every 10 million Si atoms, is treated so that there are 400 phosphorous (P) atoms for every 10 million Si atoms at the surface (Figure 6.16). Calculate the concentration gradient (a) in atomic percent/cm and (b) in atoms /cm3.cm. The lattice parameter of silicon is 5.4307 Å.
x
cDJ
35
©2003 Brooks/Cole, a division of Thomson Learning, Inc. Thomson Learning™ is a trademark used herein under license.
Figure 6.16 Silicon wafer showing variation in concentration of P atoms (for Example 6.4)

36
Example 6.4 SOLUTION
a) Calculate the initial and surface compositions in atomic percent.
cm
Pat
cm
Pat
x
c
Patatoms
Patom
Patatoms
Patom
s
i
c
c
%0399.0
1.0
%004.000001.0
%004.010010
400
%00001.010010
1
7
7

37
Example 6.4 SOLUTION (Continued)
b) The volume of the unit cell:
Vcell = (5.4307 10-8 cm)3 = 1.6 10-22 cm3/cell
The volume occupied by 107 Si atoms, which are arranged in a diamond cubic (DC) structure with 8 atoms/cell, is:
V = 2 10-16 cm3
The compositions in atoms/cm3 are:
cmcm
atomsP
cmcm
atomsP
x
c
cm
atomsP
cm
Patomsc
cm
atomsP
cm
Patomc
s
i
.10995.1
1.0
)(10210005.0
)(102102
400
)(10005.0102
1
3
19
31818
3
18
316
3
18
316

38
Example 6.5 Diffusion of Nickel in Magnesium Oxide (MgO)
A 0.05 cm layer of magnesium oxide (MgO) is deposited between layers of nickel (Ni) and tantalum (Ta) to provide a diffusion barrier that prevents reactions between the two metals (Figure 6.17). At 1400oC, nickel ions are created and diffuse through the MgO ceramic to the tantalum. Determine the number of nickel ions that pass through the MgO per second. The diffusion coefficient of nickel ions in MgO is 9 10-12 cm2/s, and the lattice parameter of nickel at 1400oC is 3.6 10-8 cm.

39
Figure 6.17 Diffusion couple (for Example 6.5)
©2003 Brooks/Cole, a division of Thomson Learning, Inc. Thomson Learning™ is a trademark used herein under license.

40
Example 6.5 SOLUTION
The composition of nickel at the Ni/MgO interface is 100% Ni, or
3
22
38/ 1057.8)106.3(
4
cm
atoms
cmunitcellatoms
NiMgONic
The composition of nickel at the Ta/MgO interface is 0% Ni. Thus, the concentration gradient is:
cmcm
atoms
cmcm
atoms
x
c
.1071.1
05.0
1057.80
3
243
22

41
Example 6.5 SOLUTION (Continued)
The flux of nickel atoms through the MgO layer is:
scm
NiatomsJ
cmcm
atomsscm
x
cDJ
.1054.1
).
1071.1)(/109(
2
13
3
24212
The total number of nickel atoms crossing the 2 cm 2 cm interface per second is:
Total Ni atoms per second = J(Area)
= (1.54 1013 atoms/cm2.s) (2 cm)(2 cm)
= 6.16 1013 Ni atoms/s

42
Section 6.6 Factors Affecting Diffusion
Temperature and the Diffusion Coefficient (D)
Types of Diffusion - volume diffusion, grain boundary diffusion, Surface diffusion
Time Dependence on Bonding and Crystal
Structure Dependence on Concentration of Diffusing
Species and Composition of Matrix
43
©20
03 B
rook
s/C
ole,
a d
ivis
ion
of T
hom
son
Lea
rnin
g, I
nc.
Tho
mso
n L
earn
ing ™
is a
trad
emar
k us
ed h
erei
n un
der
lice
nse.
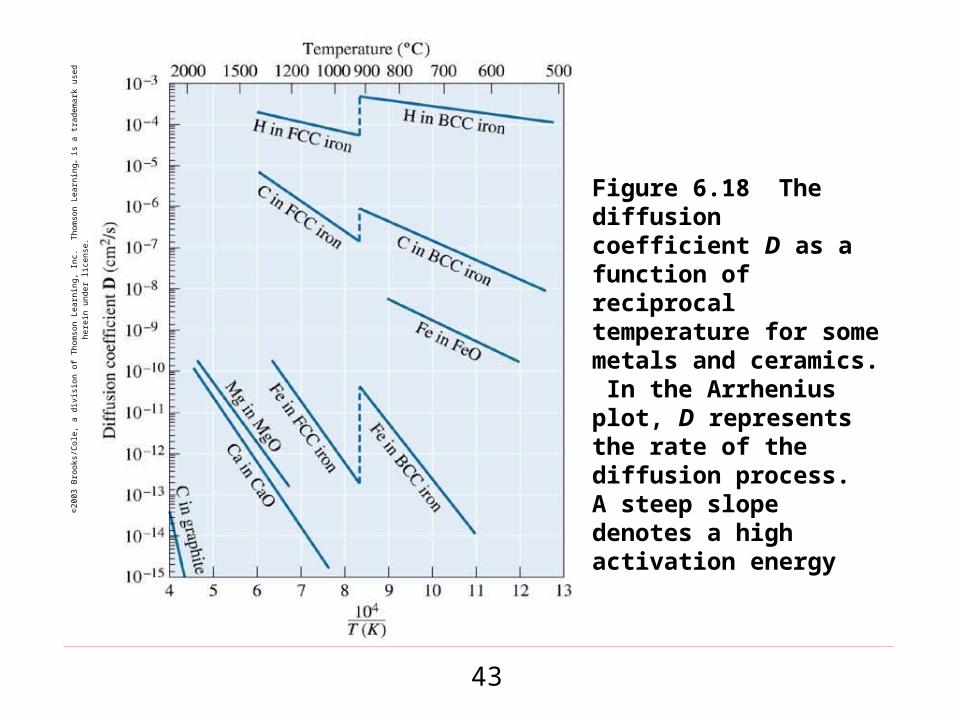
Figure 6.18 The diffusion coefficient D as a function of reciprocal temperature for some metals and ceramics. In the Arrhenius plot, D represents the rate of the diffusion process. A steep slope denotes a high activation energy
44
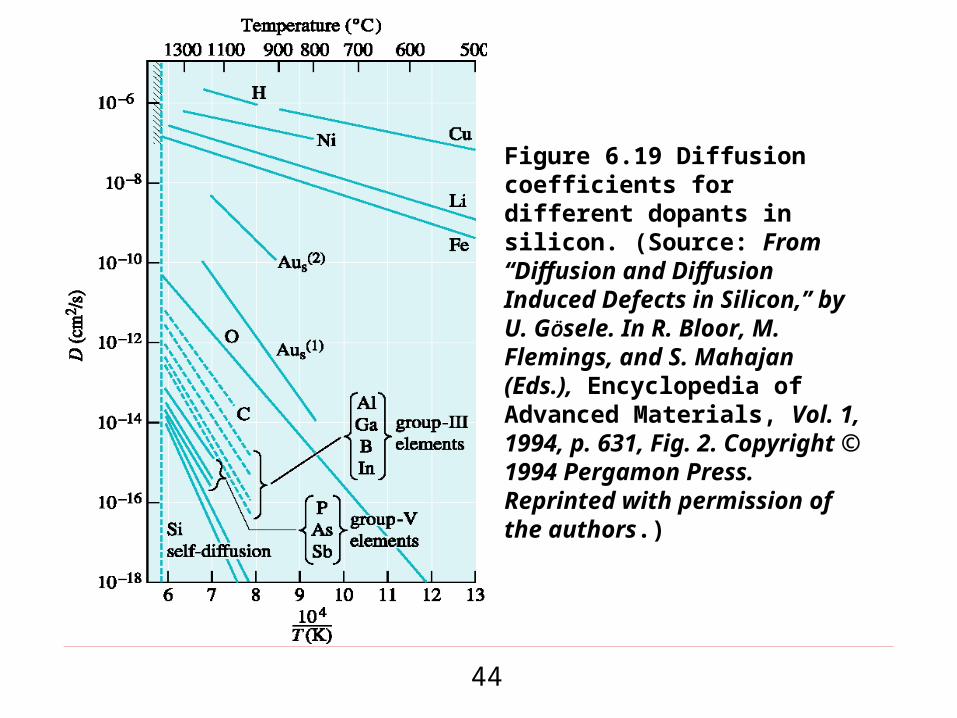
Figure 6.19 Diffusion coefficients for different dopants in silicon. (Source: From ‘‘Diffusion and Diffusion Induced Defects in Silicon,’’ by U. GÖsele. In R. Bloor, M. Flemings, and S. Mahajan (Eds.), Encyclopedia of Advanced Materials, Vol. 1, 1994, p. 631, Fig. 2. Copyright © 1994 Pergamon Press. Reprinted with permission of the authors.)

45
Figure 6.20 Diffusion in ionic compounds. Anions can only enter other anion sites. Smaller cations tend to diffuse faster
©2003 Brooks/Cole, a division of Thomson Learning, Inc. Thomson Learning™ is a trademark used herein under license.
46
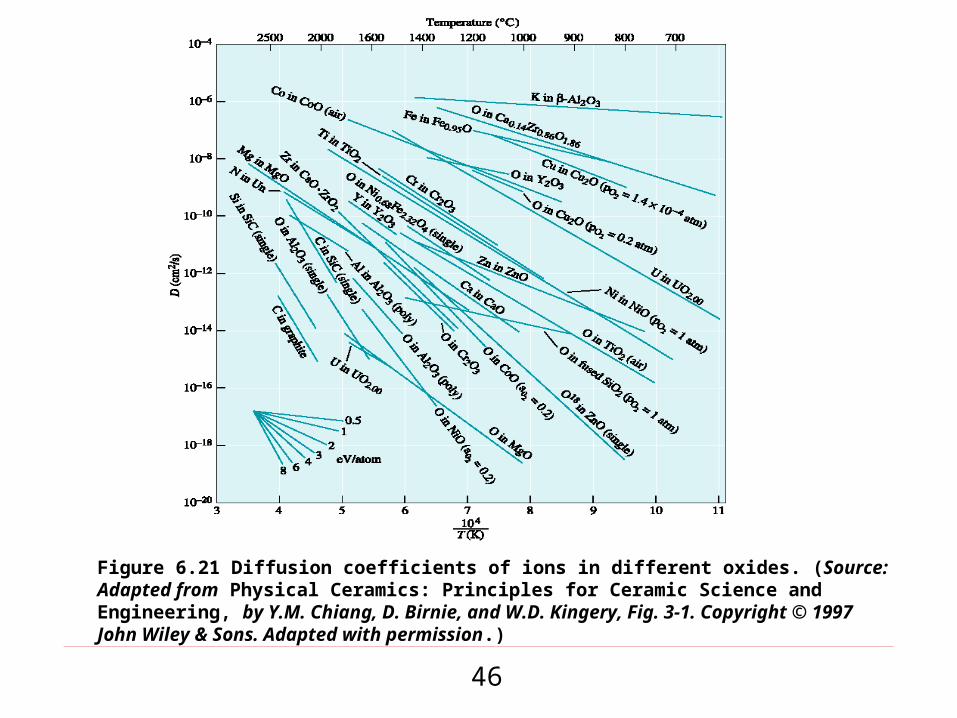
Figure 6.21 Diffusion coefficients of ions in different oxides. (Source: Adapted from Physical Ceramics: Principles for Ceramic Science and Engineering, by Y.M. Chiang, D. Birnie, and W.D. Kingery, Fig. 3-1. Copyright © 1997 John Wiley & Sons. Adapted with permission.)

47
Homework: Example 6.6 Design of an Iron Membrane
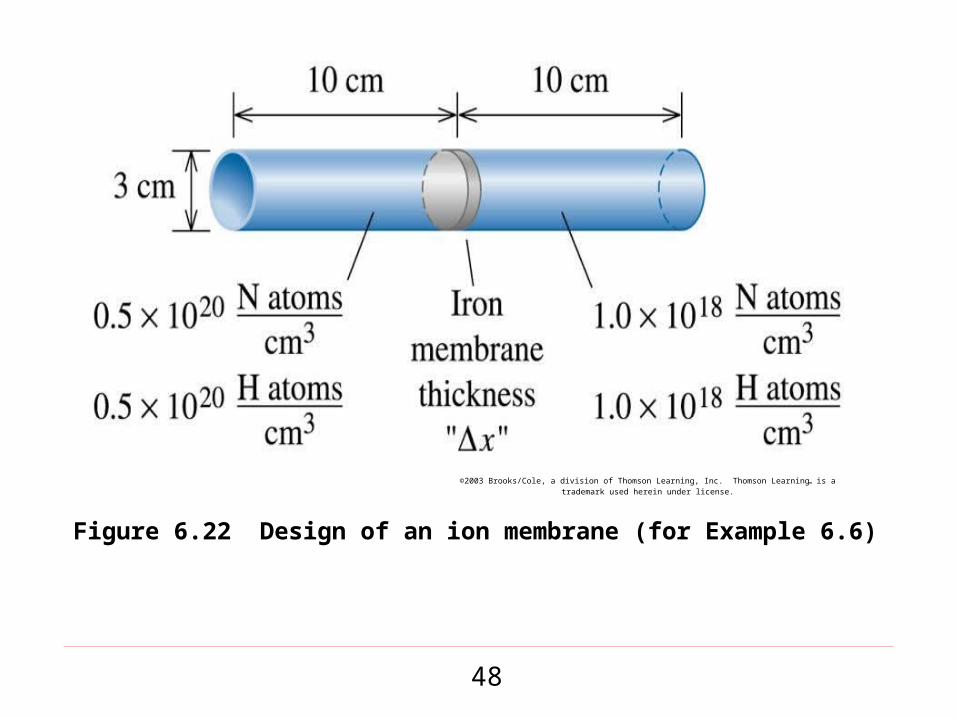
An impermeable cylinder 3 cm in diameter and 10 cm long contains a gas that includes 0.5 1020 N atoms per cm3 and 0.5 1020 H atoms per cm3 on one side of an iron membrane (Figure 6.22). Gas is continuously introduced to the pipe to assure a constant concentration of nitrogen and hydrogen. The gas on the other side of the membrane includes a constant 1 1018 N atoms per cm3 and 1 1018 H atoms per cm3. The entire system is to operate at 700oC, where the iron has the BCC structure. Design an iron membrane that will allow no more than 1% of the nitrogen to be lost through the membrane each hour, while allowing 90% of the hydrogen to pass through the membrane per hour.
48
©2003 Brooks/Cole, a division of Thomson Learning, Inc. Thomson Learning™ is a trademark used herein under license.
Figure 6.22 Design of an ion membrane (for Example 6.6)
49
50
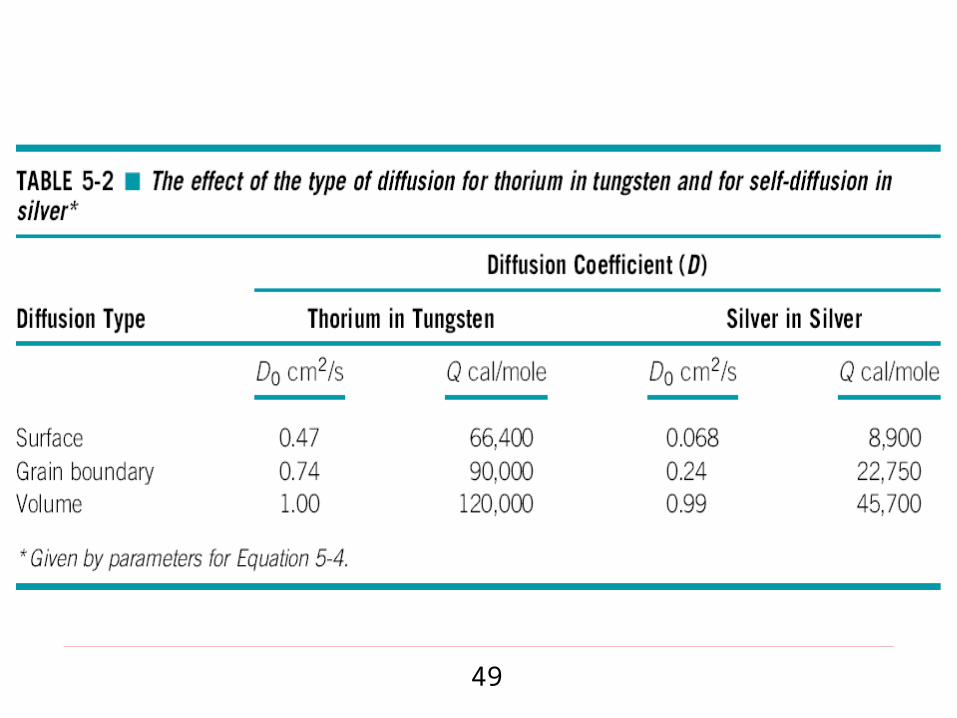
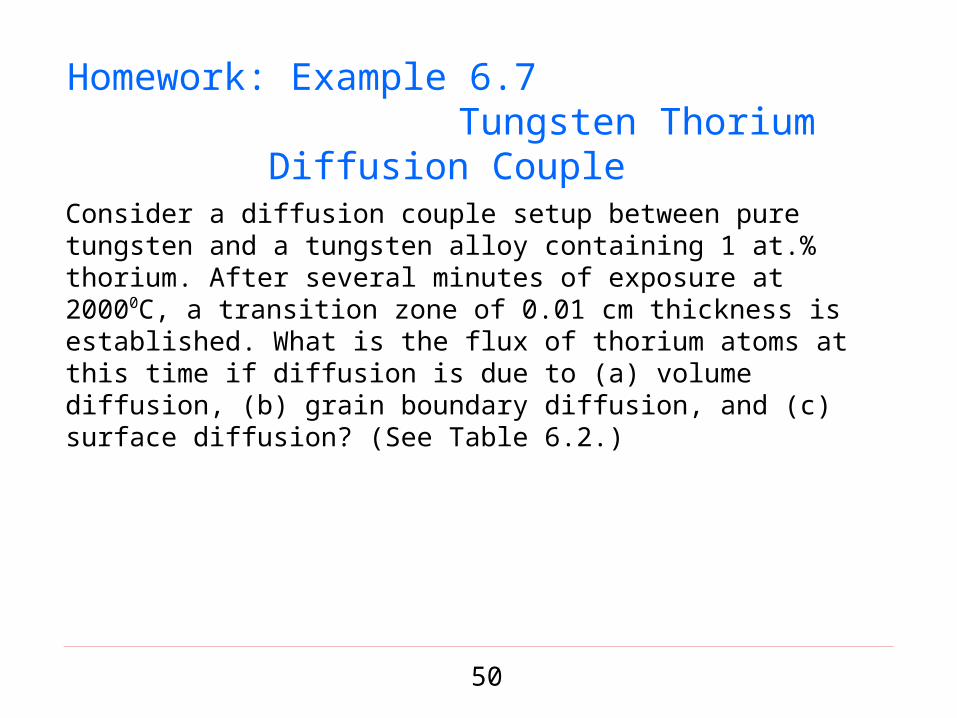
Homework: Example 6.7 Tungsten Thorium Diffusion Couple
Consider a diffusion couple setup between pure tungsten and a tungsten alloy containing 1 at.% thorium. After several minutes of exposure at 20000C, a transition zone of 0.01 cm thickness is established. What is the flux of thorium atoms at this time if diffusion is due to (a) volume diffusion, (b) grain boundary diffusion, and (c) surface diffusion? (See Table 6.2.)

51

52
©2003 Brooks/Cole, a division of Thomson Learning, Inc. Thomson Learning™ is a trademark used herein under license.
Figure 6.23 The activation energy for self-diffusion increases as the melting point of the metal increases

53
©20
03 B
rook
s/C
ole,
a d
ivis
ion
of T
hom
son
Lea
rnin
g, I
nc.
Tho
mso
n L
earn
ing ™
is a
trad
emar
k us
ed h
erei
n un
der
lice
nse.
Figure 6.24 The dependence of diffusion coefficient of Au on concentration. (Source: Adapted from Physical Metallurgy Principles, Third Edition, by R.E. Reed-Hill and R. Abbaschian, p. 363, Fig. 12-3. Copyright © 1991 Brooks/Cole Thomson Learning. Adapted with permission.)
54
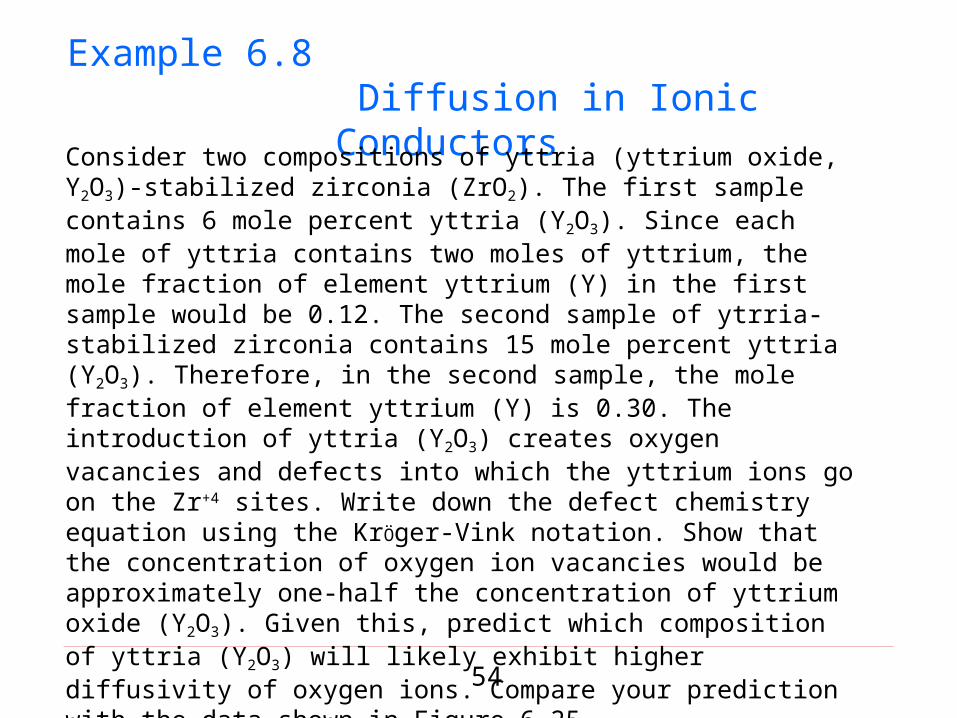
Example 6.8 Diffusion in Ionic Conductors
Consider two compositions of yttria (yttrium oxide, Y2O3)-stabilized zirconia (ZrO2). The first sample contains 6 mole percent yttria (Y2O3). Since each mole of yttria contains two moles of yttrium, the mole fraction of element yttrium (Y) in the first sample would be 0.12. The second sample of ytrria-stabilized zirconia contains 15 mole percent yttria (Y2O3). Therefore, in the second sample, the mole fraction of element yttrium (Y) is 0.30. The introduction of yttria (Y2O3) creates oxygen vacancies and defects into which the yttrium ions go on the Zr+4 sites. Write down the defect chemistry equation using the KrÖger-Vink notation. Show that the concentration of oxygen ion vacancies would be approximately one-half the concentration of yttrium oxide (Y2O3). Given this, predict which composition of yttria (Y2O3) will likely exhibit higher diffusivity of oxygen ions. Compare your prediction with the data shown in Figure 6.25.

55
Figure 6.25 Diffusivity of oxygen ions in yttria stabilized zirconia ceramics (for Example 5-8). (Source: Adapted from Physical Ceramics: Principles for Ceramic Science and Engineering, by Y.M. Chiang, D. Birnie, and W.D. Kingery, Fig. 3-14. Copyright © 1997 John Wiley & Sons, Inc. Based on Transport in Nonstoichiometric Compounds, by G. Simkovich and U.S. Stubican (Eds.), p. 188–202, Plenum Press. Adapted with permission.)

56
Example 6.8 SOLUTION
Equation to express the addition of yttrium oxide
For every defect, there is one oxygen ion vacancy
Therefore,
The concentration of oxygen ion vacancies would be given by the following equations:

57
Section 6.7 Permeability of Polymers
Permeability is expressed in terms of the volume of gas or vapor that can permeate per unit area, per unit time, or per unit thickness at a specified temperature and relative humidity.

58
Example 6.9 Design of Carbonated Beverage Bottles
You want to select a polymer for making plastic bottles that can be used for storing carbonated beverages. What factors would you consider in choosing a polymer for this application?

59
Example 6.9 SOLUTION
First, since the bottles are to be used for storing carbonated beverages, a plastic material with a small diffusivity for carbon dioxide gas should be chosen.
The bottles should have enough strength so that they can survive a fall of about six feet. This is often tested using a ‘‘drop test.’’
The surface of the polymer should also be amenable to printing of labels or other product information.
The effect of processing on the resultant microstructure of polymers must also be considered.
60
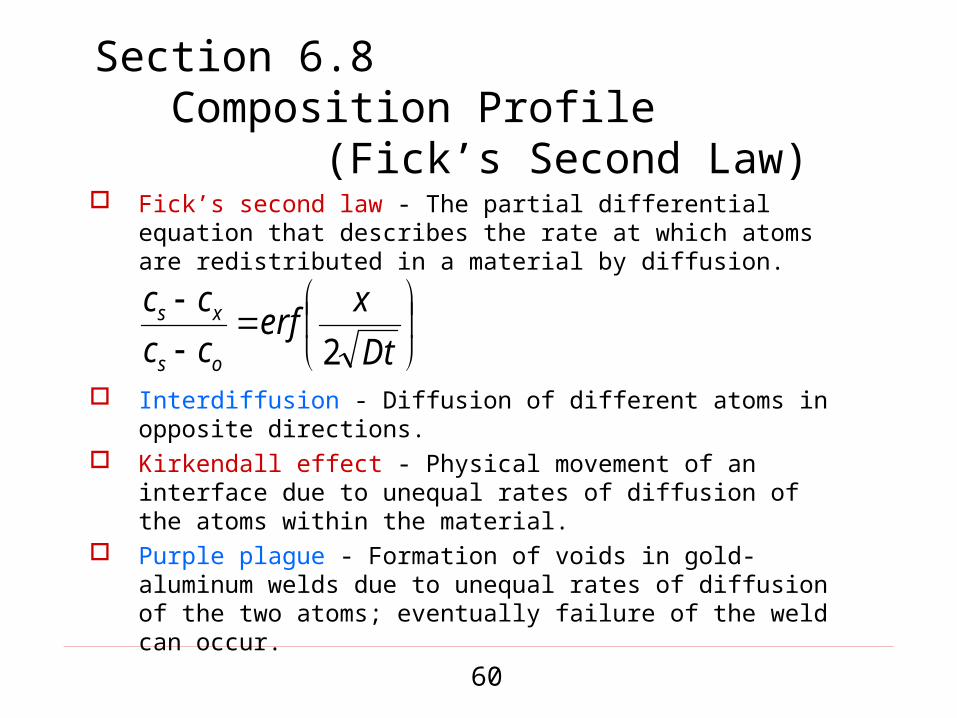
Section 6.8 Composition Profile
(Fick’s Second Law) Fick’s second law - The partial differential equation that
describes the rate at which atoms are redistributed in a material by diffusion.
Interdiffusion - Diffusion of different atoms in opposite directions.
Kirkendall effect - Physical movement of an interface due to unequal rates of diffusion of the atoms within the material.
Purple plague - Formation of voids in gold-aluminum welds due to unequal rates of diffusion of the two atoms; eventually failure of the weld can occur.
Dt
xerf
cc
cc
os
xs
2
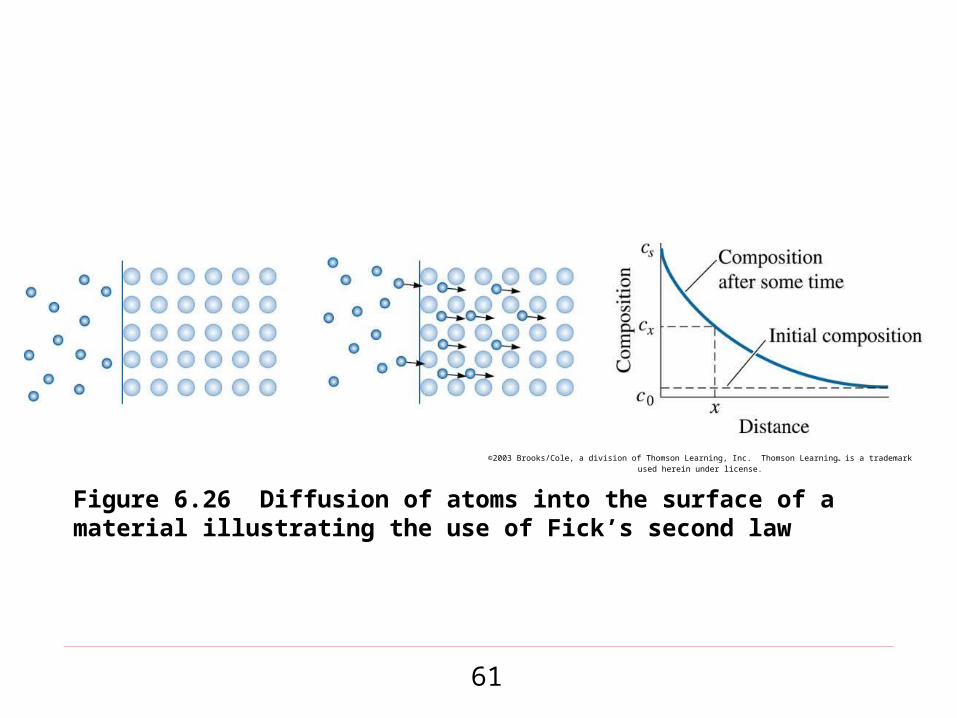
61
Figure 6.26 Diffusion of atoms into the surface of a material illustrating the use of Fick’s second law
©2003 Brooks/Cole, a division of Thomson Learning, Inc. Thomson Learning™ is a trademark used herein under license.

62

63
©20
03 B
rook
s/C
ole,
a d
ivis
ion
of T
hom
son
Lea
rnin
g, I
nc.
Tho
mso
n L
earn
ing ™
is a
trad
emar
k us
ed h
erei
n un
der
lice
nse.
Figure 6.27 Graph showing the argument and value of error function encountered in Fick’s second law
64
Example 6.10 Design of a Carburizing Treatment
The surface of a 0.1% C steel gears is to be hardened by carburizing. In gas carburizing, the steel gears are placed in an atmosphere that provides 1.2% C at the surface of the steel at a high temperature (Figure 6.1). Carbon then diffuses from the surface into the steel. For optimum properties, the steel must contain 0.45% C at a depth of 0.2 cm below the surface. Design a carburizing heat treatment that will produce these optimum properties. Assume that the temperature is high enough (at least 900oC) so that the iron has the FCC structure.
65
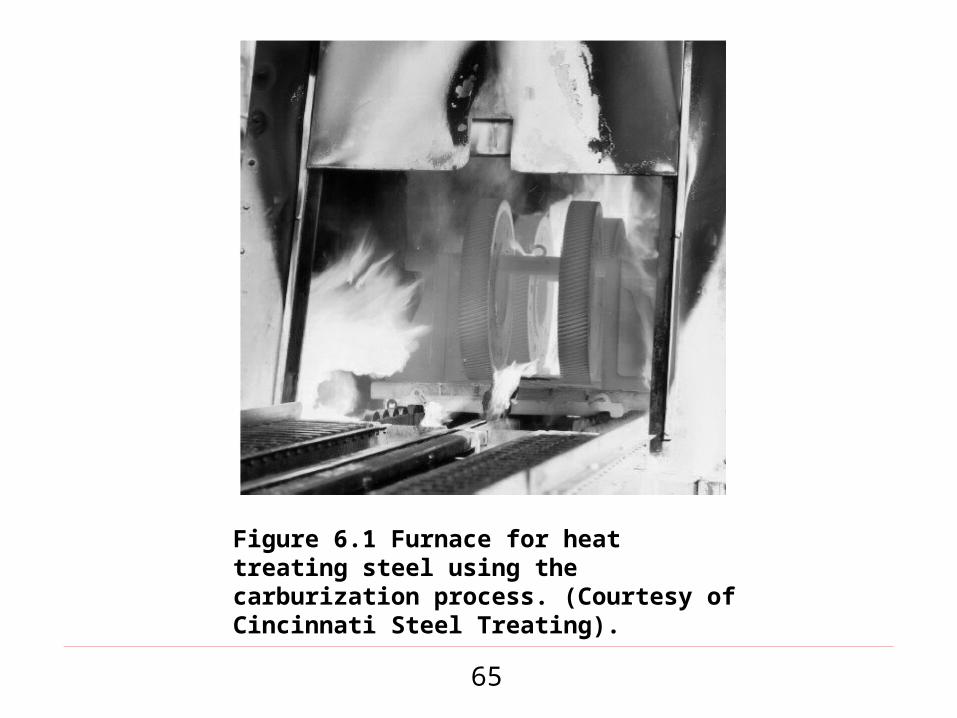
Figure 6.1 Furnace for heat treating steel using the carburization process. (Courtesy of Cincinnati Steel Treating).
66
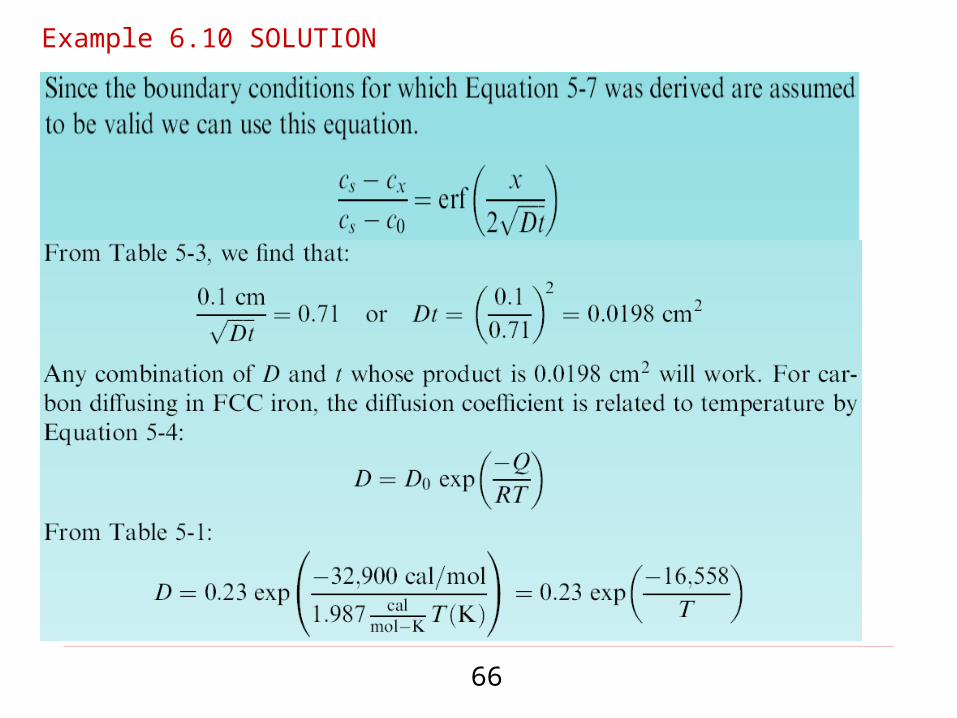
Example 6.10 SOLUTION

67
Example 6.10 SOLUTION(Continued)

68
Example 6.11 Design of a More Economical
Heat Treatment
We find that 10 h are required to successfully carburize a batch of 500 steel gears at 900oC, where the iron has the FCC structure. We find that it costs $1000 per hour to operate the carburizing furnace at 900oC and $1500 per hour to operate the furnace at 1000oC. Is it economical to increase the carburizing temperature to 1000oC? What other factors must be considered?
69
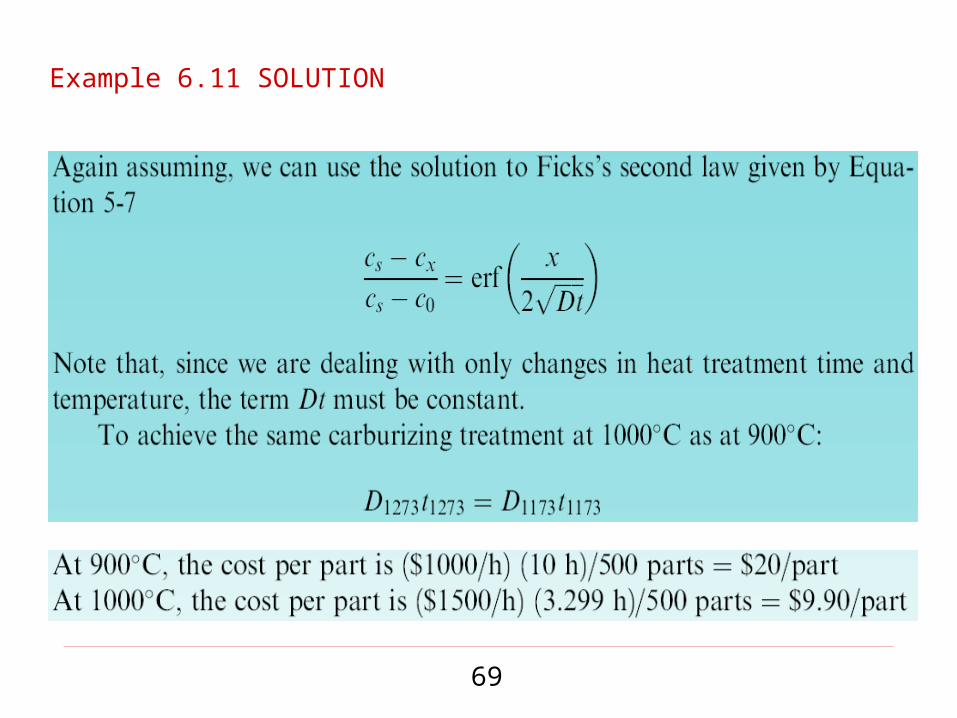
Example 6.11 SOLUTION
70
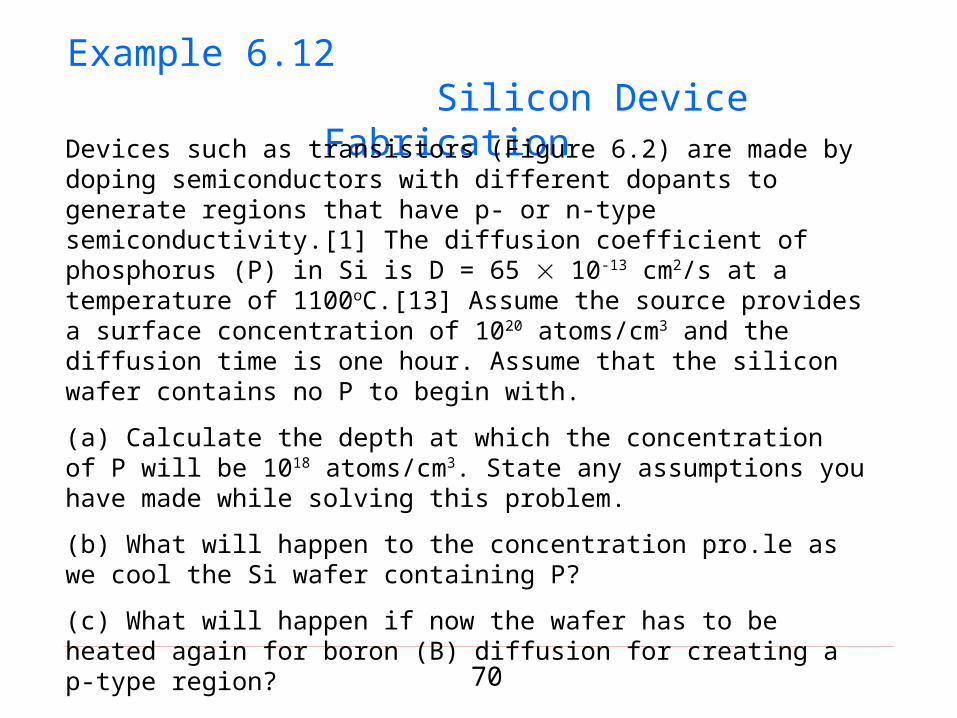
Example 6.12 Silicon Device Fabrication
Devices such as transistors (Figure 6.2) are made by doping semiconductors with different dopants to generate regions that have p- or n-type semiconductivity.[1] The diffusion coefficient of phosphorus (P) in Si is D = 65 10-13 cm2/s at a temperature of 1100oC.[13] Assume the source provides a surface concentration of 1020 atoms/cm3 and the diffusion time is one hour. Assume that the silicon wafer contains no P to begin with.
(a) Calculate the depth at which the concentration of P will be 1018 atoms/cm3. State any assumptions you have made while solving this problem.
(b) What will happen to the concentration pro.le as we cool the Si wafer containing P?
(c) What will happen if now the wafer has to be heated again for boron (B) diffusion for creating a p-type region?

71
Figure 6.2 Schematic of a n-p-n transistor. Diffusion plays a critical role in formation of the different regions created in the semiconductor substrates. The creation of millions of such transistors is at the heart of microelectronics technology
©20
03 B
rook
s/C
ole,
a d
ivis
ion
of T
hom
son
Lea
rnin
g, I
nc.
Tho
mso
n L
earn
ing ™
is a
trad
emar
k us
ed h
erei
n un
der
lice
nse.

72
Example 6.12 SOLUTION
73
Section 6.9 Diffusion and Materials Processing
Sintering - A high-temperature treatment used to join small particles.
Powder metallurgy - A method for producing monolithic metallic parts.
Dielectric resonators -Hockey puck-like pieces of ceramics such as barium magnesium tantalate (BMT) or barium zinc tantalate (BZN).
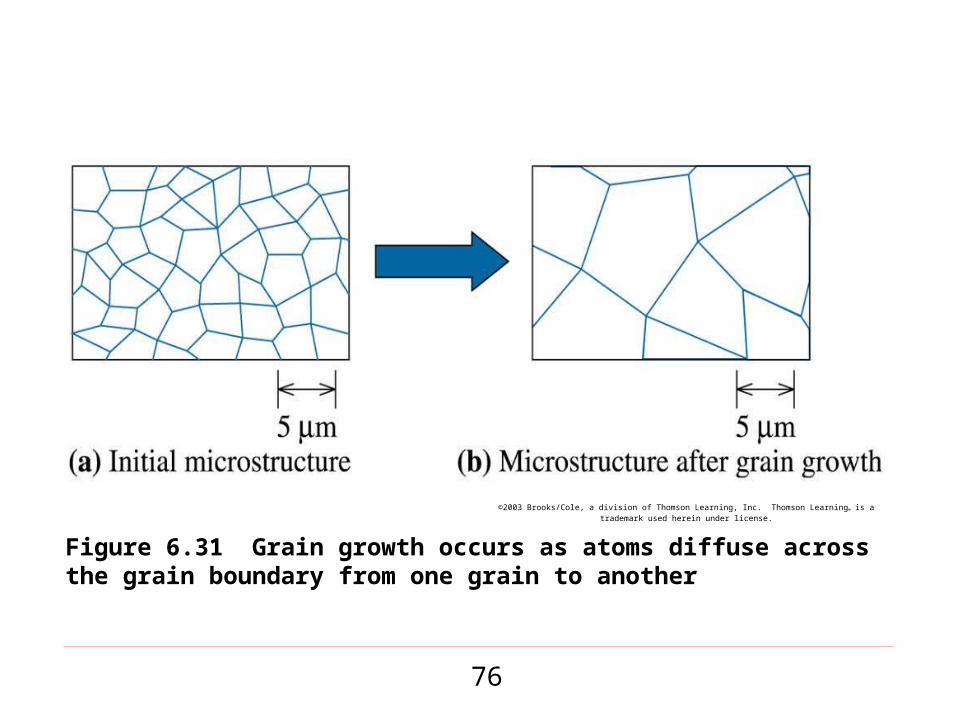
Grain growth - Movement of grain boundaries by diffusion in order to reduce the amount of grain boundary area.
Diffusion bonding - A joining technique in which two surfaces are pressed together at high pressures and temperatures.
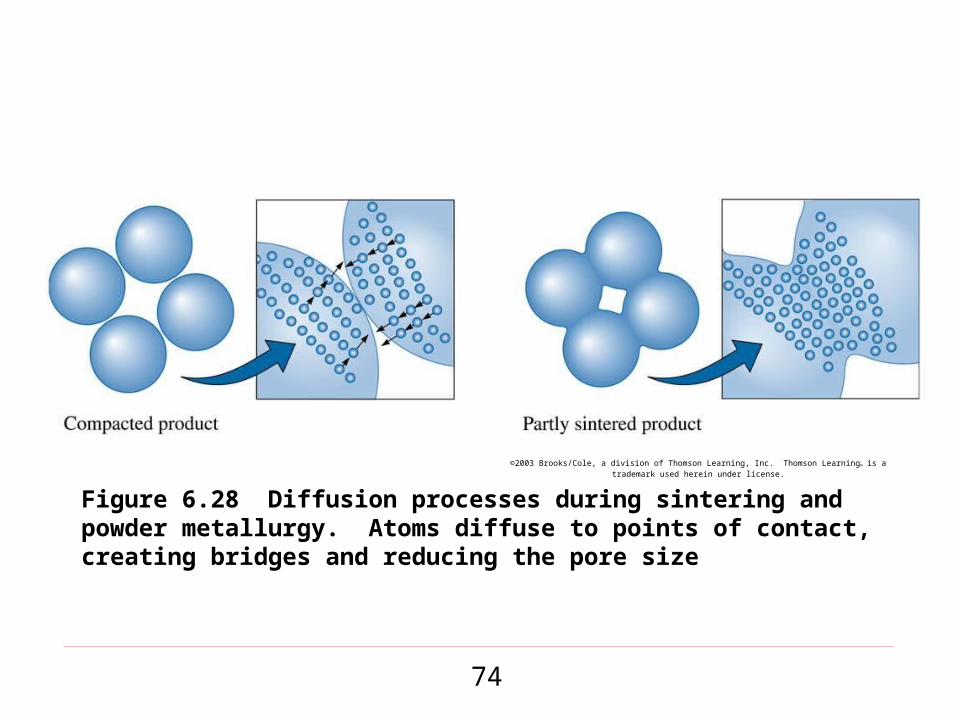
74
Figure 6.28 Diffusion processes during sintering and powder metallurgy. Atoms diffuse to points of contact, creating bridges and reducing the pore size
©2003 Brooks/Cole, a division of Thomson Learning, Inc. Thomson Learning™ is a trademark used herein under license.

75
Figure 6.30 The microstructure of BMT ceramics obtained by compaction and sintering of BMT powders. (Courtesy of H. Shirey.)
Figure 6.29 Particles of barium magnesium tantalate (BMT) (Ba(Mg1/3 Ta2/3)O3) powder are shown. This ceramic material is useful in making electronic components known as dielectric resonators that are used for wireless communications. (Courtesy of H. Shirey.)
76
©2003 Brooks/Cole, a division of Thomson Learning, Inc. Thomson Learning™ is a trademark used herein under license.
Figure 6.31 Grain growth occurs as atoms diffuse across the grain boundary from one grain to another
77
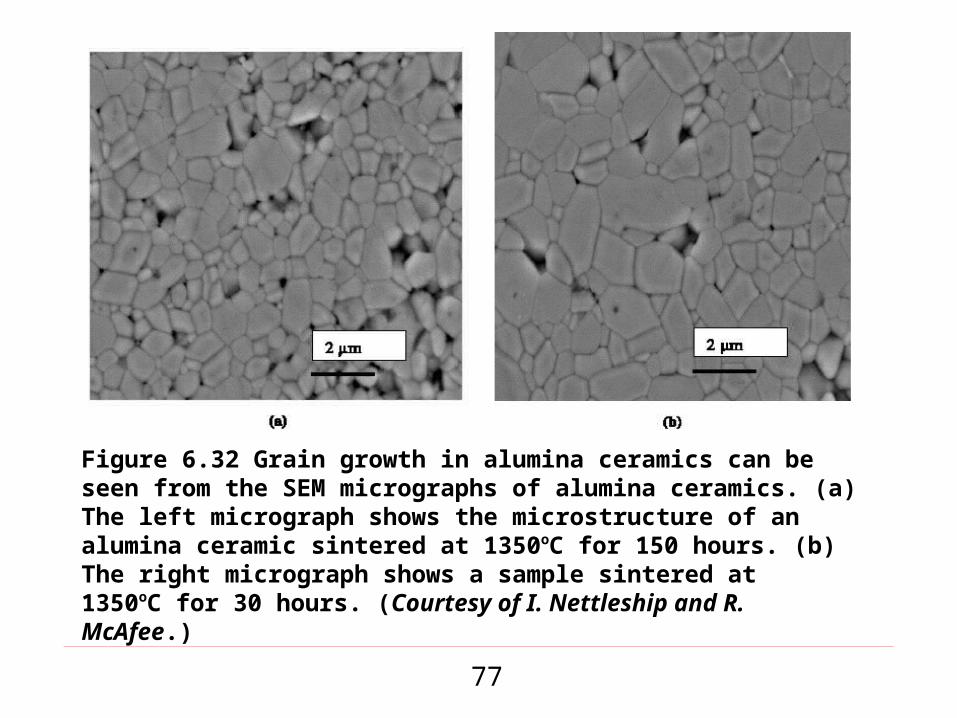
Figure 6.32 Grain growth in alumina ceramics can be seen from the SEM micrographs of alumina ceramics. (a) The left micrograph shows the microstructure of an alumina ceramic sintered at 1350oC for 150 hours. (b) The right micrograph shows a sample sintered at 1350oC for 30 hours. (Courtesy of I. Nettleship and R. McAfee.)

78
©2003 Brooks/Cole, a division of Thomson Learning, Inc. Thomson Learning™ is a trademark used herein under license.
Figure 6.33 The steps in diffusion bonding: (a) Initially the contact area is small; (b) application of pressure deforms the surface, increasing the bonded area; (c) grain boundary diffusion permits voids to shrink; and (d) final elimination of the voids requires volume diffusion