1 sensitivity studies of network optimization with displacement adjusted virtual nesting using pods....
TRANSCRIPT

1
Sensitivity Studies of Network Optimization with Displacement Adjusted Virtual Nesting using PODS.
Thomas Fiig, Revenue Management Development, Scandinavian Airlines System, Denmark.Hedegaardsvej 88, DK-2300 Copenhagen.
AGIFORS Reservations and Yield Management Conference, BKK 2001

2
Simulation Set-up in PODS
H1(41)
H2(42)
432
1
109
87
65
1517
1614
1211 22
21
2019
18
2827 26
252423
33 32313029
39
38
37
36
3534
40
13
Network D
2 Airlines
2 hubs
20 Cities (west & east).
482 markeds.
2892 paths.
Realistic fares.
Realistic disutilities.
Airline A: O&D methods
Airline B: FCYM

3
DAVN-METHODS
Emsrb
DAVN(LP)
jiiDCFare
AdjForecast
by leg
(iterate until convergence)
LP opt.
NETBID
DC
ii
DCDC
Fare
Adj
ProBPDAVN(ProBP)
Path demand and fares
Forecastby path & fares
NETBID
Path demand and fares
Forecastby path & fares
LP opt.
NETBID
DC

4
DAVN-METHODS
Emsrb
DAVN(LP)
jiiDCFare
AdjForecast
by leg
(iterate until convergence)
LP opt.
NETBID
DC
ii
DCDC
Fare
Adj
ProBPDAVN(ProBP)
Path demand and fares
Forecastby path & fares
DAVN(LP)
Emsrb
DAVN(LP)
jiiDCFare
AdjForecast
by leg
Path demand and fares
Forecastby path & fares
LP opt.
DC

5
DAVN-METHODS
Emsrb
DAVN(LP)
jiiDCFare
AdjForecast
by leg
(iterate until convergence)
LP opt.
NETBID
DC
ii
DCDC
Fare
Adj
ProBPDAVN(ProBP)
Path demand and fares
Forecastby path & fares
ProBP
(iterate until convergence)
ii
DCDC
Fare
Adj
ProBP
EmsrbForecast
by leg
Forecastby path & fares
DC
Path demand and fares

6
DAVN-METHODS
Emsrb
DAVN(LP)
jiiDCFare
AdjForecast
by leg
(iterate until convergence)
LP opt.
NETBID
DC
ii
DCDC
Fare
Adj
ProBPDAVN(ProBP)
Path demand and fares
Forecastby path & fares
DAVN(ProBP)
(iterate until convergence)
ii
DCDC
Fare
Adj
DAVN(ProBP)
EmsrbForecast
by leg
Forecastby path & fares
DC
Path demand and fares

7
Overview
Effect of reoptimization frequency
ProBP bidprice
IV
Properties of displacement costs (DC)
DAVN (LP, ProBP)
Sensitivity of bucket location, and number of buckets
DAVN (LP)I
DESCRIPTIONYM-METHODSERIES
II
III Effect of noise in displacement costs. Robustness and optimality.
DAVN (LP, ProBP)

8
Simulation Study I
– Airline A, DAVN (LP-Method) vs. Airline B EMSRb
– Sensitivity on the number of buckets 6-40, fixed and demand equalized.
– Demand factor 1.0

9
-0,4
-0,3
-0,2
-0,1
0
0,1
0,2
0 10 20 30 40 50
#buckets
Rev
enu
e (%
)DAVN(LP) Sensitivity on # buckets
System wide buckets. Fixed values through legs and timeframes. Equidistant buckets.
Demand equalized buckets. Leg specific. Recalculated at each timeframe.
DAVN LP (8 buckets), demand equalized, corresponds to the base 0%

10
Summary of Study I
• Sensitivity on the number of buckets. – Large sensitivity on the number of buckets.
Revenue difference between 8 and 30 buckets = 0.1467%.
– Fixed system wide buckets limits is not a good idea.

11
Simulation Study II
– Airline A, DAVN (LP, ProBP) vs. Airline B EMSRb– Buckets are demand equalized and number=8.– Properties of displacement costs.– Demand factors 1.0

12
Distribution of DC, LP-Method
0
5000
10000
15000
0 125 250
$
#Ob
s
TF1
TF4
TF7
TF10
TF13
TF16
Displacement Costs in LPDistribution of displacement cost by timeframe (TF)
Early Time Frame
Departure

13
Properties DC (LP)
Average DC as function of TF. Note that flights open at intermediate TF and then closes at departure.
PCT of Displacement costs that are zero as function of TF. Note that 40% - 90% of the flights are wide open.
Average DC, LP-Method
020406080
100
0 5 10 15 20
TF
$
PCT DC=0 LP-Method
00,20,40,60,8
1
0 5 10 15 20
TF
PC
T
Departure

14
Distribution of DC, PROBP-Method
0
5000
10000
15000
20000
0 125 250
$
#Ob
s
TF1
TF4
TF7
TF10
TF13
TF16
Displacement Costs in PROBP
Distribution of displacement cost by timeframe (TF)
Departure

15
Properties DC (PROBP)
Average DC as function of TF. Note that DC are much more stable, although DC tends to increase towards dep.
PCT of Displacement costs that are zero as function of TF. Note that approx. 10%-70% of the flights are wide open.
Average DC, PROBP-Method
020406080
100
0 5 10 15 20
TF
$
PCT DC=0 PROBP-Method
0
0,2
0,4
0,6
0,8
0 5 10 15 20
TF
PC
T
Departure

16
Summary of Study II
•Displacement Cost from LP– Distribution ragged. Approx 40%-90% of the DC are
zero.– Average of DC decrease at intermediate timeframes
and increases towards departure.•Displacement Cost from ProBP
– Distribution smooth. Between 10%-70% of the DC are zero.
– Average of DC is almost constant.

17
Simulation Study III
– Airline A, DAVN (LP, ProBP) vs. Airline B EMSRb– Buckets are demand equalized and number=8.– Demand factors 1.0– Sensitivity of random noise to the
displacement costs k-factor between 0 and 0.5.
– Temporal dependence of DC.In the simulation study the noise are introduced as:
randkDCDC facoldnew11

18
-0,2-0,15
-0,1-0,05
00,05
0,10,15
0 0,2 0,4 0,6
Noise k-factor
Re
v. in
pc
t
DAVN(LP)
DAVN(ProBP)
Random Noise to DC
ProBP is robust to addition of random noise. Even k-factors as high as 0.5. LP is sensitive.
Let us look at the distributions for k=0.3
DAVN LP (8 buckets), demand equalized, corresponds to the base 0%
19
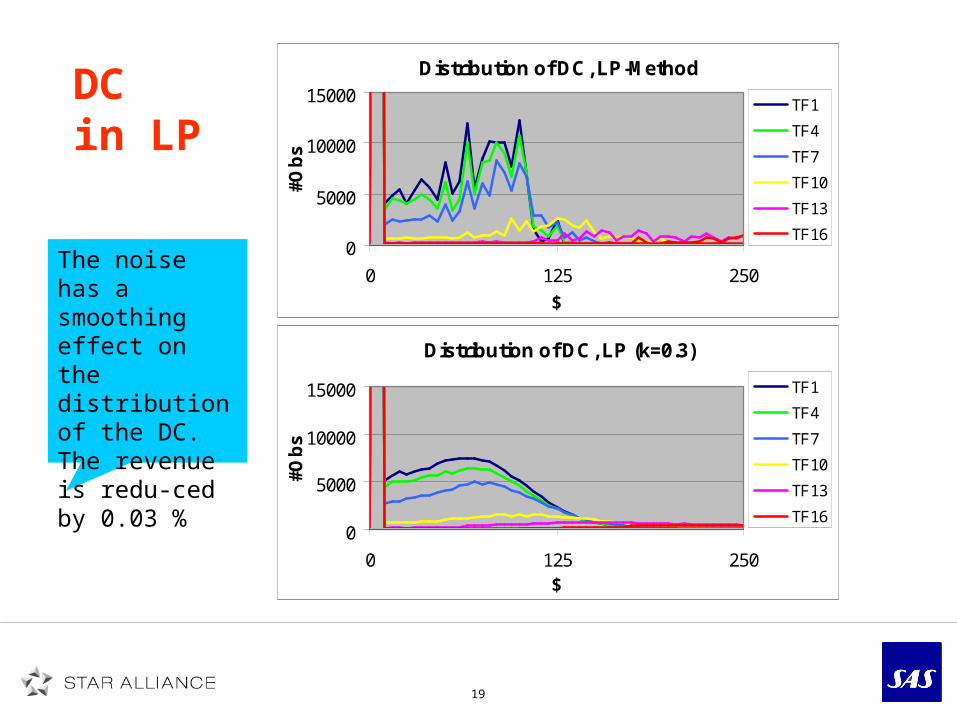
DC in LP
Distribution of DC, LP-Method
0
5000
10000
15000
0 125 250
$#O
bs
TF1
TF4
TF7
TF10
TF13
TF16
The noise has a smoothing effect on the distribution of the DC. The revenue is redu-ced by 0.03 %
Distribution of DC, LP (k=0.3)
0
5000
10000
15000
0 125 250$
#Ob
s
TF1
TF4
TF7
TF10
TF13
TF16

20
DC in ProBP
Distribution of DC, PROBP-Method
0
5000
10000
15000
20000
0 125 250
$#O
bs
TF1
TF4
TF7
TF10
TF13
TF16Again the noise has a smoothing effect on the distribution. Distribution of DC, PROBP (k=0.3)
0
5000
10000
15000
20000
0 125 250$
#Ob
s
TF1
TF4
TF7
TF10
TF13
TF16
21
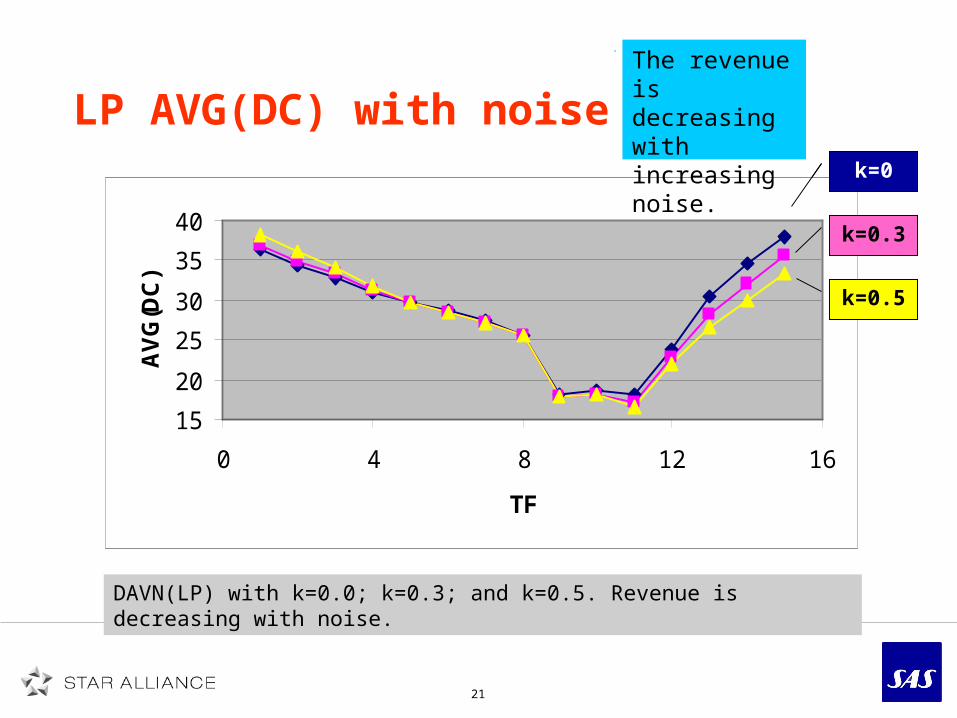
LP AVG(DC) with noise
DAVN(LP) with k=0.0; k=0.3; and k=0.5. Revenue is decreasing with noise.
k=0
15
20
25
30
35
40
0 4 8 12 16
TF
AV
G(D
C)
The revenue is decreasing with increasing noise.
k=0.3
k=0.5
k=0
22
30354045505560
0 4 8 12 16
TF
AV
G(D
C)
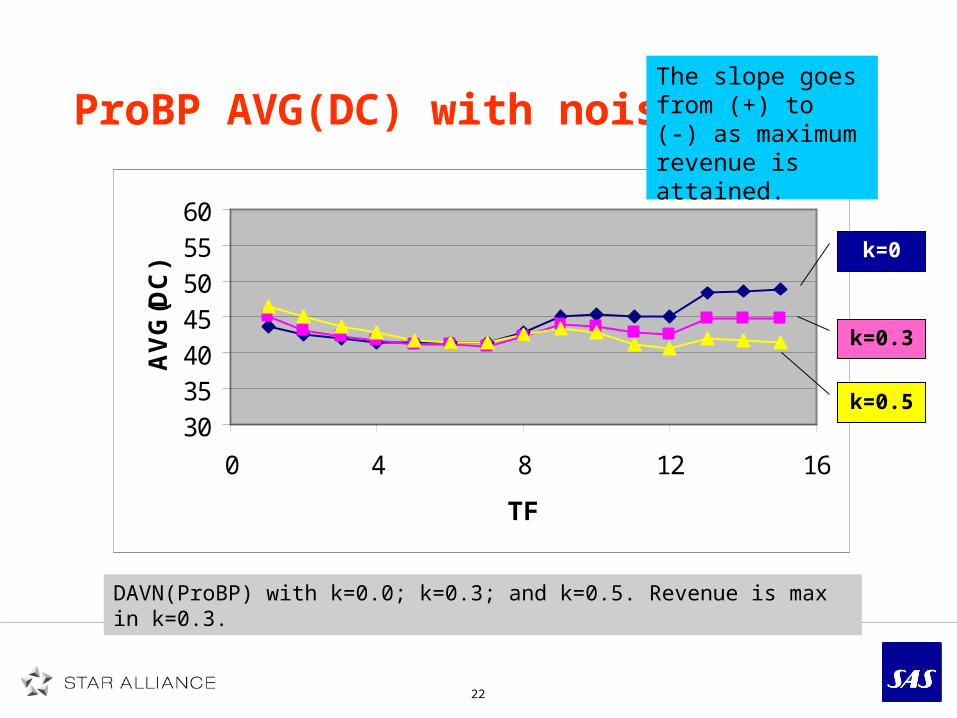
ProBP AVG(DC) with noise
DAVN(ProBP) with k=0.0; k=0.3; and k=0.5. Revenue is max in k=0.3.
The slope goes from (+) to (-) as maximum revenue is attained.
k=0
k=0.3
k=0.5

23
Summary of Study III
• Random noise to DC for DAVN (LP, ProBP)– Identified that revenue maximum coincides with
constant DC as function of timeframe.– ProBP actually gets stabilized by random noise.– LP is very sensitive to noise, since most of the
DC are zero.– The time dependence of the DC can be used as
a quality measure.– Active use of smoothing techniques to forecasts
are possibly a way to generate smoother DC distributions, which in turns stabilizes convergence of the DC.

24
Simulation Study IV
– Airline A, Bidprice (ProBP) vs. Airline B EMSRb– Demand factors 1.0– Study the revenue dependence of the
frequency of network optimization.

25
-0,4
-0,2
0
0,2
0,4
0,6
0 2 4 6 8
reopt every #book/leg
Rev
enu
e %
ProBP
Revenue as function of reopt.Breakeven for ProBP is <2 bookings per leg. Points correspond to reopt = 10, 100, 200, 500 and 1000
DAVN LP (8 buckets), demand equalized, corresponds to the base 0%

26
Benchmarking
EMSRb corresponds to the base 0%
0,45
1,51
0,57
1,04
1,391,391,401,36
0,00
0,50
1,00
1,50
Rev
in p
ct.
BIDPRICEBOOKING LIMITS