1. process diagrams
DESCRIPTION
Explicación de diagrama de procesos usado en el curso de idioma técnico 3 de la facultad de ingeniería de la Universidad de San Carlos de GuatemalaTRANSCRIPT

Process Diagrams

Structure
• The diagrams are composed by three parts:Header, Body and Summary. A general structure isshown as follows:

General Considerations
•Note that the time is given in
minutes; this is a standard for all the
diagrams.
• The diagram always is going to be
drawn from right to left, even if it
has simultaneous processes or not.
• The time is placed in the upper-leftcorner of the symbol.

General Considerations• The distance is written meters and in thelower-left corner of the symbol.
• A brief description of every step of the
process is written at the right side of the
symbol.
• When numbering the process rememberthat you have to do it according to its
function in the diagram, and when you
have a simultaneous process you have
to write the number on the left first and
then in the right, as shown in the
example.

Summary (Operations Diagram)
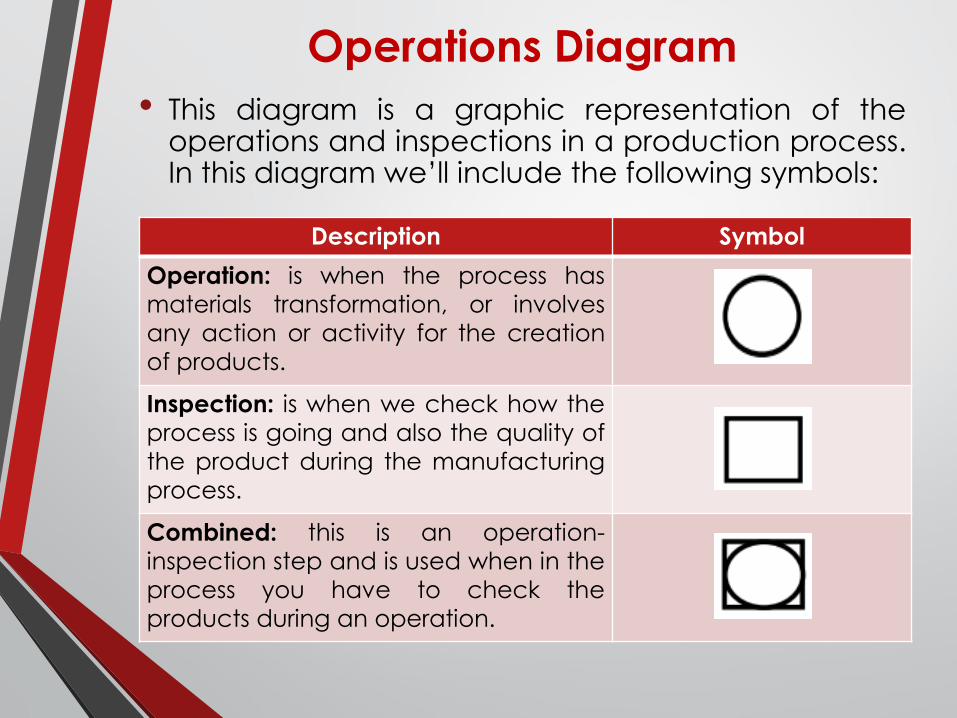
Operations Diagram
• This diagram is a graphic representation of theoperations and inspections in a production process.In this diagram we’ll include the following symbols:
Description Symbol
Operation: is when the process has
materials transformation, or involves
any action or activity for the creation
of products.
Inspection: is when we check how the
process is going and also the quality of
the product during the manufacturing
process.
Combined: this is an operation-
inspection step and is used when in the
process you have to check the
products during an operation.
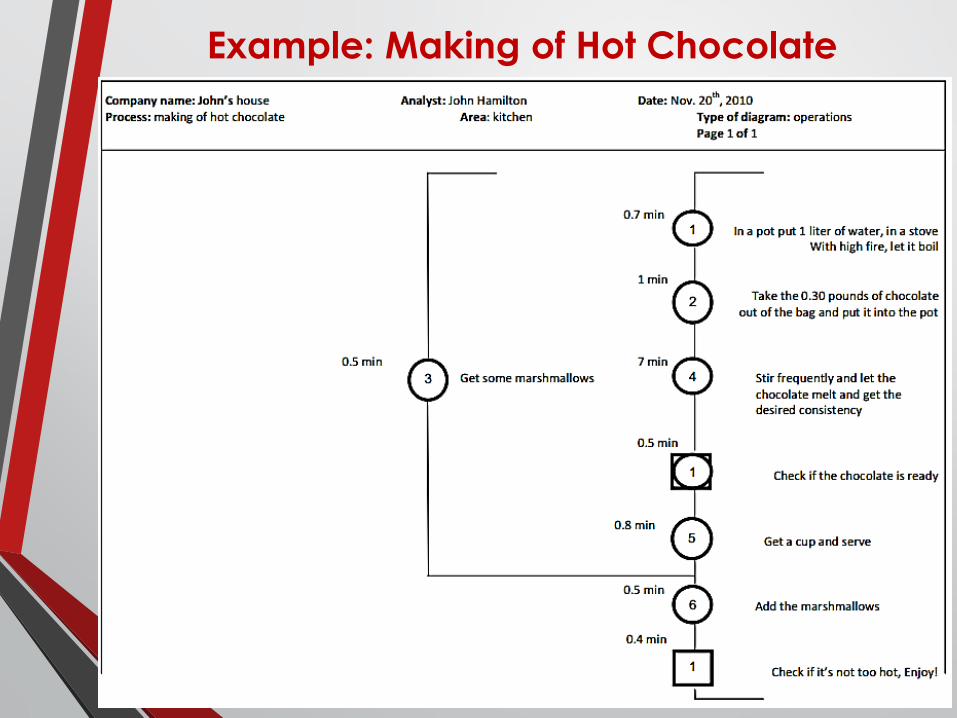
Example: Making of Hot Chocolate

Process Flow Diagram
• The process flow diagram is a graphic
representation of the steps that follows a
chronologic sequence of activities in a process or
procedure, identifying them with symbols
according to its nature, and also includes all the
considered important information that is needed
for analysis.
• This helps us discover and eliminate waste and
delays, making the process more efficient and
increase the productivity in the manufacturing
industry.

Process Flow Diagram
• The additional activities that appear in this
diagram are:
Description Symbol
Delay: this is used when nothing is
being done in the process, It could be
the wait for other parallel process to
finish before adding the product to
the assembly line.
Transportation: is when the product is
moved more than 1.5 meters to the
next step. This is because the human
body can move something from one
side to other between 0 and 1.5 m and
its irrelevant according to standards.
Stored: this is used at the beginning of
the process when the materials are
taken from the raw materials storage
and at the end of it in the finished
product storage.

Process Travel Diagram
• This diagram uses the same symbolism as
the process flow and also the same
structure, the only difference is that we
draw the diagram in a plan view of the
manufacturing plant.
• Remember to always draw the symbols in
a 1 cm2 area. This is a standard for all the
diagrams that you’re going to draw.

Example: Production of Ketchup

Summary (Process Travel Diagram)