1 presentation overview the national economic recession has had significant impacts on the rio...
TRANSCRIPT

1
Presentation Overview
• The national economic recession has had significant impacts on the Rio Rancho economy, which can be seen in employment levels, a sharp decline in construction activity, and a surge in home foreclosures.
• While the impact on the local economy was experienced on a delayed basis, due to unprecedented levels in housing construction, the effects of the recession locally have been significant and continue to weigh onGeneral Fund revenues.

2
National Economy
• The National Bureau of Economic Research is expected to declare the end of the worst recession since the Great Depression as of June 30, 2009, with real GDP showing positive growth in the second half of the year.
• This growth has been supported by an improvement in financial conditions, stimulus from monetary and fiscal policies, and a recovery in foreign economies.
• However, despite the turnaround in economic output, employment continued to decline in the second half of 2009. The U.S. unemployment rate reached 10 percent by the end of the year (the highest level since the early 1980s) before declining in January.

3
New Mexico and Local Economy
• The Bureau of Business and Economic Research (BBER), the state economic forecaster, believes that the New Mexico recession continues due to negative job growth, which is expected to persist through the second quarter of 2010.
• The latest BBER report notes that the Albuquerque Metropolitan Statistical Area (MSA), which includes Rio Rancho, remained in a “deep recession”, describing this as the “worst the metro area has experienced in many decades”.
• BBER expects the Albuquerque MSA to remain in recession through the first quarter of 2010 and does note anticipate sustained growth in non-residential construction, manufacturing, or housing until 2011.
• This economic situation is largely driving the declines in the City’s General Fund revenues in the near term and the below average growth forecast over the next five years.

4
• U.S. unemployment has increased dramatically to over 10% by the end of 2009. • While local unemployment levels have remained below national levels, they have
increased from record lows in 2008 to 8.3% in December of 2009, a 22-year high.• The increase in unemployment locally ties back to the huge wave in housing
construction activity in 2004 through 2007. Following 4 years of growth that resulted in the creation of 14,000 new jobs, the construction industry has lost 6,600 jobs in the one year ending December 2009.
• BBER forecasts local unemployment rate to decline over the next two years, leveling off around the 6% level in 2014, though well above the 3.3% experienced in 2007.
Unemployment Rate Actual and Forecast
0
2
4
6
8
10
12
2005Q1 2005Q4 2006Q3 2007Q2 2008Q1 2008Q4 2009Q3 2010Q2 2011Q1 2011Q4 2012Q3 2013Q2 2014Q1 2014Q4
Per
cen
t
Albuquerque Metro Area New Mexico National
Forecast Begins Here
Source: NM BBER and U.S. Bureau of Labor Statistics

5
• Personal income statewide and locally has fallen steadily since the end of 2007 and experienced overall negative growth in 2009.
• Personal income plays a major role in determining GRT revenues.• BBER forecasts positive growth in personal income over the next five years,
though it is yet to be seen if the growth in personal income will translate to increased consumer spending, as consumer confidence remains low.
• Additionally, as you can see from charts, the growth rates are well below the long-term 5% average growth rate, ranging from 3.2% to 4.6% by 2014.
Personal Income Y.O.Y Percent Change
-4
-2
0
2
4
6
8
2007Q1 2007Q3 2008Q1 2008Q3 2009Q1 2009Q3 2010Q1 2010Q3 2011Q1 2011Q3 2012Q1 2012Q3 2013Q1 2013Q3 2014Q1 2014Q3
New Mexico Albuquerque_MSA
Forecast Begins Here
Source: NM BBER

6
Housing Construction BoomRio Rancho Single Family Housing Starts, Annual Totals
0
500
1000
1500
2000
2500
3000
3500
1985 1986 1987 1988 1989 1990 1991 1992 1993 1994 1995 1996 1997 1998 1999 2000 2001 2002 2003 2004 2005 2006 2007 2008 2009
Source: City of Rio Rancho
Rio Rancho Single Family Housing Starts
0
500
1000
1500
2000
2500
1985-2003 Average 2004-2006 Average 2007-2009 Average
Source: City of Rio Rancho
• After unprecedented growth in Rio Rancho housing starts during 2004 through 2006, annual housing starts returned to historical levels, declining from a little over 1,000 in 2007 to 715 in 2008, and 688 in 2009.

7
• As we look to the future, Rio Rancho housing construction should begin to more closely reflect national economic trends, as housing construction returns to more normal levels.
• U.S. housing starts saw a dramatic decline in 2008 and 2009, but are forecasted to recover slowly over the next three years.
Single Family Housing Starts
0
500
1000
1500
2000
2500
3000
3500
2004 2005 2006 2007 2008 2009 2010 2011 2012
U.S. (in thousands) Rio Rancho
Forecast Begins Here
Source: City of Rio Rancho, U.S. Census, and Mortgage Bankers Association

8
• New Mexico foreclosures have increased steadily since the end of 2007, with the number of Foreclosures Started reaching the highest level in at least 6 years at the end of the third quarter of 2009. While the number of Foreclosures Started declined in the fourth quarter, the overall number of mortgages due over 30 days increased.
• As you can see from the chart, there is a very strong correlation between unemployment and foreclosures. Unfortunately, state and local unemployment levels are expected to remain relatively high in the foreseeable future.
NM Foreclosures and Unemployment
0
0.1
0.2
0.3
0.4
0.5
0.6
0.7
0.8
0.9
1
Q1_2003 Q4_2003 Q3_2004 Q2_2005 Q1_2006 Q4_2006 Q3_2007 Q2_2008 Q1_2009 Q4_2009 Q3_2010 Q2_2011
0
1
2
3
4
5
6
7
8
9
10
Mortgage Foreclosures Started: New Mexico (NSA, %) Unemployment Rate (RHS)
Source: Mortgage Bankers Association and BBER
Forecast Begins Here

9
5-Year Financial Plan:
Impact of Economic Recession and Recovery
• Looking at General Fund revenue and expenditures over the next five years, Rio Rancho is facing a structural budget deficit.
• Expenditures are expected to exceed revenues over the next couple of years.
• Due to revenue declines in FY08 and FY09, reserve balances have been drawn upon and are now at the state required minimum level.

10
City Expenditure Comparison
$1,211
$987
$866 $865
$671
$-
$200
$400
$600
$800
$1,000
$1,200
$1,400
Expenditures per Capita
Farmington Santa Fe Las Cruces Albuquerque Rio Rancho
• While overall expenditures in salaries and benefits have grown considerably over recent years, it is important to note that the City of Rio Rancho employment and overall expenditure levels are extremely lean compared to other major New Mexico cities relative to its population.
19 19
15
12
9
-
2
4
6
8
10
12
14
16
18
20
FTEs per 1,000 Population
Santa Fe1 Farmington Las Cruces Albuquerque Rio Rancho

11
Revenues
• Gross receipts (GRT) and property taxes make up over 70% of General Fund Revenues and drive overall changes.
• General Fund revenues decreased 12% in FY09 due to sharp fall in GRT, but are currently forecasted to remain little changed in FY10 and FY11. The 5-year forecast shows overall revenues increasing an average of 7%, as the local economy slowly recovers.
General Fund Revenues by Type (FY09 Actuals)
GRT Property Tax Service Charges Franchise Fees Other

12
• Gross Receipts Tax is the single largest revenue into the General Fund, making up an average of 56% in the recent past.
• GRT is largely driven by construction and retail activity, as shown in the graph. • In FY07, GRT from construction increased significantly, making up 43% of the total,
but declined in recent years, due to the impacts of the recession. During the same period, the retail contribution to GRT increased in FY08 and FY09 to the 40% level.
• Due to the makeup of GRT, the outlook for employment, income and housing play a significant role in estimating gross receipts revenue over the next five years and mirrors the moderate recovery projected by BBER.
Total Rio Rancho GRT by Sector and Fiscal Year
$0
$5, 000, 000
$10, 000, 000
$15, 000, 000
$20, 000, 000
$25, 000, 000
$30, 000, 000
$35, 000, 000
$40, 000, 000
FY05 FY06 FY07 FY08 FY09
Constr uction Retai l Ser vices Other

13
Property Tax and Other Revenue
• Property Tax Revenue has made up approximately 16% of total revenue over the last five years, increasing to 22% in FY09. Property tax revenue is forecast to grow 6.5% in the near term based on actual net taxable property values and 8.5% in the out years, closer to long-term average growth rates.
• Other Revenue. The remaining General Fund revenues are forecast to decline slightly in FY11 and grow 5% in the out years.

14
General Fund Spending
Materials & Services
22%$11 million
Salaries & Benefits
78%$39 million
We are a service organization. Our budget is 77.8% salaries and benefits. Our Materials and Services budget has been significantly reduced from FY08 to FY10 ($11.7M to $10.7M).

15
General Fund Expenditures• Since the economic slowdown, the Governing Body objective has been to provide the
same level of service and avoid furloughs or lay-offs of personnel. This has been done by 1) freezing positions; 2) reducing materials and services; and 3) utilizing one-time transfers back to the General Fund.
• Due to these measures, overall budgeted expenditures were reduced by 11.2% in FY09 and are expected to decline an additional 7.9% in FY10. The 5-year expenditure forecast is largely driven by salary and benefits, as this makes up over 77% of the overall General Fund expenditures.
• Salaries and Benefits. Staff forecast assumes little growth in salaries and benefits in FY11. Two different overall growth rates can be used for years 2012 to 2015 for salaries and related benefits.
– Scenario A: Assumes overall growth rate of 1%. This includes no salary increases, an anticipated 11% increase in health benefits, and no additional positions.
– Scenario B: Assumes overall growth rate of 4.7%. This includes a 4% salary increase for all employee groups starting in 2012, an anticipated 11% increase in health benefits, and no additional positions.
• Material and Services and Services. The City reduced its overall expenditures in Materials and Services in FY09 and FY10, and continues to look for ways to reduce these expenses, including further savings in contracts and operating efficiencies.

16
Possible Actions to Address Deficit
• Expenditures are expected to exceed revenues in the coming years, with an estimated total shortfall over the 5-year period of up to $3 million, depending on assumptions used.
• Recent years have been subsidized by fund balances, however those balances have been exhausted and now stand at statutorily required levels.
• In the long-term, as noted in our strategic plan, the City of Rio Rancho must continue its efforts in expanding and diversifying its economic base through economic development efforts such as those pursued in recent years.
• Options to address long-term structural deficit include:
– Increase revenues, examples include:• Gross Receipts Tax • Development Fees • Red light Cameras • Franchise Fees• Program Fees
– Reduce expenditures further• Service Prioritization• Salaries & Benefits• Materials & Services
17
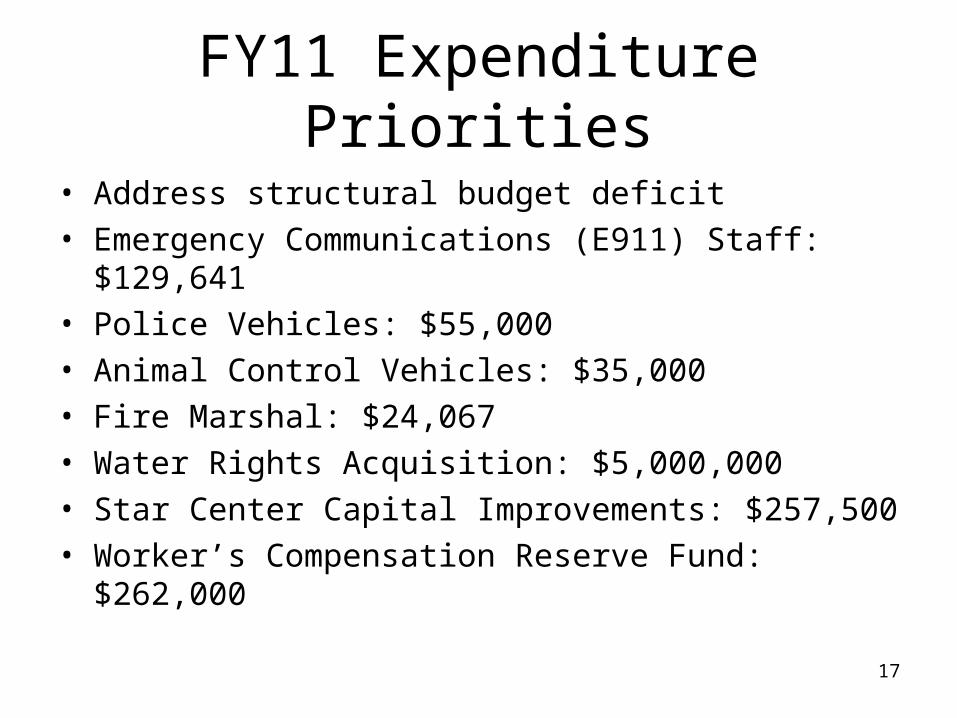
FY11 Expenditure Priorities
• Address structural budget deficit• Emergency Communications (E911) Staff: $129,641• Police Vehicles: $55,000• Animal Control Vehicles: $35,000• Fire Marshal: $24,067• Water Rights Acquisition: $5,000,000• Star Center Capital Improvements: $257,500• Worker’s Compensation Reserve Fund: $262,000