1 power management of hybrid micro grid system by a
TRANSCRIPT

1
Abstract—This paper presents a generic centralized supervisory control scheme
for the power management of multiple power converters based hybrid micro-grid
system. The system consists of wind generators, photovoltaic system, multiple parallel
connected power converters, utility grid, ac and dc loads. Power management of the
micro-grid is performed under two cases: grid mode and local mode. Central
supervisory unit (CSU) generates command signal to ensure the power management
during the two modes. In local mode, the dc loads in the ac-dc hybrid system can be
controlled. In the case of grid mode operation, power flow between the utility grid and
micro-grid is controlled. A novel feature of this paper is the incorporation of the
multiple power converters. The generated command signal from the CSU can also
control the operation of the multiple power converters in both grid and local modes. An
additional feature is the incorporation of sodium sulfur battery energy storage system
(NAS BESS) which is used to smooth the output power fluctuation of the wind farm.
The effectiveness of the control scheme is also verified using real time load pattern. The
simulation is performed in PSCAD/EMTDC.
Key words— Central supervisory unit, micro-grid, NAS battery, power smoothing,
power management, wind turbine.
1. INTRODUCTION
The ever increasing energy consumption and demand for electricity has taken
the present power scenarios towards Distributed Generation. The growth of wind and
photovoltaic power generation has increased rapidly [1-2]. Both wind and solar are
Power Management of Hybrid Micro-grid System by a Generic
Centralized Supervisory Control Scheme
Mir Nahidul Ambia, Ahmed Al-Durra*, Cedric Caruana, and S. M. Muyeen
Electrical Engineering Department, The Petroleum Institute, P.O.Box 2533, Abu Dhabi, UAE
E-mail*: [email protected], contact no: +97126075511.

2
considered as prospective energy sources individually; however, hybrid systems have
the potential of providing better quality and reliability to the customers. Distributed
generation also reduces the need of transmitting power over long distances. A new form
of small, independent power system interface known as micro-grid has become popular
nowadays. Small modular sources like wind, photovoltaic, fuel cells, batteries,
electrolyzer, and diesel generators can be connected to form a micro-grid [3-11].
A micro-grid is more suitable for isolated or standalone systems as renewable
energy is the most viable source of energy. A rapidly growing interest for micro-grids
was observed in recent years. Micro-grid can be controlled to manage the power in the
system with or without power exchange with the utility grid by appropriate control
schemes. Micro-grids can be operated in different modes: grid mode and local mode. In
grid mode, energy is exchanged between the utility grid and the micro-grid to balance
the local demand and generation. Basically in this mode, the utility grid absorbs or
provide power to the micro-grid based on the demand. In local mode, the micro grid
balances the power independent of the utility grid [12]. In local mode, the utility grid
does not provide or absorb any power from the micro-grid. In this mode, the micro-grid
depends only on the renewable energy (wind power and solar power). In local mode, if
demand of micro-grid is greater than the local generation system (WT and SP) dc loads
can be controlled for power load shedding to balance the power in the whole system.
The proposed CSU controls the dc load for load shedding to maintain the stability of the
system.
Power management is one of the major issues in micro-grids where variations of
the loads and generations are significant in the system. Various researches are going on
the micro-grid power management issues. Several studies have been reported to balance
the power in micro-grid in recent studies [13-15]. Power control and management in

3
hybrid ac-dc micro-grid is discussed in [16]. Real and reactive power control strategies
of electronically interfaced multiple generation micro-grid systems are addressed in
[17]. Power management and power flow control between utility and micro-grid
through back-to-back converters has been shown in [18]. Voltage-power droop control
scheme is presented in [19] which allow several voltage source converters (VSCs) to
operate in parallel in a micro-grid system. Reliability is another major issue to be
ensured in a micro-grid system [20]. In the existing work of micro-grids it has been seen
that a common power converter connects the ac and dc bus. Using a single power
converter in the micro-grid reduces the reliability of the micro-grid. If due to any
transient fault or any disturbance the single power converter stops operating or shuts
down for maintenance then a part of micro-grid has to be disconnected which surely
reduces the reliability of the micro-grid system. Also a micro-grid operates in local and
grid modes so the power needs to be balanced always. In this paper, a multiple
converter scheme is proposed where multiple converters operate in the micro-grid.
Instead of using one large size power converter unit, multiple small units are utilized.
So, according to the generation, one single converter would operate and if the rated
power of the unit is exceeded then the alternate converter unit would be enabled. This
scheme not only increases the reliability of the system, but also increases the efficiency
of the converters. The present schemes in the existing papers focus on different methods
which are complex and expensive. In this paper, the proposed central supervisory
control scheme, controlling and calculation of multiple converters are done which is
simple and cost effective. The reference signals generated from the controller needs to
be sent using the communication system which is part of the modern smart micro-grids.
The proposed scheme also ensures the power management during local and grid modes
where the grid power is controlled during grid mode and dc load is controlled during
local mode in addition with the multiple converter control.

4
Wind power is considered to be one of the most promising renewable sources of
energy; however the generated electrical power has randomly varying and intermittent
characteristics. The smoothing of the wind power fluctuations has become one of the
major issues of micro-grid systems. Wind power fluctuation can be smoothened up to
certain range by the blade pitch angle control of the wind turbine [21]. It is reported in
[22-23] that superconducting magnetic energy storage (SMES) system can be used to
smoothen the wind power fluctuation. A flywheel energy system is proposed in [24-25].
Energy capacitor system (ECS) composed of power electronic devices and electric
double layer capacitors (EDLC) has been proposed for smoothing the wind power
fluctuation in [26-28]. A battery energy storage system (BESS) [29] has been reported
to smooth the power fluctuation. Also, if BESS is integrated with STATCOM, then this
integration technique can provide both real and reactive power quite well [30]. Sodium
sulfur (NAS) battery is an advanced secondary battery developed by Tokyo Electric
Power Company (TEPCO) and NGK Insulators, Ltd. since 1983 [31]. It is reported in
[31] that NAS battery is the most suitable one for use in large scale battery energy
storage system due to its long life cycle and outstanding efficiency.
This paper presents the power management of an ac-dc hybrid micro-grid
system by incorporating a generic centralized supervisory control scheme. The major
feature of this paper is mentioned below:
1. In local mode, the CSU generates reference signals for the power converters and
dc loads. The reference signals are generated in such a way that the power is
balanced in the system.
2. In grid mode, CSU generates reference signals for power converters which
indirectly control the power flow between utility grid and micro-grid ensuring
power balance.

5
3. In both modes, reference signals are generated for multiple power converters.
Alternate power converters are enabled if any individual power converter rating
is crossed controlling the real power and terminal voltage of the system.
4. Sodium sulfur (NAS) battery energy storage system is integrated with a fixed
speed wind turbine generator system to smooth the output power fluctuation of
the wind farm using real wind speed data.
2. Proposed Micro-grid System Configuration
A hybrid micro-grid system is used in this paper which is extracted from the
benchmark system of the IEEE standard 399-1997 [32], with some modifications to
allow the grid and islanded operation of micro-grid as shown in Fig. 1. The proposed
system consists of an ac bus on the left and dc bus on the right side. The ac and dc buses
have corresponding sources, loads, and energy storage systems.
Fig. 1. Proposed ac-dc hybrid micro-grid model system
On the ac bus, seven induction generators of 1MW driven by wind turbines and
two ac loads are connected. Capacitor banks are used at the induction generator
terminals to maintain unity power factor operation at the rated wind speed. A Sodium
sulfur battery energy storage system (NAS BESS) is connected at the common terminal
point of the wind generators. On the dc bus photovoltaic system, energy storage system
(ESS), and three dc loads are connected. ESS at the dc bus is used to provide backup
power to the dc loads if required which is not included in this paper. Two energy
storage systems are needed for bigger plants where the dc loads are critical loads. The
ac bus is connected to the utility grid through a transmission line TL1 and a transformer.
The photovoltaic system is connected with the dc bus via dc-dc converter to extract
maximum power. In between the ac bus and dc bus multiple power converters,
connected in parallel are used. The power converters allow the transfer of power

6
between the dc and the ac sides. In the simulation, two power converters are used with
individual rating of 2.5MW. The power converter modeled in the simulation can also
operate in DC/AC mode (inverter mode), however, due to avoid confusion and for
better understanding of the main focus of the paper, any case with inverter mode is not
included in the manuscript.
3. Component Modeling of the Micro-grid System
3.1. Wind Turbine Modeling
Wind turbines capture kinetic energy from the wind and convert it into electrical
energy. The wind turbine output torque and extracted power can be expressed by the
following equations [33]:
][)(2
1 3WAVCP WPm
(1)
where ρ is the air density [kg/m3], R is the radius of the blade [m], VW is the
wind speed [m/s], A is the cross sectional area of the turbine [m2]. CP (λ,β) is the power
coefficient given by
17.02 )6.502.0(2
1),( eCP
(2)
where, )1609(
)3600(
R
and w
m
V
R
is the tip speed ratio.
m represents the rotor mechanical speed and is the pitch of the rotor blades.
Pitch control allows limiting of the generator power at wind speed higher than the rated.
3.2. Photovoltaic System Modeling
Photovoltaic systems convert solar radiation into electrical energy. A practical
Photovoltaic system can be modeled by a current source in parallel with a diode and a

7
combination of a series resistance and a parallel resistance [34]. The current source
represents the photo current, which is a function of incident solar radiation and
temperature. The diode represents the reverse saturation current due to the p-n junction
of the solar cell while the resistances account for the losses [34].
3.3. NAS Battery
Sodium sulfur (NAS) battery model consists of a variable voltage source with a
series resistance. The voltage is modeled to drop linearly with the state of charge (SOC)
of the battery. Assuming that the battery charge is at 65%, the battery voltage is given
by (3) where V0 is the voltage of the open circuited fully charged battery [31]. The
voltage drop across the battery resistance is assumed to be a constant percentage of the
battery voltage as shown in (3).
05.0
95.0 0
battNAS
batt
VIR
VV
(3)
In this work detailed switching model is considered instead of time averaged
model; therefore, the proposed model is simplified a little to speed up the simulation.
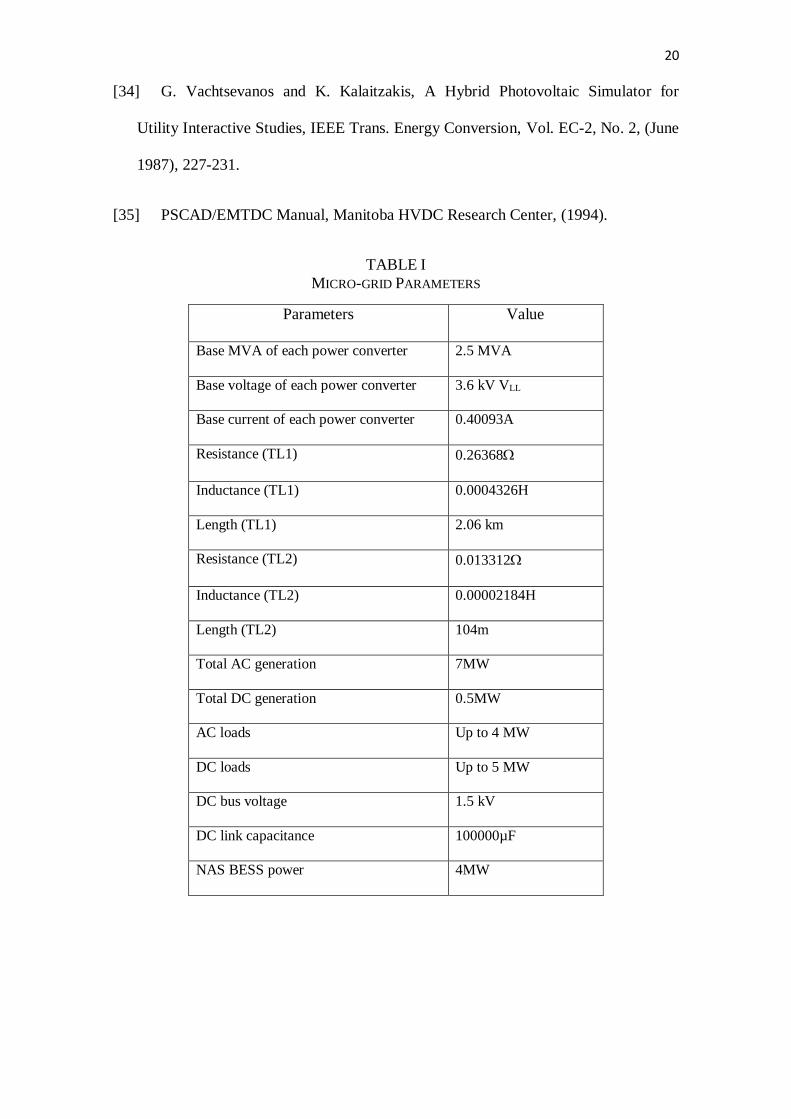
The parameters of the proposed micro-grid system are shown in Table I. The total ac
generation is chosen as 7MW. The parameters of the induction generators used are
given in Table II. The NAS battery energy storage system (NAS BESS) is rated at
4MW. A fixed reference of 5MW is used for smoothing the output power fluctuation of
the wind farm. The photovoltaic system generates a constant 0.5 MW.
4. Power Smoothing Control Scheme using NAS Battery
The wind power smoothing is performed by the NAS battery energy storage
system at the terminal point of the wind turbine generators. The schematic diagram of
the integrated NAS BESS is shown in Fig. 2. The total capacity of the sodium sulphur

8
battery energy storage system is 4MW/2.857MWh. The voltage controlled pulse width
modulation based voltage source inverter is used in the system along with dc-dc
buck/boost converter. The voltage controlled voltage source inverter (VC-VSI) controls
the terminal voltage and maintains it at 1 pu. It also controls the dc link voltage between
the VC-VSI and dc-dc buck/boost converter. The control strategy of the dc-dc buck
boost converter is shown in Fig. 3. The error signal between the line power, Pline, (shown
in Fig. 2) and reference (smooth) power is fed to the PI controller.
Fig. 2. Schematic diagram of Integrated NAS BESS
Fig. 3. Control block of the dc-dc buck/boost converter.
5. Generic Centralized Supervisory Control Strategy
Generic centralized supervisory control strategy based on parallel connected
multiple power converters is proposed in this paper, which is a novel feature of this
study. The control scheme is called generic as it is applicable to wide range of loading
conditions. The central supervisory unit is designed based on the control scheme which
generates the necessary command signals to perform power management in the ac-dc
hybrid micro-grid system. The CSU also supervises the command signals to real and
reactive power controllers of the individual power converter unit, as detailed in the
following section.
5.1.Central Supervisory Unit (CSU)
The central supervisory unit is the core of the ac-dc hybrid micro-grid system.
The CSU is designed for both the grid and local modes. The main focus of this control
scheme is to ensure power management in the system and control the multiple power
converters during both cases. In local mode, power management is ensured by
controlling the dc loads. In Fig. 1, the proposed model system consists of multiple
power converters and three dc loads. For this mode, the consumption of dc loads can be

9
controlled to maintain power management in the system. Multiple power converters are
controlled by controlling the real power. For grid mode operation, only real power
through the multiple power converters is controlled. This indirectly controls the power
flow between utility grid and micro-grid. The terminal voltage at the converter is
controlled for both modes. Figure 4(a) shows the basic diagram of the central
supervisory unit for both operating modes.
Fig. 4. (a) Central supervisory unit for local mode and grid mode (b) control scheme of
real and reactive power through individual power converter.
During local mode operation, CSU generates command signal for the total dc
loads, i.e. PLDCT. The CSU also generates, for both modes, the real power command
signals PC1, PC2 up to PCn for the power converters. The real power through each power
converters is adjusted according to the demand. For example, if the rated power of each
power converter is 2.5MW and total power passing through the power converters is 2
MW then the 1st converter operates. If the total power passing through the power
converters is 3MW then the 1st and 2nd converters operate. If total power through the
power converters is 5.5 MW then the 1st, 2nd and 3rd converters operate. This aims to
improve the system efficiency. The command signals generated from the CSU in grid
mode automatically control the power flow between utility grid and micro-grid. Figure
4(b) shows the control block diagram of individual small power converter units, where
phase lock loop (PLL) provides the angle PLL for the abc-to-dq0 and dq0-to-abc
transformation. The d-axis current controls the real power while the q-axis current
controls the reactive power of the converter.
5.1.1. Local Mode
In local mode, ac loads connected in the ac-dc hybrid micro-grid system and the
smoothened wind power are taken as input to the CSU. The details of the control
scheme for local mode are shown in Fig. 5(a) which is the core work for local mode. In

10
order to calculate the power flow through the multiple power converters, first the ac
loads in the micro-grid system are calculated in the first three steps. PLAC indicates the
individual ac load demand in the system, G is the conductance, VtL is terminal voltage at
the ac load and PG is the base power. PLACT indicates the total ac load demand in the
system. PTotal indicates the amount of the power to be passed through the total
converters. In practice, the total ac load can be measured from the system.
Fig. 5. Generic centralized control strategy of CSU (a) local mode (b) grid mode.
Comparing to the value of PTotal with the individual converter unit rating, the
command signals, PC1, PC2 and PCn for the multiple power converters are generated in
the system. The symbol n determines the number of multiple converters used in the
system. The powers through the total converters are summed with dc source of
photovoltaic system to obtain the total power flow to the dc loads i.e. PTotal+PPV. The
command signal for changing total dc loads PLDCT is generated from CSU. The total dc
load is changed by ESS connected at the dc bus depending on the generated command
signal.
5.1.2. Grid Mode
For this case, the power management through control of the power flow between
utility grid and micro-grid system is shown in Fig. 5(b) which is the core work for grid
mode. In this case, ac and dc load consumptions in the ac-dc hybrid micro-grid system
are taken as input to the central supervisory unit. The total real power PTotal, into the
power converters is calculated where PTotal=PLDC-TOTAL-PPV and it is compared with the
rating of the small unit power converter PRated. PLDC-TOTAL indicates the total dc load
consumption and PPV indicates the power generated from the photovoltaic system.
Through calculation of the amount of power to be passed through the power converters,

11
the utility grid power is automatically controlled by the CSU ensuring the power
management in the system.
6. Simulation Results
To verify the effectiveness of the proposed system, simulation analysis has been
performed. Real wind speed data measured in Hokkaido Island, Japan is shown in Fig.
6. Wind farm aggregated model is considered in the simulation. The simulations have
been performed by using PSCAD/EMTDC [35].
Responses of the fluctuating output power of the wind farm, along with the
smooth line power, photovoltaic output power, real power and reactive power provided
by the voltage source inverter with NAS battery ESS are shown in Figs.7 and 8. The
blue color trace in Fig. 7 shows the fluctuating wind farm power output and an almost
straight line in brown color shows the smooth wind farm output Pline at 5MW. DC link
voltage of NAS BESS inverter is shown in Fig. 9. Terminal voltage at PCC of NAS
BESS and grid side is shown in Fig. 10. Fig. 8 (Real and reactive power of VSI with
BESS) indicates the performance of the dc-dc converter. As it can be seen from Fig. 3
(Control block of the dc-dc buck/boost converter) that dc-dc converter controls the Pline
with reference to Pref and the result of controlled Pline is depicted in Fig. 7 (smoothen
power). Basically the whole BESS including VSI and dc-dc converter controls the
terminal voltage (Fig. 10), dc link voltage (not shown in the simulation results) and
smoothen power (Fig. 7). (2) The wind power Pline which is the smoothen power is
controlled by the dc-dc converter. The wind power (the output of the wind farm before
connecting point with battery energy storage system) depends on wind speed. As it can
be seen from Fig. 6 and 7, that PIG wind farm actually follows the pattern of wind speed
from Fig. 6. However, the smoothen power Pline follows the reference Pref (Fig. 3). The
smoothen power is controlled because the fluctuated wind power PIG wind farm might
12
cause fluctuation in the frequency of the system. Specially during change over from grid
connected to islanding mode and vice-versa, the micro-grid frequency may result to
fluctuation because of fluctuated wind power. The smoothen power from the battery
energy storage system keeps the systems stable specially during any faulty or critical
condition like islanding mode. Detailed control and simulation results except the major
part of the dc-dc converter are not shown as it is not main focus of the paper hence it is
an additional part. These responses show the effectiveness of the battery model in terms
of smoothing the fluctuating output power of the aggregated wind farm. The
effectiveness of the generic centralized supervisory control scheme to perform the
power management is tested for both grid – and local modes.
Fig. 6. Wind speed
Fig. 7. Wind farm output and smoothen power
Fig. 8. Real and reactive power of VSI with BESS
Fig. 9. DC link voltage of BESS
Fig. 10. Terminal voltage at PCC of NAS and grid
6.1. Local Mode
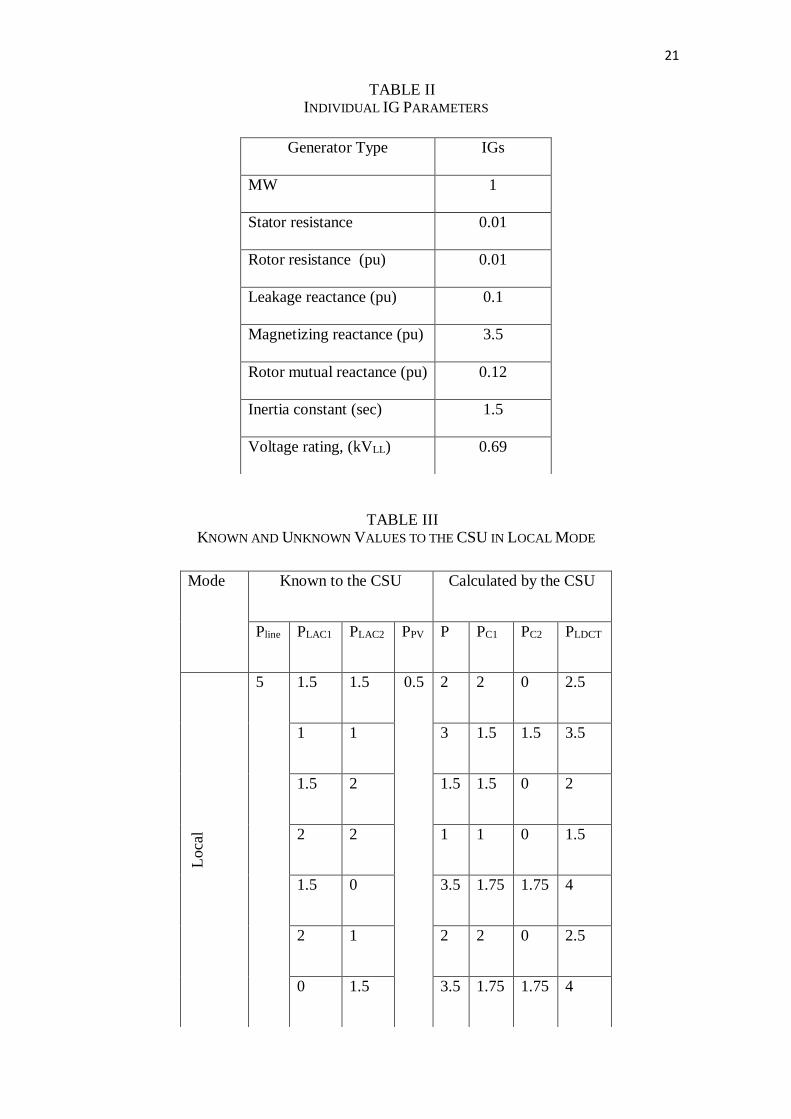
In section V, it is explained that for local mode operation, the CSU, generates
the command signals for the multiple converters and dc loads to ensure the power
management in the micro-grid system. To verify the effectiveness of central supervisory
unit a test case, involving a wide range of two ac loads PLAC1 and PLAC2 is considered.
The ac load values, the smooth power Pline and PPV are the known values to the central
supervisory unit. The CSU then calculates the real power flow required through the two
power converters PPC1, PPC2 and total value of the dc loads PLDCT (PLDC1+PLDC2+PLDC3).
All these values are summarized in Table III.

13
The generated command signals for the two power converters considered in the
simulation, PC1and PC2 are shown in Fig. 11. Figure 12 depicts the real power through
the power converters. It is observed from this response that the power through the two
power converters follow the command signals PC1and PC2 (Fig. 11). Figure 13 shows the
total ac and dc loads, PLACT and PLDCT in the system. It can also be observed from the
system that the CSU effectively adjusts the dc loads, PLDCT to ensure power
management.
Fig. 11. Command signal for converters in CSU for local mode
Fig. 12. Real power through power converters for local mode
Fig. 13. Ac and dc loads for local mode
6.2. Grid Mode
In this case, the proposed control scheme ensures the power management in the
ac-dc hybrid micro-grid system by the power flow control between utility grid and
micro-grid system. As for the previous mode, the effectiveness of the CSU is verified
with a test case where, a wide range of two ac loads PLAC1, PLAC2 and three dc loads
PLDC1, PLDC2, PLDC3 are considered. These values and PPV are the known variables to the
central supervisory unit. The required real power flow through the two power converters
is then calculated by the CSU hence automatically establishing the power flow between
utility grid and micro-grid system. All these values are summarized in Table IV.
Figure 14 depicts the command signals PC1and PC2 generated from the CSU. It is
seen from the response that when both of the power converters are turned on, the total
power through the converters is divided into two. In Fig. 15, the utility grid power is
shown which is controlled by the central supervisory unit. It can be seen from Fig. 16
that the power through the two power converters follows the reference signals. Total ac
and dc loads are shown in Fig. 17.

14
Fig. 14. Command signal for converters in CSU for grid mode
Fig. 15. Power flow control between grid and micro-grid for grid mode
Fig. 16. Real power through power converters for grid mode
Fig. 17. Ac and dc loads for grid mode
6.3. Real time load
A real time ac load pattern, PLACT is considered for the local mode. The load
pattern represents the load consumption of one commercial building. The real powers
PC1 and PC2 through the power converters are shown in Fig. 18. The central supervisory
unit performs the dc load control so that the power management is ensured in the
system. The total ac loads PLACT and the total dc loads PLDCT are shown in Fig. 19.
Fig. 18. Real power through power converters using real time ac load for local mode
Fig. 19. Real time ac load and adjusted dc loads for local mode
Similar to the previous case, a real time ac load pattern PLACT and real time dc
load pattern PLDCT are considered for the grid mode. The load consumption of a
refrigerator is used in this case for the analysis. The real time ac and dc loads are shown
in Fig. 20. The power flow between utility grid and micro-grid is shown in Fig. 21
which is controlled by the central supervisory unit. Figure 22 depicts the real power PC1
and PC2 through the power converters.
Fig. 20. Real time ac load and real time dc loads for grid mode
Fig. 21. Power flow control between grid and micro-grid for grid mode with real time ac
and dc load
Fig. 22. Real power through power converters using real time ac and dc load for grid
mode
7. Conclusion
In this paper, a generic centralized supervisory control scheme has been
proposed to ensure the power management in the ac-dc hybrid micro-grid system. The

15
effectiveness of the control strategy has been verified for grid and local modes of
operation with wide range of load and real time load. The significance of the paper is
mentioned below:
Large scale integration of wind farm and simple photovoltaic system in micro-
grid extracted from the benchmark system of the IEEE standard 399-1997 with
modifications.
The multiple converters are controlled precisely for both grid and local modes
with real time loads.
The proper utilization of the small units of the power converters increases the
efficiency of the converter units.
The grid power is controlled during grid mode. The dc loads are controlled
during local mode. Both functions are operated only be controlling the power
converter reference which is less complex and less expensive.
The dc load controlling refers to the power curtailment which is an option in the
event of a worst case scenario of micro-grids. But integration of ESS at dc side,
can solve the power curtailment issue by controlling the reference of the ESS at
dc side from proposed CSU which is again simple and less expensive.
The terminal voltage of the micro-grid is controlled by reactive power
compensation from the power converter.
Integration of NAS BESS performs smoothing of power which maintains the
frequency of the system throughout the grid and local modes.
It can be concluded that the proposed ac-dc hybrid micro-grid system integrated with
NAS BESS along with the incorporation of the centralized supervisory control strategy
turns the system into an enhanced stable and reliable hybrid system ensuring the power
management in the system.

16
References
[1] The Global Wind Energy Council, Global Wind Report, Annual market update
2010. Available: http://www.gwec.net/
[2] Trends in Photovoltaic Applications: Survey Report of Selected IEA Countries
between 1992 and 2004, International Energy Agency Photovoltaics Power Systems
Programme (IEA PVPS), Sep. 2005.
[3] N. K. Ardeshna and B. H. Chowdhury, Optimizing Micro-grid Operations in the
Presence of Wind Generation, Power Symposium, NAPS’08, 28-30 Sept. 2008.
[4] Anne-Marie Borbely and Jan F. Kreider, Distributed Generation: Power Paradigm
for the New Millennium; CRC Press., 2001.
[5] R. H. Lasseter, MicroGrids, PES Winter Meeting, vol. 1, pp. 305-308, 2002.
[6] X. Liu, P. Wang and P. C. Loh, A Hybrid AC/DC Microgrid and Its Coordination
Control, IEEE Trans. Smart Grid, Vol. 2, No. 2, (June 2011), 278-286.
[7] Y. Ito, Z. Yang and H. Akagi, DC micro-grid based distribution power generation
system, Proc. IEEE Int. Power Electron. Motion Control Conf., Aug. 2004, Vol. 3,
1740-1745.
[8] Y. Zoka, H. Sasaki, N. Yorino, K. Kawahara and C.C. Liu, An interaction problem
of distributed generators installed in a MicroGrid, Proc. IEEE Elect. Utility
Deregulation, Restructuring. Power Technol., Apr. 2004, vol. 2, 795-799.
[9] R. H. Lassester and P. Paigi, Microgrid: A conceptual solution, Proc. IEEE 35th
PESC, Jun. 2004, vol. 6, 4285-4290.
[10] C. K. Sao and P. W. Lehn, Control and power management of converter fed
MicroGrids, IEEE Trans. Power Syst., vol. 23, no. 3, (Aug. 2008), 1088-1098.

17
[11] T. Logenthiran, D. Srinivasan and D. Wong, Multi-agent coordination for DER
in MicroGrid, in Proc. IEEE Int. Conf. Sustainable Energy Technol., (Nov. 2008),
77-82.
[12] A. Burgio, D.Menniti and N. Sorrentino, The reliability studies of a novel
integrated configuration for micro-grids, International conference on Electric Utility
Deregulation and Restructuring and Power Technologies, (6-9 April 2008), 2634-
2639.
[13] C. M. Colson, and M. Hashem Nehrir, Comprehensive Real-time Microgrid
Power Management and Control With Distributed Agents, IEEE Trans. Smart Grid,
Vol. 4, No. 1, (March 2013), 617-627.
[14] A. Solanki, A. Nasiri, V. Bhavaraju, T. Abdullah, and D. Yu, A new control
method for microgrid power management, 2013 International Conference on
Renewable Energy Research and Applications (ICRERA), (20-23 Oct. 2013), 1212
– 1216.
[15] Le Yi Wang, Michael P. Polis, Caisheng Wang, Feng Lin, and George Yin,
Voltage robust stability in microgrid power management, 2013 IEEE 52nd Annual
Conference on Decision and Control (CDC), (10-13 Dec. 2013), 6928 – 6933.
[16] Navid Eghtedarpour and Ebrahim Farjah, Power Control and Management in a
Hybrid AC/DC Microgrid, IEEE Trans. Smart grid, Vol. 5, No. 3, (MAY 2014),
1494-1505.
[17] F. Katiraei and M. R. Iravani, Power Management Strategies for a Micro-grid
with Multiple Distributed Generation Units, IEEE Trans. Power systems, Vol. 21,
No. 4, (Nov. 2006), 1821-1831.

18
[18] R. Majmunder, A. Ghosh, G. Ledwich and F. Zare, Power Management and
Power Flow Control With Back-to-Back Converters in a Utility Connected
Microgrid, IEEE Trans. Power Systems, Vol. 25, No. 2, (May 2010), 821-834.
[19] C. K. Sao and P. W. Lehn, Control and Power Management of Converter Fed
Microgrids, IEEE Trans Power Systems, Vol. 23, No.3, (Aug, 2008), 1088-1098.
[20] I. Bae and J. Kim, Reliability Evaluation of Customers in a Micogrid, IEEE
Trans. Power Systems, Vol. 23, No.3, (Aug 2008), 1416-1422.
[21] T. Senjyu, R. Sakamoto, N. Urasaki, T. Funabashi, H. Fujita and H. Sekine,
Output power leveling of wind turbine generator for all operating regions by pitch
angle control, IEEE Trans. Energy Convers., vol. 21, no. 2, (Jun. 2006), 467-475.
[22] S. Nomura, Y. Ohata, T. Hagita, H. Tsutsui, S. Tsuji-Iio and R. Shimada, Wind
farms linked by SMES systems, IEEE Trans. Appl. Supercond., vol. 15, no. 2, (Jun.
2005), 1951-1954.
[23] F. Zhou, G. Joos, C. Abbey, L. Jiao and B.T. Ooi, Use of large capacity SMES
to improve the power quality and stability of wind farms, in Proc. IEEE Power Eng.
Soc. Gen. Meeting, vol. 2, (Jun. 2004), 2025-2030.
[24] R. Takahashi, Wu. Li, T. Murata and J. Tamura, An application of flywheel
energy storage system for wind energy conversion, Proc. Int. Conf. Power Electron.
Drives Syst. (PEDS 2005), 932-937.
[25] R. Cardenas, R. Pena, G. Asher and J. Clare, Power smoothing in wind
generations systems using a sensorless vector controlled induction machine driving
a flywheel, IEEE Trans. Energy Convers., vol. 19, no. 1, (Mar. 2004), 206-216.

19
[26] R. L. Spyker and R. M. Nelms, Optimization of double-layer capacitor arrays,
IEEE Trans. Ind. Appl., vol. 36, no. 1, (Jan./Feb. 2000), 194-198.
[27] T. Kinjo, T. Senjyu, N. Urasaki and H. Fujita, Output leveling of renewable
energy by electric double-layer capacitor applied for energy storage system, IEEE
Trans. Energy Convers., vol. 21, no. 1, (2006), 221-227.
[28] S. M. Muyeen, R. Takhashi, T. Murata and J. Tamura, Integration of an Energy
Capacitor System With a Variable-Speed Wind Generator, IEEE Trans. Energy
Convers., vol. 24, no. 3, (Sept. 2009), 740-749.
[29] S.M. Muyeen, M.H. Ali, R. Takahashi, T. Murata, and J. Tamura, Wind
generator output power smoothing and terminal voltage regulation by using
STACOM/BESS, in power Tech, 2007 IEEE Lausanne, (1-5 July 2007), 1232-1237.
[30] S. M. Muyeen, J. Tamura, and T. Murata, Stability Augmentation of a Grid-
connected Wind Farm, Springer-Verlag London, ISBN 978-1-84800-315-6,
(October 2008).
[31] M. Kamibayashi and K. Tanaka, Recent Sodium Sulfur Battery Applications,
Proc. IEEE PES Transmission and Distribution Conference and Exposition, USA,
2001, Vol. 2, (28 Oct.-2 Nov. 2001), 1169-1173.
[32] F. Katiraei, M. R. Iravani and P.W. Lehn, Micro-Grid Autonomous Operation
During and Subsequent to Islanding Process, IEEE Trans. On Power Delivery, Vol.
20, No 1, (January 2005).
[33] O. Wasynczuk etc, Dynamiac behavior of a class of wind turbine generators
during random wind fluctuations, IEEE Trans. on Power Apparatus and Systems,
Vol.PAS-100, No.6, (1981), 2854-2854.
20
[34] G. Vachtsevanos and K. Kalaitzakis, A Hybrid Photovoltaic Simulator for
Utility Interactive Studies, IEEE Trans. Energy Conversion, Vol. EC-2, No. 2, (June
1987), 227-231.
[35] PSCAD/EMTDC Manual, Manitoba HVDC Research Center, (1994).
TABLE I
MICRO-GRID PARAMETERS
Parameters Value
Base MVA of each power converter 2.5 MVA
Base voltage of each power converter 3.6 kV VLL
Base current of each power converter 0.40093A
Resistance (TL1) 0.26368
Inductance (TL1) 0.0004326H
Length (TL1) 2.06 km
Resistance (TL2) 0.013312
Inductance (TL2) 0.00002184H
Length (TL2) 104m
Total AC generation 7MW
Total DC generation 0.5MW
AC loads Up to 4 MW
DC loads Up to 5 MW
DC bus voltage 1.5 kV
DC link capacitance 100000µF
NAS BESS power 4MW
21
TABLE II INDIVIDUAL IG PARAMETERS
TABLE III KNOWN AND UNKNOWN VALUES TO THE CSU IN LOCAL MODE
Generator Type IGs
MW 1
Stator resistance 0.01
Rotor resistance (pu) 0.01
Leakage reactance (pu) 0.1
Magnetizing reactance (pu) 3.5
Rotor mutual reactance (pu) 0.12
Inertia constant (sec) 1.5
Voltage rating, (kVLL) 0.69
Mode Known to the CSU Calculated by the CSU
Pline PLAC1 PLAC2 PPV P PC1 PC2 PLDCT
Loca
l
5 1.5 1.5 0.5 2 2 0 2.5
1 1 3 1.5 1.5 3.5
1.5 2 1.5 1.5 0 2
2 2 1 1 0 1.5
1.5 0 3.5 1.75 1.75 4
2 1 2 2 0 2.5
0 1.5 3.5 1.75 1.75 4

22
TABLE IV KNOWN AND UNKNOWN VALUES TO THE CSU IN GRID MODE
Fig. 1. Proposed ac-dc hybrid micro-grid model system
Mood Known to the CSU Calculated by the CSU
PLAC1 PLAC2 PPV PLDC1 PLDC2 PLDC3 P PC1 PC2 PGRID
Gri
d
1.5 1.5 0.5 2 1.5 1 4 2 2 2
1 1 3 1 0 3.5 1.75 1.75 0.5
1.5 2 2 1.5 1.5 4.5 2.25 2.25 3
2 2 0 1 1.5 2 2 0 1
1.5 0 3 1.5 .5 4.5 2.25 2.25 1
2 1 2 .5 1 3 1.5 1.5 1
1.5 1.5 0 0 .5 0 0 0 -2
IG10.69/6.6KV
NAS BESS
IG70.69/6.6KV
PV DC/DC
Utility
Grid0.69/69KV
DC/DC ESS
0.69/3.6KV
DC
Load 1
DC
Load 2
DC
Load 3
0.69/6.6KV
PIG1
PIG7
PLAC1
PLAC2
PNAS
Pline
PC1
PC2
PCnPPV
PBESS
PLDC1 PLDC2 PLDC3
TL1
TL2
Vt Ia1
Ib1Ic1
Ian
Ibn
Icn
Ia2
Ib2Ic2
AC
Load 1
AC
Load 2
Ea
Eb
Ec
VtL
PGRID
PLACT
PLDCT

23
0.69/6.6KV
6.6/0.406KV
Voltage Controlled
PWM VSIDC-DC Buck/Boost
Converter
NAS
Battery
Energy
Storage
System
L=1mH
-
+
g1
g2
Pline
Fig. 2. Schematic diagram of Integrated NAS BESS
PI+ -
Comperator
g1
g2Pline
Pref
Fig. 3. Control block of the dc-dc buck/boost converter.
CSULocal mode
PC1 P
C2P
Cn
PLDCT
CSU (Central
Supervisory
Unit)
PI
- PI
Edn*
D
- N + N/D
+ PI PI
Pnth_conv
1
+
+
E qn*
-
Prated
P
-
Vt
Ea
Ec θPLL
Idn
Iqn
abc
Eb PLL dq0
Ian
CSUGrid mode
PC1 P
C2P
Cn
Real and reactive
power control
through individual
power converter
Ibn
Icn
Idn
Iqn
N/D
Prated
(a)
(b)
Fig. 4. (a) Central supervisory unit for local mode and grid mode (b) control scheme of real and reactive power through individual power converter

24
PTotal>PRated
PC1=PTotal/n
PCn=PTotal/n
PC1=PTotal
PCn=0 (n=2 to n)
end
Y N
PTotal=Pline-PLACT
Start
Rpu=Ractual/Zbase
Xpu=Xactual/Zbase
G=R2pu/ R
2pu +X2
pu
PLAC=G*V2tL*PG
PLACT =PLAC1+……….+PLACn
PLDCT=(PTotal+PPV)
PTotal>PRated
PC1=PTotal/n
PCn=PTotal/n
PC1=PTotal
PCn=0 (n= 2 to n)
end
Y N
PTotal=PLDCT-PPV
Start
PLDC=V2dc/RDC
Xpu=Xactual/Zbase
PLDCT =PLDC1+……….+PLDCn
(a)
(b)
0 50 100 150 200 250 300
8
9
10
11
12
13
14
Win
d S
peed
[m
/s]
Time [sec]
0 50 100 150 200 250 300
0
1
2
3
4
5
6
7
8
9
Po
wer
Gen
erat
ion
[M
W]
Time [sec]
PIG wind farm
Pline
Fig. 6. Wind speed
Fig. 7. Wind farm output and
smoothen power
0 50 100 150 200 250 300-4
-3
-2
-1
0
1
2
3
4
5
Rea
l an
d R
eact
ive
pow
er
[MW
and
Mva
r]
Time [sec]
QVSI BESS
PVSI BESS
Fig. 8. Real and reactive power of
VSI with BESS
0 50 100 150 200 250 300
0.96
0.97
0.98
0.99
1.00
1.01
1.02
1.03
Dc
link
volta
ge [
pu]
Time [sec]
Fig. 9. DC link voltage of BESS
0 50 100 150 200 250 300
0.980
0.985
0.990
0.995
1.000
1.005
1.010
1.015
1.020
Ter
min
al V
olta
ge [
pu]
Time [sec]
Fig. 5. Generic centralized control strategy of CSU (a) local mode (b) grid mode.

25
0 50 100 150 200 250 300
0.980
0.985
0.990
0.995
1.000
1.005
1.010
1.015
1.020T
erm
inal
Vol
tage
[pu
]
Time [sec]Fig. 10. Terminal voltage at PCC of NAS
and grid
0 50 100 150 200 250 300
-0.5
0.0
0.5
1.0
1.5
2.0
2.5
3.0
3.5
Po
we
r in
Co
nve
rte
rs [
MW
]
Time [sec]
PTotal
PC1
PC2
Fig. 11. Command signal for converters in
CSU for local mode
0 50 100 150 200 250 300
-0.2
0.0
0.2
0.4
0.6
0.8
1.0
1.2
1.4
1.6
1.8
2.0
2.2
Pow
er in
Con
vert
ers
[MW
]
Time [sec]
PC1
PC2
Fig. 12. Real power through power converters for local mode
0 50 100 150 200 250 300
1.0
1.5
2.0
2.5
3.0
3.5
4.0
4.5
Loa
d C
onsu
mpt
ion
[MW
]
Time [sec]
PLACT
PLDCT
Fig. 13. Ac and dc loads for local mode
0 50 100 150 200 250 300
1.0
1.5
2.0
2.5
3.0
3.5
4.0
4.5
Loa
d C
onsu
mpt
ion
[MW
]
Time [sec]
PLACT
PLDCT
Fig. 14. Command signal for converters in
CSU for grid mode
Fig. 15. Power flow control between grid and micro-grid for grid mode
Fig. 16. Real power through power
converters for grid mode Fig. 17. Ac and dc loads for grid mode
0 50 100 150 200 250 300
0
1
2
3
4
5
Pow
er in
Con
vert
ers
[MW
]
Time [sec]
PTotal
PC1
PC2
0 50 100 150 200 250 300
-4
-3
-2
-1
0
1
2
3
4
Pow
er in
Gri
d [M
W]
Time [sec]
0 50 100 150 200 250 300
-0.5
0.0
0.5
1.0
1.5
2.0
2.5
Pow
er i
n C
onve
rter
s [M
W]
Time [sec]
PC1
PC2
0 50 100 150 200 250 300
0.0
0.5
1.0
1.5
2.0
2.5
3.0
3.5
4.0
4.5
5.0
5.5
Loa
d C
onsu
mpt
ions
[MW
]
Time [sec]
PLACT
PLDCT

26
Fig. 18. Real power through power converters using real time ac load for local
mode
Fig. 19. Real time ac load and adjusted dc
loads for local mode
Fig. 20. Real time ac load and real time dc
loads for grid mode Fig. 21. Power flow control between grid and
micro-grid for grid mode with real time ac
and dc load
0 50 100 150 200 250 300
1.2
1.4
1.6
1.8
2.0
2.2
2.4
Pow
er i
n C
onve
rter
s [M
W]
Time [sec]
PC1
PC2
0 50 100 150 200 250 300
0.5
1.0
1.5
2.0
2.5
3.0
3.5
4.0
4.5
5.0
Loa
d C
onsu
mpt
ion
[MW
]
Time [sec]
PLACT
PLDCT
0 50 100 150 200 250 300
0.25
0.50
0.75
1.00
1.25
1.50
1.75
2.00
2.25
Lo
ad C
on
sum
pti
on
[M
W]
Time [sec]
PLACT
PLDCT
0 50 100 150 200 250 300
0
2
4
6
Pow
er in
Con
vert
ers
[MW
]
Time [sec]
0 50 100 150 200 250 300
-0.5
0.0
0.5
1.0
1.5
2.0
Pow
er in
Con
vert
ers
[MW
]
Time [sec]
PC1
PC2
Fig. 22. Real power through power converters
using real time ac and dc load for grid mode