1 philip d. whitefield, donald e. hagen, prem lobo and richard miake-lye; missouri s&t coe and...
TRANSCRIPT

1
Philip D. Whitefield, Donald E. Hagen, Prem Lobo and Richard Miake-Lye;
Missouri S&T COE and ARI Inc.
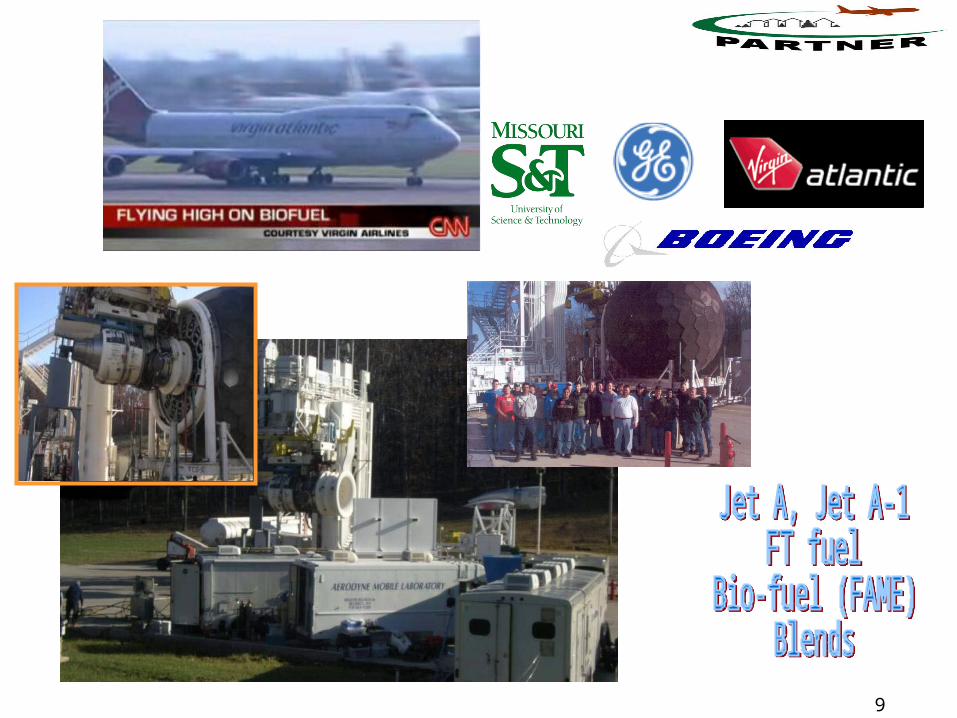
Emissions from Alternate Aviation Fuels and their Environmental Impact
22-23 April 2009Columbia MO

2

3
FischerTropschProcess
http://www.continental.com/web/en-US/content/company/globalcitizenship/environment.aspx


5

6

7
FT type

8
Objectives
9

10
Fuel blends tested and Data Types Acquired
Fuel ID Alt. Fuel Base-Fuel Source Tested Fuel Amb Temp (F)
0 None Jet A GE Jet A 28
1 None Jet-A1 GE Jet-A1 41
2 Ester Jet-A1 Boeing 20% Ester / 80% Jet-A1 28
3 Ester Jet-A1 Boeing 40% Ester / 60% Jet-A1 29
4 F-T Jet-A1 Air Force, 50% F-T / 50% Jet-A1 31
5 F-T None Air Force, 100% F-T 31
PM emissions: Total conc, size distributions {Dpj, dN/dlogDpj} Dgeom, DgeomM, Sigma, EIn, EIm Black carbon mass (MAAP)
Composition (AMS) Organic, Sulfate (Nitrate)Size distribution of volatile component
**** No near field plume data
Gas emissions: CO, HCHO, Speciated HCs NO, NO2, NOx

11
Measured Fuel Properties Fu
el ID
#
FUEL
Specic Gravity @ 15C
Heat of Combustion -
LHV(kJ/kg) Btu/lb
Heat of Combustion -
LHV(kJ/kg) Btu/lb
Kinematic Viscosity @
-20 deg Cmm^2/s
Kinematic Viscosity @
-20 deg Cmm^2/s
Kinematic Viscosity @
100F
Lubricity-BOCLE
wear scar(mm)
Thermal Stability Test
@260C (tube/delta P)
1 Jet-A1 0.797 43300 (18620) (43523) 18715 4.2 4.27 1.31 N/A 1/0
2 20% Ester / 80% Jet-A1 0.808 42000 (18060) (41600) 17888 5.1 4.74 1.41 0.51 1/0
3 40% Ester / 60% Jet-A1 0.825 40300 (17330) (39633) 17042 n.a 5.62 1.55 0.53 1/0
4 50% F-T / 50% Jet-A1 0.776 43600 (18750) (43737) 18807 4.7 4.4 1.33 0.57 1/0
5 100% F-T 0.755 44100 (18960) (44126) 18974 4.7 4.65 1.360.56 (has
CI/LI)1/0
Fuel Spec 0.78-0.82 42860 - 43500 42860 - 43500 2.5 - 6.5 2.5 - 6.5 N/A<0.85 (fuel w/o CI/LI)
<3/<25
Measurement GroupAir Force
AFRLAir Force
AFRLGE
AviationAir Force
AFRLGE
AviationGE
AviationAir Force
AFRLAir Force
AFRL
MEASURED FUEL PROPERTIES
Fuel flow is a surrogate for engine power setting
Fuel flow has to be corrected to account for different heats of combustion
Ester fuels are not expected to see commercial aviation use, but were tested as they were readily available at the time of the engine test. Ongoing industry plans for use of bio-derived jet fuels include the hydrotreating/hydrocracking of plant and other bio-derived oils. Properties of such biojet fuels are expected to be similar to Fischer-Tropsch fuels.

12
Emissions Representativeness - Gases
60
50
40
30
20
10
0
EI
CO
(g
kg-1
)
1.0x10⁴
0.80.60.40.20.0 Normalized mass fuel flow (pph)
Jet A Jet A-1 20% Biofuel in Jet A-1 40% Biofuel in Jet A-1 50% Fischer-Tropsch in Jet A-1 100% Fischer-Tropsch APEX
1.5
1.0
0.5
0.0
-0.5
EI H
CH
O (g
kg
-1)
1.0x10⁴
0.80.60.40.20.0 Normalized mass fuel flow (pph)
Jet A Jet A-1 20% Biofuel in Jet A-1 40% Biofuel in Jet A-1 50% Fischer-Tropsch in Jet A-1 100% Fischer-Tropsch APEX
CO
HCHO
40
30
20
10
0
EI N
O (g
kg-1
)
1.0x10⁴
0.80.60.40.20.0 Normalized mass fuel flow (pph)
Jet A Jet A-1 20% Biofuel in Jet A-1 40% Biofuel in Jet A-1 50% Fischer-Tropsch in Jet A-1 100% Fischer-Tropsch APEX
NO
3.5
3.0
2.5
2.0
1.5
1.0
0.5
0.0
EI N
O2
(g k
g-1
)
1.0x10⁴
0.80.60.40.20.0 Normalized mass fuel flow (pph)
Jet A Jet A-1 20% Biofuel in Jet A-1 40% Biofuel in Jet A-1 50% Fischer-Tropsch in Jet A-1 100% Fischer-Tropsch APEX
NO2
Biofuel = Ester

13
Summary
• Gaseous emissions performance:
– very similar to APEX – Independent of fuel – Perhaps small changes in NO/NO2/NOx for Ester
– Exception– speciated HCs distinct for alternative fuels: especially aromatic HC
emissions

14
Particulate EmissionsParticulate Emissions

15
Emissions Representativeness
• Data from this test was compared to that from the same engine
type investigated during the JETS APEX2 campaign
Comparison between CFM 56-7B engines (JET A1- Peebles and JETS APEX2)
0
5
10
15
20
25
30
35
40
0 20 40 60 80 100
Power (%)
Dge
om (
nm
)
Jet A1- Peebles JETS APEX2

16
1.00E+03
1.01E+05
2.01E+05
3.01E+05
4.01E+05
5.01E+05
6.01E+05
7.01E+05
8.01E+05
1 10 100 1000
100% power - JETA1
85% power - JETA1
65% power - JETA1
45% power - JETA1
30% power - JETA1 Total PM EmissionSize Distributions
for Jet A1 and 100% FTat
30, 45, 65, 85 & 100%Engine Power Settings
1.00E+03
1.01E+05
2.01E+05
3.01E+05
4.01E+05
5.01E+05
6.01E+05
7.01E+05
8.01E+05
1 10 100 1000
100% power - 100%FT
85% power - 100% FT
65% power - 100% FT
45% power - 100% FT
30% power - 100% FT
17
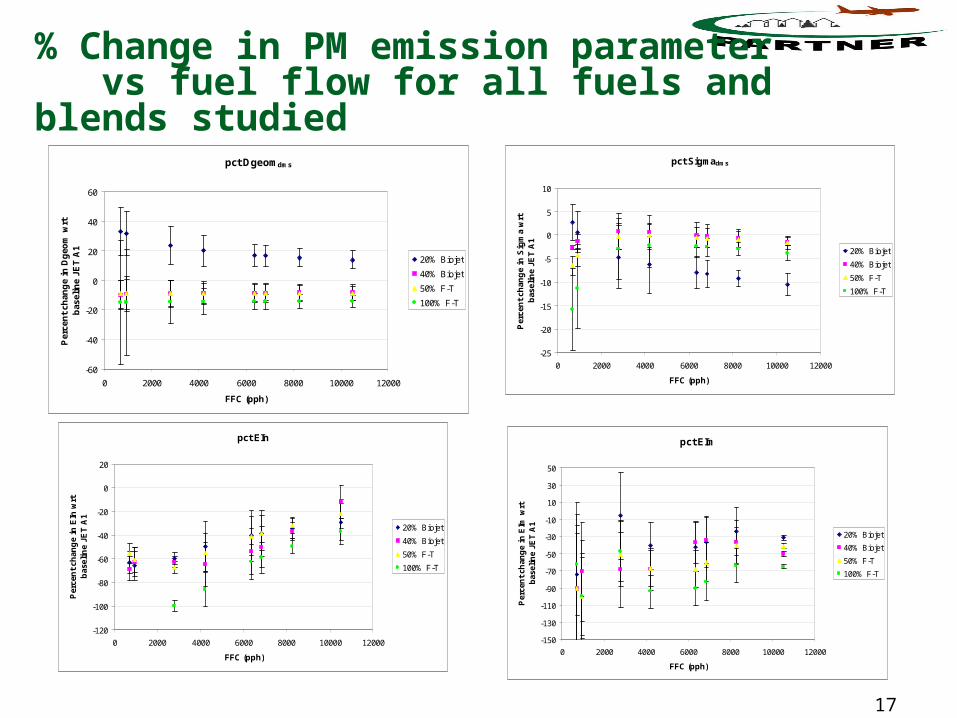
% Change in PM emission parameter vs fuel flow for all fuels and blends studied
pct Dgeomdms
-60
-40
-20
0
20
40
60
0 2000 4000 6000 8000 10000 12000
FFC (pph)
Per
cen
t ch
ang
e in
Dg
eom
wrt
bas
elin
e JE
T A
1
20% Biojet
40% Biojet
50% F-T
100% F-T
pct Sigmadms
-25
-20
-15
-10
-5
0
5
10
0 2000 4000 6000 8000 10000 12000
FFC (pph)
Per
cen
t ch
ang
e in
Sig
ma
wrt
bas
elin
e JE
T A
1
20% Biojet
40% Biojet
50% F-T
100% F-T
pct EIn
-120
-100
-80
-60
-40
-20
0
20
0 2000 4000 6000 8000 10000 12000
FFC (pph)
Per
cen
t ch
ang
e in
EIn
wrt
bas
elin
e JE
T A
1
20% Biojet
40% Biojet
50% F-T
100% F-T
pct EIm
-150
-130
-110
-90
-70
-50
-30
-10
10
30
50
0 2000 4000 6000 8000 10000 12000
FFC (pph)
Per
cen
t ch
ang
e in
EIm
wrt
bas
elin
e JE
T A
120% Biojet
40% Biojet
50% F-T
100% F-T

18
Fuel blends tested and Data Types Acquired
Fuel ID Alt. Fuel Base-Fuel Source Tested Fuel Amb Temp (F)
0 None Jet A GE Jet A 28
1 None Jet-A1 GE Jet-A1 41
2 Ester Jet-A1 Boeing 20% Ester / 80% Jet-A1 28
3 Ester Jet-A1 Boeing 40% Ester / 60% Jet-A1 29
4 F-T Jet-A1 Air Force, 50% F-T / 50% Jet-A1 31
5 F-T None Air Force, 100% F-T 31
PM emissions: Total conc, size distributions {Dpj, dN/dlogDpj} Dgeom, DgeomM, Sigma, EIn, EIm Black carbon mass (MAAP)
Composition (AMS) Organic, Sulfate (Nitrate)Size distribution of volatile component
Gas emissions: CO, HCHO, Speciated HCs NO, NO2, NOx
..............................................

19
Temperature Effect
• Measurements with Jet A1 were made at 41F; all other measurements ~ 30F
• Are the differences in observed emissions characteristics due to fuel change, temperature change or a combination of both?
Impact estimation
• Compare Jet A to Jet A1 measurements to estimate temperature effects on emissions
Methods employed to address estimated temperature effects
• Increase % change confidence levels to account for possible shift in reference Jet A1 emission characteristics due to temperature change
• Treat Tshift as a T-correction for the reference Jet A1 data and correct the Jet A1 reference data to the blend measurement temperature.

20
20% Biojet
-120
-100
-80
-60
-40
-20
0
20
0 2000 4000 6000 8000 10000 12000
FFc
Pe
rce
nt
ch
an
ge
in
EIn
wrt
b
as
eli
ne
JE
T A
1
Tshift
Tcorrection
40% Biojet
-120
-100
-80
-60
-40
-20
0
20
0 2000 4000 6000 8000 10000 12000
FFc
Pe
rce
nt
ch
an
ge
in
EIn
wrt
b
as
eli
ne
JE
T A
1Tshift
Tcorrection
For ease of comparison, the data points for Tcorrection are offset from those of Tshift
50% FT
-120
-100
-80
-60
-40
-20
0
20
0 2000 4000 6000 8000 10000 12000
FFc
Pe
rce
nt
ch
an
ge
in
EIn
wrt
b
as
eli
ne
JE
T A
1
Tshift
Tcorrection
100% FT
-120
-100
-80
-60
-40
-20
0
20
0 2000 4000 6000 8000 10000 12000
FFc
Pe
rce
nt
ch
an
ge
in
EIn
wrt
b
as
eli
ne
JE
T A
1
Tshift
Tcorrection
Temp. correction –v- Temp. shift
Biojet = Ester

21
Summary
• There is a statistically significant reduction in the number and mass-based emission index with all fuel blends – e.g. an average between 50-60% for EIn.
• For all blends, the greatest percent reduction is observed at low fuel flow rates
• 100% FT fuel yields the lowest emissions (consistent with previous studies – Corporan et al., 2007)
• Black carbon reduced
• Corresponding reductions in organic PM
• Background sulfate (& nitrate) contribute to emissions at idle, but sulfate contributions minimal at higher powers for engine exit plane, as expected
• Near-field plume data would shed more light on volatile PM emission amounts
• Alt. fuels and their blends show promise as candidates for PM emission reduction particularly during low power operations thereby justifying continued study of these and other candidate fuels.

22
AAFEX –Alternative Aviation Fuels Emissions Experiment
145m
30m
1m

23
AAFEX Plan

24
145m
30m
1m
TOTAL TOTAL TOTAL
TOTAL TOTALNON - VOLATILE
FT2 Blend JP-8 FT2 Blend

25
Acknowledgements
Any opinions, findings, and conclusions or recommendations expressed in this material are those of the author(s) and do not necessarily reflect
the views of the FAA, NASA or Transport Canada.
This work was funded by FAA under FAA Grant 07-C-NE-UMR,
Amendment No. 003, 004
The Emissions of Alternative Aviation Fuels project is managed by Carl Ma.