1 phase stabilities and spin transitions of fe3(s px) at high...
TRANSCRIPT

1
Revision 1 Phase stabilities and spin transitions of Fe3(S1-xPx) at high pressure and its 1 implications in meteorites 2
3 4 5 6
Tingting Gu1,2,*, Yingwei Fei1,2, Xiang Wu1, Shan Qin1 7 8
1Key Laboratory of Orogenic Belts and Crustal Evolution, MOE, Peking University & 9 School of Earth and Space Sciences, Peking University, Beijing 100871, China 10 2Geophysical Laboratory, Carnegie Institution of Washington, DC, 20015, US 11
*Current address: Center for high pressure science and technology advanced research 12 (HPSTAR), 1690 Cailun Road, Pudong, Shanghai, 201203 13
14

2
Abstract 15 16 Fe-S-P compounds have been observed in many meteorites and could be the important 17 components in planetary cores. Here we investigated the phase stability of Fe3(S,P) solid 18 solutions and synthesized high quality Fe3(S1-xPx) high-pressure phases in the multi-anvil 19 press. The physical properties of Fe3(S0.5P0.5) were further studied in the diamond-anvil 20 cell by synchrotron X-ray diffraction and emission spectroscopy. The solubility of S in 21 the Fe3(S,P) solid solution increases with increasing pressure. The minimum pressure to 22 synthesize the pure Fe3S and Fe3(S0.13P0.87) is about 21 and 8 GPa, respectively. The 23 observed discontinuity in unit cell parameters at about 18 GPa is caused by the high-spin 24 to low-spin transition of iron, supported by X-ray emission spectroscopy data. The sulfur 25 solubility in Fe3(S,P) solid solutions could be an excellent pressure indicator if such solid 26 solutions are found in nature. 27 Keywords: Iron sulfides, iron phosphides, high pressure, meteorites, spin transition 28 29
Introduction 30 Iron phosphides have been commonly found in iron meteorites, chondrites, and lunar 31 rocks. Early studies reported that phosphorus bearing Fe-Ni-Cr sulfides, the so-called Q-32 phase in the Murchison and Murray CM chondrites (Bunch and Chang 1980) and in 33 carbonaceous chondrite clasts from the Jodzie howardite (Bunch et al. 1979; Bunch and 34 Chang 1980), could host xenon (Lewis et al. 1975). They can crystalize to a single phase 35 alloyed with one or several metallic elements, such as schreibersite (Fe3P) (Clarke and 36 Goldstein 1978) and Barringerite ((Fe,Ni)2P) (Buseck 1969), or combined with other 37
3
non-metallic elements to form much more complex minerals such as perryite 38 (Fe,Ni)8(Si,P)3) (Okada et al. 1991). The occurrence of iron phosphides is often found to 39 accompany with iron sulfides and considered to record the thermal dynamic history of the 40 host meteorite. Fe-Ni-S-P phases from the Erevan howardite (Nazarov et al. 2009) and in 41 Lovina meteorite with IIE group (Teplyakova 2011) were generally considered to be a 42 high temperature product (Nazarov et al. 2009) or a production that undergoes melting 43 when phosphides and sulfides melt locally in metals as a result of impact events with 44 subsequent fast cooling (Teplyakova 2011). Some iron meteorites groups (IIAB, IIIAB, 45 IVA, and IVB) are also believed to have evolved in the Fe–Ni–S–P system (Jones and 46 Drake 1983). In IIIAB type meteorite, schreibersite was found to coexist with troilite 47 (Buchwald 1975; Goldstein et al. 2009), which was interpreted as immiscible Fe-S and 48 Fe-P molten phases (Goldstein et al. 2009). In contrast, in Elga meteorite with IIE type, 49 schreibersite and Fe-Ni-P-S alloy forms rims and spheres around silicate inclusions, with 50 S and P nearly evenly distributed (Osadchii et al. 1981). Such feature was interpreted as 51 the meteorite experiencing a dynamic pressure process. 52 Knowledge of phase relations in the Fe-S-P system at high pressure and temperature is 53 essential to interpret the observations and understand the impact history of the meteorites 54 that host the P-bearing iron sulfides. Although the Fe–S–P system shows a large liquid 55 immiscibility field (Raghavan 1988a; 1988b), high-pressure experiments show complete 56 miscibility between Fe-S and Fe-P (Stewart et al. 2007), which could lead to extensive 57 solid solutions such as Fe(S,P), Fe2(S,P), and Fe3(S,P). However, the effect of pressure 58 and temperature on the S/P proportion of these solid solutions is largely unknown. For 59 example, Fe3P with I4 structure is stable at ambient condition, whereas Fe3S with the 60
4
same structure can only form at pressures above 21 GPa (Fei et al. 2000). The solid 61 solutions between Fe3P and Fe3S would therefore be sensitive to pressure, and the 62 proportion of sulfur (S) and phosphorus (P) in the solid solution would potentially 63 indicate the P-T path of the mineral formation. 64 Sulfur and phosphorus have also been considered as potential “light elements” that 65 present in planetary cores. Due to the abundance of iron phosphides and iron sulfides in 66 meteorites and the high partition coefficient of sulfur and phosphorus between metal and 67 silicate, they could dissolve into the primary metallic cores of terrestrial planets during 68 early differentiation. Therefore, measurements of the physical properties of the Fe-P-S 69 phases at high pressure will provide constraints on core properties. Previous studies have 70 been focused on iron phosphides, such as (Fe,Ni)2P (Dera et al. 2008; 2009), FeP, (Gu et 71 al. 2011) and Fe3P(Gu et al. 2014). In this study, we determine the stability field of the 72 high-pressure Fe3(S1-xPx) solid solutions in the Fe-S-P system and measure the physical 73 properties of Fe3(S0.5P0.5) up to 40 GPa. 74
Methods 75 Sample synthesis 76 High-pressure synthesis experiments were performed at the Carnegie Institution of 77 Washington's Geophysical Laboratory in an 800-ton multi-anvil apparatus using a 10/5 78 assembly and a 1500-ton multi-anvil apparatus using an 8/3 assembly (Bertka and Fei 79 1997). MgO octahedra were used in all experiments. ZrO2 and LaCrO3 insulators were 80 used in the 10/5 and 8/3 assemblies, respectively (Figure S1). The furnace consisted of a 81 cylindrical resistance rhenium heater. Sample temperatures were measured with a 82

5
W5%Re/W26%Re thermocouple inserted coaxially. Pressures were determined from the 83 pressure calibration curves for the 10/5 and 8/3 assemblies (Fei et al. 1997; Hirose and 84 Fei 2002). The starting materials were obtained by mixing pure Fe, FeS (99.99% pure, 85 Alfa Aesar product) and Fe3P (99.5% pure, Alfa Aesar products) powders. Three 86 proportions of these starting materials were prepared, corresponding to the stoichiometric 87 composition of Fe3(S0.25P0.75), Fe3(S0.5P0.5), and Fe3(S0.75P0.25). The starting powders were 88 mixed and grinded, then loaded into a capsule that was made of MgO, Al2O3 or olivine 89 single crystal (Figure S2), which were dried in the oven for at least 3 hours. Each sample 90 was compressed at room temperature to the target pressure and then heated to the desired 91 temperature at a rate of 50 K/min and stayed at the target pressure and temperature for 24 92 hours. The recovered sample were mounted in epoxy and polished manually in a 93 diamond-based plate with oil as lubricant. 94 Compositional analysis 95 Mineral analyses were performed on the JEOL8900L Electron Probe Micro Analyzer 96 (EPMA) at the Geophysical Laboratory of the Carnegie Institution of Washington. 97 Operating conditions were 15 kV accelerating voltage, 35 nA beam current, and 1 μm 98 beam diameter for point analysis. Peak counting times ranged from 30 to 60 seconds. 99 Quantitative analyses were performed using standards such as pyrite FeS2 and GeP. The 100 precision is better than ± 0.1 % for the analyzed elements. 101 X-ray diffraction 102 The synthesized samples were first measured by X-ray diffraction at ambient 103 conditions using a Rigaku X-ray micro-diffractometer system with an X-ray beam spot of 104
6
30 µmand a wavelength of 0.7093 Å (Mo was used as X-ray target). The sample was 105 picked up and mounted on the top of a glass capillary of 100-300 µm diameter. Then the 106 sample was explored for 30-60 minutes to obtain a high quality X-ray diffraction pattern. 107 In-situ high-pressure X-ray diffraction experiments were conducted at HPCAT16-108 BMD beam line (Advanced Photon Source, Argonne National Laboratory), using a 109 symmetric diamond anvil cell with 300 μm culets. A 130 μm-diameter hole was drilled in 110 the pre-indented 40 μm rhenium gasket. Ne was used as pressure medium and calibrant. 111 Intense monochromatic synchrotron X-radiation, with a fixed wavelength of 0.364693 Å, 112 was used for angle-dispersive X-ray diffraction measurements. A collimated X-ray beam 113 (5× 12μm2) was aligned with the center of the sample chamber in the diamond anvil cell. 114 Diffraction patterns were recorded with a high-resolution Mar (Evanston, IL) CCD area 115 detector and then processed with Fit2D software (Hammersley et al. 1996). The detector 116 tilting and the distance between the sample and detector were calibrated against the 117 known lattice parameters of CeO2. 118 X-ray emission spectroscopy 119 The in situ X ray emission spectroscopy (XES) experiments were conducted at 120 HPCAT 16-ID-D beam line (Advanced Photon Source, Argonne National Laboratory). 121 Details of this method has been reported before (Rueff et al., 1999; Shen et al., 2003). X-122 ray energy from 7020 to 7080 eV with a step size of 0.25 eV was scanned. Synchrotron 123 X-rays go through monochromator and are focused by horizontal and vertical 124 Kirkpatrick-Baez mirrors. The focused x-rays reached the sample enclosed in a DAC 125 with X-ray transparent Be gasket. The scattered X-ray is then energy-selected by an 126

7
analyzer and reaches the detector. The spectrometer adopts Rowland circle geometry, of 127 which the sample, the analyzer and the detector sit on a circle whose diameter 128 corresponds to the analyzer bending radius R. For the K-edge of 3d transition metal, the 129 X-ray energy is usually below 10 keV, helium was used along the X-ray path to minimize 130 signal attenuation by air. Symmetric diamond-anvil cells with 200 and 300 μm culets 131 were used in the experiments. The diameter of the hole in the gasket in which the sample 132 was placed was about 60-80 �� A beryllium (Be) gasket with pre-indented 40 μm was 133 used in the XES experiments. Ne was used as the pressure medium and ruby spheres for 134 the pressure calibration. 135
Results and Discussions 136 Fe3(S1-xPx) solid solutions 137 We have conducted thirteen experiments to determine the S solubility in the Fe3(S1-xPx) 138 solid solutions in the pressure range of 8 - 21 GPa, using three starting materials with 139 different S/P ratios. Table 1 lists the starting samples, the synthetic conditions and the run 140 products. At 8 GPa, the synthesized Fe3(S1-xPx) contains sulfur with x = 0.87, coexisting 141 with Fe2(S,P) and some residual FeS (Figure 3S), using a starting composition containing 142 sulfur with x = 0.75. The result indicates the maximum solubility of sulfur in the Fe3(S1-143 xPx) structure is about x = 0.87 at 8 GPa. 144
At 10 GPa, we used starting material with element fraction as x = 0.75 and conducted 145 synthesis experiments at temperatures between 1173 and 1273 K, using different capsule 146 materials (MgO, Olivine, or Al2O3). The quench texture and phase assemblage of the 147 1273-K run indicate the experimental condition close to the peritectic melting (Figure 1). 148

8
Because of slightly higher temperature next to the heater, two melt pockets along both 149 sides were observed (Figures 1a, b, and c). At the cold end of the capsule, Fe3(S1-xPx) 150 coexists with Fe2(S,P) (Figure 1d). Further decreasing the temperature, single Fe3(S1-xPx) 151 can be synthesized (Table 1). The observed phase relation is very similar to that in the 152 Fe-FeS system at 21 GPa (Fei et al. 2000). The composition of the synthesized Fe3(S1-153 xPx) is identical to that of the starting composition, indicating 10 GPa is sufficiently high 154 pressure to synthesize the Fe3(S0.25P0.75) solid solution. 155
Similarly, Fe3(S0.5P0.5) can be obtained at 18 GPa. However, if the same composition 156 was compressed to 16 GPa, the final product contains less sulfur (Fe3(S0.42P0.58)), 157 indicating the maximum solubility of sulfur in the Fe3(S1-xPx) structure is about 0.42 at 16 158 GPa. At 21 GPa, we also synthesized homogenous Fe3(S0.75P0.25) solid solution as 159 confirmed by chemical composition map (Figure 2). It is clear that the sulfur solubility in 160 the Fe3(S1-xPx) structure increases with pressure. Figure 3 shows the composition of the 161 synthesized Fe3(S1-xPx) solid solution as a function of pressure. The result is consistent 162 with previous study on the formation of Fe3S at 21 GPa and subsolidus temperatures (Fei 163 et al., 2000). 164 Bulk modulus of Fe3(S1-xPx) 165 The high-pressure Fe3(S1-xPx) solid solutions are quenchable. We performed X-ray 166 diffraction measurements at ambient conditions on samples that are homogenous. From 167 their XRD patterns, all peaks can be indexed as I4 structure (isostructural to Fe3P) 168 (Figure S4). Rietveld refinements were applied for each pattern by GSAS software and 169 their volumes were obtained and plotted as a function of composition in Figure 5. The 170

9
values of the volumes and unit cell parameters show a roughly linear relationship with the 171 amount of sulfur in the solid solution. 172 To investigate the structure stability and compression behavior, we performed in-situ 173 high-pressure experiments on Fe3(S0.5P0.5) by diamond anvil cell technique. The in-situ 174 XRD patterns were collected up to 30 GPa at room temperature. Figure S5 shows several 175 representative patterns. All peaks can be indexed as I4 Fe3P structure and cubic Ne 176 (pressure-transmitting medium). At each point, the pressure was measured from the 177 Raman shifts of diamond culet at the center and the edge (Akahama and Kawamura, 178 2004). The average pressure was used and pressure gradient was calculated (Figure 4); 179 meanwhile, pressures obtained by diffraction of solid neon (Fei et al. 2007) above 7 GPa 180 were listed in comparison in Table S2. Unit cell parameters of Fe3(S0.5P0.5) were refined 181 by a model based on Le Bail whole profile fitting implemented in the GSAS software 182 (Toby 2001; Larson and Dreele 2004). At each pressure, the volume and c/a ratio were 183 plotted in Figure 5, compared with results of Fe3P (Scott et al. 2007; Gu et al. 2014) and 184 Fe3S (Fei et al. 2000). Data of Fe3(S0.5P0.5) below 20 GPa were fitted by 2nd order Birch-185 Murnaghan equation of state, with V0 fixed at 373.016 Å3, yielding B0 = 158(1) GPa, B0’ 186 =4, which is between the B0 value of Fe3S and Fe3P (Table S1). A discontinuity in the c/a 187 ratio was observed around 21 GPa (Figure 5), which reflects a spin crossover, also 188 observed in Fe3P (Gu et al. 2014) and Fe3S (Chen et al., 2007). 189 X-ray emission spectroscopy and the spin transition 190 To confirm the spin transition indicated by the observed discontinuity in volume and 191 cell parameters, X-ray emission spectroscopy was performed on Fe3P and Fe3(S0.5P0.5) up 192

10
to 64 GPa and 40 GPa, respectively. Figure 6a shows the Fe Kβ XES of Fe3P between 193 ambient pressure and 64 GPa. All spectra are normalized to transmitted intensity, and 194 also shifted to set the peak of the Fe Kβ1,3 main emission line to 7058 eV. The width of 195 the Kβ1,3 peak significantly narrows down at higher pressures. A well-defined satellite 196 located at 7045.5 eV and denoted to Kβ’, presents up to 64 GPa, with its intensity 197 gradually diminishing as pressure increases. The observed changes are reversible as 198 decompressed to ambient pressure. 199 The Kβ spectra of Fe3(S0.5P0.5) were normalized to unit area and plotted in Figure 6b. 200 The relative intensity of Kβ’ satellite at 7045.5 eV was determined by subtracting each 201 spectrum from that one of Fe3P at 64 GPa which is shown as a reference in the figure. 202 The relative intensities for Fe3P and Fe3(S0.5P0.5) as a function of pressure were shown in 203 the insets of Figure 6. In the case of Fe3P, the slope of the satellite intensity shows an 204 abrupt change at ~18.3 GPa, while a subtle non-linear decrease of the satellite intensity is 205 observed at ~40 GPa. The X-ray emission spectroscopic data are consistent with the 206 observed discontinuous changes in lattice parameter of Fe3P at 18 and 40 GPa as reported 207 by (Gu et al. 2014). In comparison, the discontinuous decrease of Kβ’ satellite intensity 208 of Fe3(S0.5P0.5) is observed at a slightly higher pressure (~23 GPa). 209
Discussions and implications 210 Theoretical studies (de Groot et al., 1995; Peng et al., 1994) indicate that the Kβ 211 emission is dominated by final state interaction between the 3p core hole and the 212 electrons of the partially filled 3d shell, which will result in splitting of the Kβ spectrum 213 into HS and LS final states. At HS state, the 3p↓3d↑ final state will further split into two 214

11
components, one main peak with a shoulder at slightly lower energy than the main 215 emission line (3p↑3d↑). At LS state, a 3p↑3d↑ final state will result in a single peak. For 216 Fe2+, the electrons occupy the orbitals according to Hund’s rule. The final electronic 217 configuration of the LS state becomes t t with a total 3d magnetic moment of zero, 218 and the Kβ’ line is expected to disappear. On the other hand, the electronic configuration 219 for Fe3+ is t t , thus the magnitude of magnetic moment would depend on the nature 220 of the ligand field and 3d band structure, and a finite moment would be expected in the 221 LS state. In the structure of Fe3P, iron atoms present at three different positions, thus their 222 valence state of each iron would be more complex. According to Mössbauer spectroscopy 223 of Fe3P, there are six sextets of Fe3P, and the isomer shift of them is between 0.27-0.40 224 mm/s (Lisher et al. 1974), which falls in the range of Fe3+. It is likely that the observed 225 discontinuity of Kβ’ satellite intensity at ~18 GPa is associated with the HS to LS 226 transition of Fe3+. 227
At higher pressure, the magnetic moment of Fe3P begins to collapse. Theoretical 228 study showed that Fe3P loses magnetic moments at about 60 GPa (Gu et al. 2014). The 229 intensity decrease of Kβ’ satellite at ~40 GPa is related to the magnetic collapse of Fe. In 230 the case of Fe3(S0.5P0.5), the HS to LS transition pressure is slightly higher than that of 231 Fe3P, which would be attributed to a different 3d band structure affected by stronger p-d 232 hybridization of Fe and S. 233 According to our multi-anvil experiments as well as in-situ high-pressure spectroscopy 234 studies, we constructed a diagram indicating the maximum sulfur concentration in Fe3(S1-235 xPx) solid solution at 900 ˚C as a function of pressure together with the spin transition 236

12
boundaries (Fig. 3). The Fe3(S1-xPx) solid solutions synthesized at the sulfur contents 237 below x = 0.5 are at high-spin state. The maximum solubility of sulfur in Fe3(S1-xPx) 238 increases almost linearly with pressure, up to x = 0.5 at 18 GPa. The end-member Fe3S 239 forms at 21 GPa as reported by Fei et al. (1997) and there is very small pressure 240 dependence to form Fe3(S1-xPx) at the sulfur contents above x = 0.5. The dramatic change 241 of the pressure effect on the sulfur solubility in the Fe3(S1-xPx) structure at around 18 GPa 242 might be related to the spin transition which occurs at that pressure. Easy incorporation of 243 sulfur into the Fe3(S1-xPx) structure could result from the reduction of the atomic size of 244 iron at low-spin state. The atomic size ratio of S/Fe would be more close to that of P/Fe 245 after the spin transition because the atomic size of sulfur is ~3% smaller than that of 246 phosphorus. Such crystallographic configuration tends to facilitate the incorporation of 247 sulfur atoms into Fe3(S1-xPx) solid solutions. 248 Fe3S can only be synthesized at pressures above 21 GPa, but it is quenchable in the 249 same structure as Fe3P. If Fe3S were ever found in meteorites, it would be an 250 unambiguous high-pressure indicator with a minimum shock pressure of 21 GPa. The 251 Fe3(S1-xPx) solid solutions, on the other hand, is an effective pressure scale that can be 252 used to pinpoint the formation pressure because the maximum sulfur solubility in 253 schreibersite is pressure sensitive. It would potentially be an indicator of the 254 thermodynamic path of its host meteorites if such solid solution were found. Because 255 Fe3(S1-xPx) solid solutions have low melting temperature, it would be challenging to find 256 the solid solutions in meteorites that undergo complex dynamic pressure conditions. 257 Byproducts such as Fe2(S,P) solid solutions with quenched melt texture could indicate 258 that the meteorite experienced a high temperature above the eutectic point of Fe3(S,P). 259
13
Although schreibersite with significant amount of sulfur has not been founded yet 260 (Nazarov et al. 2009), under proper shock pressure conditions, fine grains of Fe3(S,P) 261 solid solutions might preserve. The discovery of a first natural Fe3(S,P) solid solution has 262 to rely on a systematic search through shocked meteorites with sulfur-bearing 263 schreibersite. 264 265
Acknowledgement 266 We thank Vincenzo Stagno, Li Zhang and Renbiao Tao for technique assistance of 267 multi-anvil experiments, John Armstrong, Katherine Crispin, and Paul Goldey for 268 technique assistance of microprobe analysis, Jinfu Shu for technique assistance of DAC 269 experiments, Ho-kwang Mao for sharing beam time at HPCAT 16 IDD, and Yuming 270 Xiao and Daijo Ikuta for beam-line assistance at HPCAT. The pre-doctoral fellowship (T. 271 Gu) was supported by the financial support of CSC scholarship. The experiments were 272 supported by NSF grant Geochemistry grant (to Y.F.). X. Wu and S. Qin are grateful for 273 the financial support of the National Natural Science Foundation of China (Grant No. 274 U1232204). T. Gu would like to thank the financial support of the National Natural 275 Science Foundation of China (Grant No. 41502035). 276
References 277 Akahama, Y., Kawamura, H., 2004. High-pressure Raman spectroscopy of diamond 278
anvils to 250 GPa: Method for pressure determination in the multimegabar pressure 279 range. Journal of Applied Physics, 96, 3748-3751. 280
Bertka, C.M., and Fei, Y. (1997) Mineralogy of martian interior up to core–mantle 281 boundary pressures. Journal of Geophysical Research, 102, 5251–5264. 282

14
Buchwald, V.F. (1975) Handbook of Iron Meteorites. Their History, Distribution, 283 Composition and Structure 1. Berkeley: Univ. California Press. 284
Bunch, T.E., and Chang, S. (1980) Carbonaceous chondrites—II. Carbonaceous 285 chondrite phyllosilicates and light element geochemistry as indicators of parent body 286 processes and surface conditions. Geochimica et Cosmochimica Acta, 44, 1543–287 1577. 288
Bunch, T.E., Chang, S., Frick, U., Neil, J., and Moreland, G. (1979) Carbonaceous 289 chondrites—I. Characterization and significance of carbonaceous chondrite (CM) 290 xenoliths in the Jodzie howardite. Geochimica et Cosmochimica Acta, 43, 1727–291 1742. 292
Buseck, P.R. (1969) Phosphide from metorites: barringerite, a new iron-nickel mineral. 293 Science, 165, 169–171. 294
Clarke, R.S., and Goldstein, J. (1978) Schreibersite Growth and Its Influence on the 295 Metallography of Coarse-structured Iron Meteorites, 1 p. 296
de Groot, F.M.F., Pizzini, S., Fontaine, A., Hämäläinen, K., Kao, C.C., Hastings, J.B. 297 (1995) Local-spin-selective x-ray absorption and x-ray magnetic circular dichroism 298 of MnP. Physical review B, 51, 1045–1052. 299
Dera, P., Lavina, B., Borkowski, L.A., Prakapenka, V.B., Sutton, S.R., Rivers, M.L., 300 Downs, R.T., Boctor, N.Z., and Prewitt, C.T. (2008) High-pressure polymorphism of 301 Fe2P and its implications for meteorites and Earth's core. Geophysical Research 302 Letters, 35, L10301. 303
Dera, P., Lavina, B., Borkowski, L.A., Prakapenka, V.B., Sutton, S.R., Rivers, M.L., 304 Downs, R.T., Boctor, N.Z., and Prewitt, C.T. (2009) Structure and behavior of the 305 barringerite Ni end-member, Ni2P, at deep Earth conditions and implications for 306 natural Fe-Ni phosphides in planetary cores. Journal of Geophysical Research, 114, 307 B03201. 308
Fei, Y., Ricolleau, A., Frank, M., Mibe, K., Shen, G., and Prakapenka, V. (2007) Toward 309 an internally consistent pressure scale. Proceedings of the National Academy of 310 Sciences of the United States of America, 104, 9182–9186. 311
Fei, Y.W., Bertka, C.M., and Finger, L.W. (1997) High-Pressure Iron-Sulfur Compound, 312 Fe3S2, and Melting Relations in the Fe-FeS System. Science, 275, 1621–1623. 313
Fei, Y.W., Li, J., Bertka, C.M., and Prewitt, C.T. (2000) Structure type and bulk modulus 314 of Fe3S, a new iron-sulfur compound. American Mineralogist, 85, 1830–1833. 315
Goldstein, J.I., Scott, E.R.D., and Chabot, N.L. (2009) Iron meteorites: Crystallization, 316 thermal history, parent bodies, and origin. Chemie der Erde–Geochemistry, 69, 293–317 325. 318
15
Gu, T., Fei, Y., Wu, X., and Qin, S. (2014) High-pressure behavior of Fe3P and the role 319 of phosphorus in planetary cores. Earth and Planetary Science Letters, 390, 296–303. 320
Gu, T., Wu, X., Qin, S., and Dubrovinsky, L. (2011) In situ high-pressure study of FeP: 321 Implications for planetary cores. Physics of the Earth and Planetary Interiors, 184, 322 154–159. 323
Hammersley, A.P., Svensson, S.O., Hanfland, M., Fitch, A.N., and Häusermann, D. 324 (1996) Two-dimensional detector software: From real detector to idealised image or 325 two-theta scan. High Pressure Research, 14, 235–248. 326
Hirose, K., and Fei, Y. (2002) Subsolidus and melting phase relations of basaltic 327 composition in the uppermostlower mantle. Geochimica et Cosmochimica Acta, 66, 328 2099–2108. 329
Jones, J.H., and Drake, M.J. (1983) Experimental investigations of trace element 330 fractionation in iron meteorites, II: The influence of sulfur. Geochimica et 331 Cosmochimica Acta, 47, 1199–1209. 332
Larson, A.C., and Dreele, Von, R.B. (2004) General Structure Analysis System (GSAS). 333 Los Alamos National Laboratory. 334
Lewis, R.S., Srinivasan, B., and Anders, E. (1975) Host phase of a strange xenon 335 component in Allende. Science, 190, 1251–1262. 336
Lin, J.-F., Fei, Y., Sturhahn, W., Zhao, J., Mao, H.-K., and Hemley, R.J. (2004) Magnetic 337 transition and sound velocities of Fe3S at high pressure: implications for Earth and 338 planetary cores. Earth and Planetary Science Letters, 226, 33–40. 339
Lisher, E.J., Wilkinson, C., Ericsson, T., Haggstrom, L., Lundgren, L., and Wappling, R. 340 (1974) Studies of the magnetic structure of Fe3P. Journal of Physics C: Solid State 341 Physics, 1344–1352. 342
Nazarov, M.A., Kurat, G., Brandstaetter, F., Ntaflos, T., Chaussidon, M., and Hoppe, P. 343 (2009) Phosphorus-bearing sulfides and their associations in CM chondrites. 344 Petrology, 17, 101–123. 345
Okada, A., Kobayashi, K., Ito, T., and Sakurai, T. (1991) Structure of synthetic perryite, 346 (Ni,Fe)8(Si,P)3. Acta Crystallographica, C47, 1358–1361. 347
Osadchii, E.G., Novikov, G.V., and Baryshnikova, G.V. (1981) The Elga meteorite: 348 Silicate inclusions and shock metamorphism, 12, 1049–1068. 349
Peng, G., de Groot, F.M.F., Hämäläinen, K., Moore, J.A., Wang, X., Grush, M.M., 350 Hastings, J.B., Siddons, D.P., Armstrong, W.H. (1994) High-resolution manganese x-351 ray fluorescence spectroscopy. Oxidation-state and spin-state sensitivity. Journal of 352 the American Chemical Society, 116, 2914–2920. 353
16
Raghavan, V. (1988a) Phase Diagrams of Ternary Iron Alloys. Pt. 3. Ternary Systems 354 Containing Iron and Phosphorus, 1 p. Calcutta: Indian Institute of Metals. 355
Raghavan, V. (1988b) Phase Diagrams of Ternary Iron Alloys: Ternary systems 356 containing iron and sulphur, 1 p. Calcutta: Indian Institute of Metals. 357
Rueff, J.P., Kao, C.C., Struzhkin, V.V., Badro, J., Shu, J., Hemley, R.J., and Mao, H.-K. 358 (1999) Pressure-Induced High-Spin to Low-Spin Transition in FeS Evidenced by X-359 Ray Emission Spectroscopy. Physical Review Letters, 82, 3284–3287. 360
Scott, H.P., Huggins, S., Frank, M.R., Maglio, S.J., Martin, C.D., Meng, Y., Santillán, J., 361 and Williams, Q. (2007) Equation of state and high-pressure stability of Fe3P-362 schreibersite: Implications for phosphorus storage in planetary cores. Geophysical 363 Research Letters, 34, L06302. 364
Shen, G., Lin, J.-F., Fei, Y., Mao, H.-K., Hu, M., and Chow, P. (2003) Magnetic and 365 structural transition in Fe3S at high pressures. Eos. Trans. AGU, 84, F1548–F1549. 366
Stewart, A.J., Schmidt, M.W., Westrenen, W.V., and Liebske, C. (2007) Mars: A New 367 Core-Crystallization Regime. Science, 316, 1323–1325. 368
Teplyakova, S.N. (2011) Evolution of molten material in iron cores of small planets. 369 Solar System Research, 45, 515–522. 370
Toby, B.H. (2001) EXPGUI, a graphical user interface for GSAS. Journal of Applied 371 Crystallography, 34, 210–213. 372
373
17
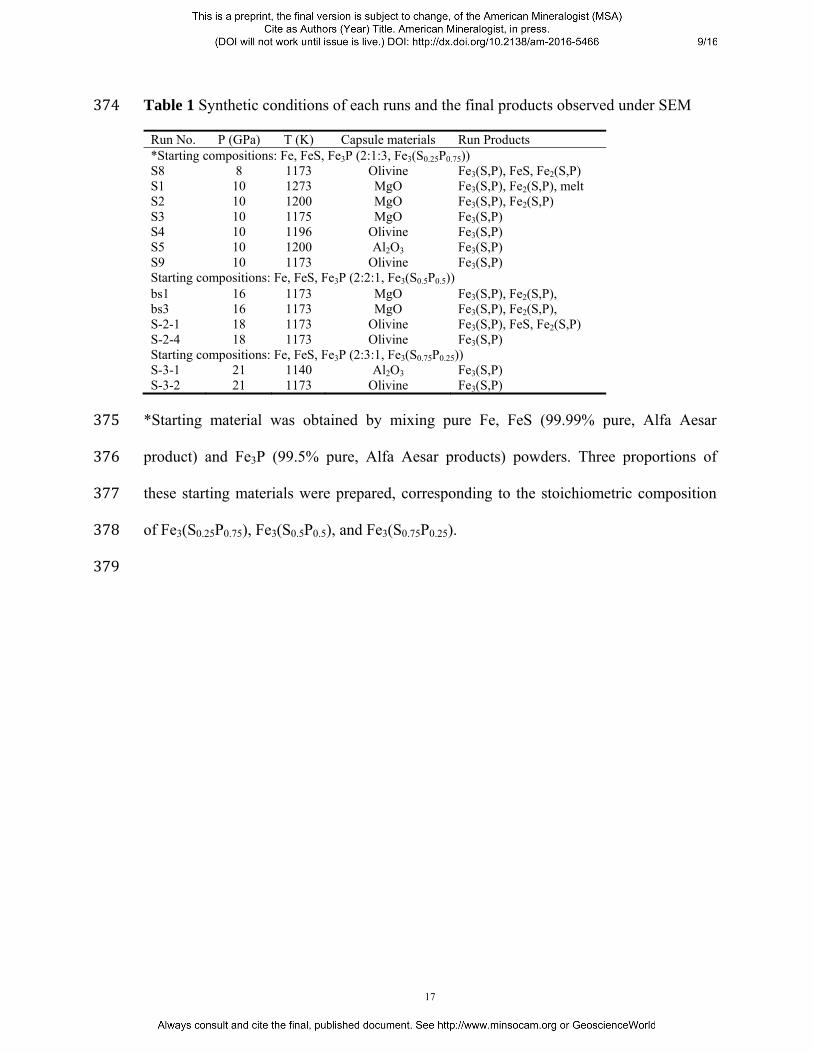
Table 1 Synthetic conditions of each runs and the final products observed under SEM 374 Run No. P (GPa) T (K) Capsule materials Run Products *Starting compositions: Fe, FeS, Fe3P (2:1:3, Fe3(S0.25P0.75))S8 8 1173 Olivine Fe3(S,P), FeS, Fe2(S,P) S1 10 1273 MgO Fe3(S,P), Fe2(S,P), melt S2 10 1200 MgO Fe3(S,P), Fe2(S,P) S3 10 1175 MgO Fe3(S,P) S4 10 1196 Olivine Fe3(S,P) S5 10 1200 Al2O3 Fe3(S,P) S9 10 1173 Olivine Fe3(S,P) Starting compositions: Fe, FeS, Fe3P (2:2:1, Fe3(S0.5P0.5)) bs1 16 1173 MgO Fe3(S,P), Fe2(S,P), bs3 16 1173 MgO Fe3(S,P), Fe2(S,P), S-2-1 18 1173 Olivine Fe3(S,P), FeS, Fe2(S,P) S-2-4 18 1173 Olivine Fe3(S,P) Starting compositions: Fe, FeS, Fe3P (2:3:1, Fe3(S0.75P0.25)) S-3-1 21 1140 Al2O3 Fe3(S,P) S-3-2 21 1173 Olivine Fe3(S,P)
*Starting material was obtained by mixing pure Fe, FeS (99.99% pure, Alfa Aesar 375 product) and Fe3P (99.5% pure, Alfa Aesar products) powders. Three proportions of 376 these starting materials were prepared, corresponding to the stoichiometric composition 377 of Fe3(S0.25P0.75), Fe3(S0.5P0.5), and Fe3(S0.75P0.25). 378 379
18
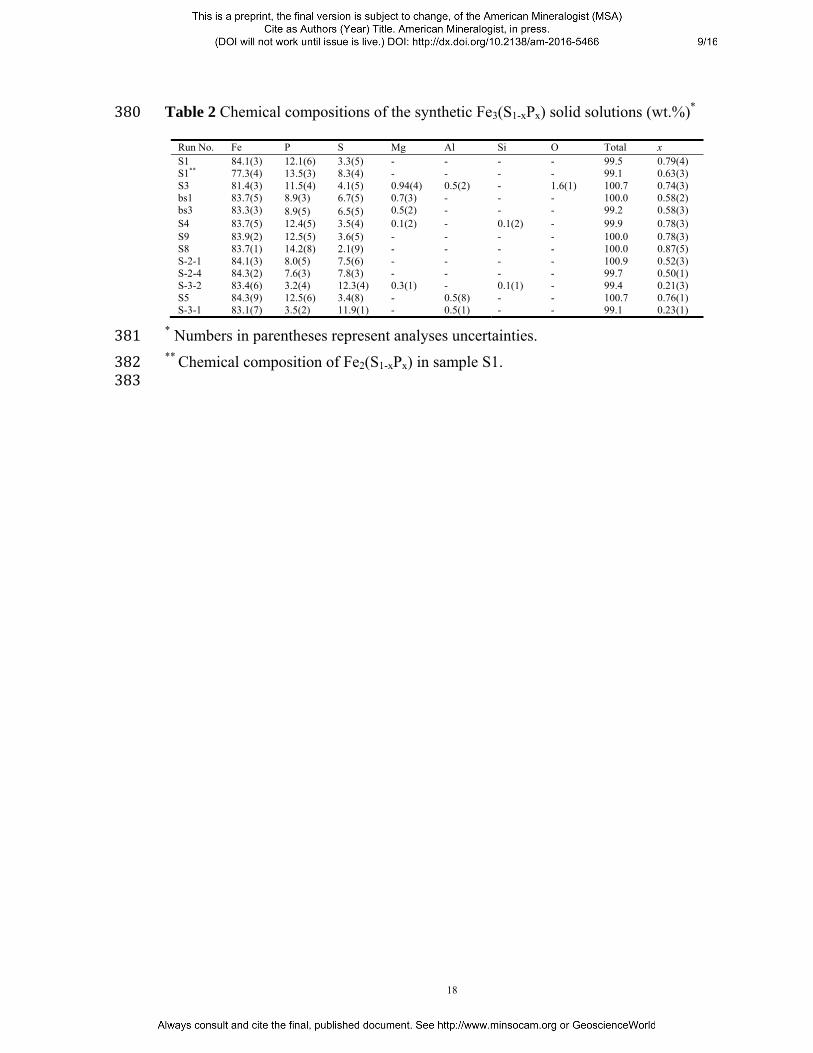
Table 2 Chemical compositions of the synthetic Fe3(S1-xPx) solid solutions (wt.%)* 380 Run No. Fe P S Mg Al Si O Total x S1 84.1(3) 12.1(6) 3.3(5) - - - - 99.5 0.79(4) S1** 77.3(4) 13.5(3) 8.3(4) - - - - 99.1 0.63(3) S3 81.4(3) 11.5(4) 4.1(5) 0.94(4) 0.5(2) - 1.6(1) 100.7 0.74(3) bs1 83.7(5) 8.9(3) 6.7(5) 0.7(3) - - - 100.0 0.58(2) bs3 83.3(3) 8.9(5) 6.5(5) 0.5(2) - - - 99.2 0.58(3) S4 83.7(5) 12.4(5) 3.5(4) 0.1(2) - 0.1(2) - 99.9 0.78(3) S9 83.9(2) 12.5(5) 3.6(5) - - - - 100.0 0.78(3) S8 83.7(1) 14.2(8) 2.1(9) - - - - 100.0 0.87(5) S-2-1 84.1(3) 8.0(5) 7.5(6) - - - - 100.9 0.52(3) S-2-4 84.3(2) 7.6(3) 7.8(3) - - - - 99.7 0.50(1) S-3-2 83.4(6) 3.2(4) 12.3(4) 0.3(1) - 0.1(1) - 99.4 0.21(3) S5 84.3(9) 12.5(6) 3.4(8) - 0.5(8) - - 100.7 0.76(1) S-3-1 83.1(7) 3.5(2) 11.9(1) - 0.5(1) - - 99.1 0.23(1)
* Numbers in parentheses represent analyses uncertainties. 381 ** Chemical composition of Fe2(S1-xPx) in sample S1. 382 383
19
Figure captions 384 Figure 1 Back scatter electron images of sample quenched from 10 GPa, 1000 ˚C in a 385 MgO capsule, showing an equilibrium feature of liquids and solid solutions. (a) An image 386 of the whole sample. Dashed lines were marked along the phase boundaries. The details 387 of the marked areas are shown in the rest images (b-c). (b) Phase boundary where Fe and 388 FeS melts coexist with Fe2(S,P) solid solutions. (c) The liquids, where Fe and FeS 389 surround over Fe2(S,P) grains. (d) Phase boundary between Fe2(S,P) and Fe3(S,P) solid 390 solutions. 391 Figure 2 Back scatter electron image of the sample quenched from 21 GPa, 900 ˚C in an 392 olivine capsule. The chemical maps of S and P show homogeneous distribution of P and 393 S in the sample. 394 Figure 3 The maximum solubility of S in Fe3(S1-xPx) solid solution at about 1173-1200 K 395 as a function of pressure. The yellow circles, blue squares, and green diamonds represent 396 data obtained with MgO, Al2O3, and olivine capsules, respectively. The open diamonds 397 indicate the spin transition pressures (Shen et al. 2003; Lin et al. 2004). Dotted arrows 398 indicate the S/P ratios of the starting compositions. The light green area between the 399 dashed lines illustrates the uncertainty of the spin transition. Note: dashed and solid lines 400 are guides for eyes. 401 Figure 4 Relationship between volume and composition of the synthesized Fe3(S1-xPx) 402 solid solutions at ambient conditions. 403 Figure 5 Volumes and unit cell parameters of Fe3(S0.5P0.5) as a function of pressure. (a) 404 Volumes of Fe3(S0.5P0.5) as a function of pressure, fitted by B-M equation of state. Data 405 of Fe3P and Fe3S were also plotted for comparison; B’ was fixed at 4. (b) Changes of the 406

20
c/a ratios of Fe3(S0.5P0.5) and Fe3P as a function of pressure. Dash lines are guide for eyes. 407 Note the discontinuous change of c/a ratio of the two samples. 408 Figure 6 X-ray emission spectroscopy of Fe3P (a) and Fe3(S0.5P0.5) (b) at different 409 pressures. Insets: relative intensity of Kβ’ peaks as a function of pressure. 410 411

21
412 Figure 1413
100 ∝m
100 ∝m
50 ∝m
a b
d
b
c
d
Fe3(S,P)
Fe2(S,P)
FeS
FeS
c
50 ∝m
Fe2(S,P)
Fe2(S,P)
Fe+FeS melts
Fe+FeS melts
FeS
Fe3(S,P)
Fe2(S,P)
Liquids
Liquids

22
414 Figure 2 415
25 ∝m
25 ∝m
25 ∝m
S
P

23
416 Figure 3417
LS
HS

24
418 Figure 4419
o
This study
Scott et al., 2007
(Fe3(S1-xPx))

25
420
421 Figure 5422
Fe3(S0.5P0.5), this study
Fe3P, Gu et al., 2014 Fe3S, Fei et al., 2000
O
c/a (Fe3(S0.5P0.5))c/a (Fe3P)

26
423
424 Figure 6 425
(a)
(b)