1 performance impact of inter-layer dependence in ... · performance impact of inter-layer...
TRANSCRIPT

1
Performance Impact of Inter-Layer Dependencein Infrastructure WLANs
Sunwoong Choi† Kihong Park‡ Chong-kwon Kim†
†School of Computer Science and EngineeringSeoul National University, Seoul, Korea 151–744
‡Department of Computer SciencesPurdue University, West Lafayette, IN 47907, U.S.A.
Abstract
Widespread deployment of infrastructure WLANs has made Wi-Fi an integral part of today’s
Internet access technology. Despite its crucial role in affecting end-to-end performance, past research has
focused on MAC protocol enhancement, analysis and simulation-based performance evaluation without
sufficient consideration for modeling inaccuracies stemming from inter-layer dependencies, including
physical layer diversity, that significantly impact performance. We take a fresh look at IEEE 802.11
WLANs, and using experiment, simulation, and analysis demonstrate its surprisingly agile performance
traits. Our findings are two-fold. First, contention-based MAC throughput degrades gracefully under
congested conditions, enabled by physical layer channel diversity that reduces the effective level of
MAC contention. In contrast, fairness degrades and jitter increases significantly at a critical offered
load. This duality obviates the need for link layer flow control for throughput improvement. Second,
TCP-over-WLAN achieves high throughput commensurate with that of wireline TCP under saturated
conditions, challenging the widely held perception that TCP throughput fares poorly over WLANs when
subject to heavy contention. We show that TCP-over-WLAN prowess is facilitated by the self-regulating
actions of DCF and TCP feedback control that jointly drive the shared channel at an effective load of
2–3 wireless stations, even when the number of active stations is large. We show that the mitigating
influence of TCP extends to unfairness and adverse impact of dynamic rate shifting under multiple
access contention. We use experimentation and simulation in a complementary fashion, pointing out
performance characteristics where they agree and differ.
Keywords: Wireless communication, access schemes, physical layer diversity, TCP-over-WLAN perfor-
mance, experimentation vs. simulation

2
I. I NTRODUCTION
A. Background and Motivation
Widespread deployment of wireless local area networks (WLANs) at campuses, enterprises,
residential areas, and commercial hotspots has made IEEE 802.11 WLANs [4], also referred to
as Wi-Fi when complying with industry interoperability standards, a key component of today’s
integrated wireline/wireless Internet. As with ALOHA [5] and Ethernet [30] in the 1970s, the
advent of WLANs in the late 1990s has spurred research aimed at understanding its properties,
including performance analyses of IEEE 802.11 CSMA/CA [9], [12], fair scheduling [28],
[40], capacity analyses of ad hoc WLANs [15], [16] (and hybrid extensions [26], [27]), and
measurement-oriented studies [7], [25], [37]. The capacity of CSMA/CD Ethernet was not
without controversy—Boggs et al. [10] discuss the wide ranging performance perceptions of the
DIX and IEEE 802.3 10Base5 Ethernets deployed in the 1980s—but the subsequent evolution to
switched technology, with CSMA/CD preserved for backward compatibility, rendered many of
the earlier issues moot. This is not the case for IEEE 802.11 WLANs as physical shielding of the
wireless transmission medium from interference and localization of contention at a switch are
infeasible. WLAN performance is influenced by three main variables: mobility, channel noise,
and multiple access contention. Mobility across access points (APs) in an extended service set is
facilitated by reassociation-based handoff augmented by legacy link layer forwarding over wire-
line distribution networks. Mobility support across extended service sets through Mobile IP, at
the present, is rarely instituted—even within a single organization—due to security concerns and
insufficient application demand. Mobility support across domains is hindered by administrative
boundaries and policy barriers. Channel noise in the unlicensed 2.4/5 GHz ISM/U-NNI bands
can be a problem, especially when the distance between wireless station and AP is far. Current
remedies include multi-rate support in physical layer modulation, with adaptive rate selection
left to vendor discretion.
The focus of this paper is on WLAN performance in hot spots—the dominant mode of WLAN
usage today—where performance degradation from contention-based multiple access is the key
concern. In several respects, there is ambiguity about the performance of WLANs today as there
was about the capacity of Ethernet in the 1980s. For example, in [9] it is shown that IEEE
3
802.11 DCF system throughput significantly declines as offered load is increased. The analysis
and simulation, however, do not consider the effect of physical layer channel diversity (also called
multiuser diversity [23], [39]) that mitigates throughput degradation. Performance discrepancies
between modeling/simulation and experimention with respect to transmission range and capture
effect have been discussed in [6], [24]. In [41] it is shown that 802.11b throughput decreases
from above 6 Mbps to below 2 Mbps as the number of stations is increased from 1 to 14. The
performance results are stated as validating the 802.11 capacity analysis carried out in [11]. The
results in [41] are difficult to replicate, that is, unless dynamic rate shifting is activated—the
default case—which easily confuses collision with channel noise. In [42], [43] it is indicated
that forward TCP data traffic can collide with reverse acknowledgment traffic, “dramatically”
increasing the frame error rate which may be more pronounced in pre-802.11 WLAN cards
where MAC level retransmission is absent. In [17], an enhanced DCF protocol called DCF+ is
proposed to address this problem. We show that this potential TCP data/ack collision problem
does not materialize due to the self-regulating actions of DCF and TCP feedback control.
One of the goals of this paper is to help clarify some of the ambiguities surrounding WLAN
performance through delineation of wireless and wireline features, incorporation of the impact
of inter-layer dependencies, including those stemming from physical layer channel diversity, that
impact performance.
B. New Contribution
The contribution of this paper is two-fold, discussed in two parts: DCF MAC layer performance
and TCP-over-WLAN performance. First, we show that contention-based DCF throughput de-
grades gracefully as offered load or the number of wireless stations is increased. This is enabled
by physical layer channel diversity that reduces the effective level of MAC layer contention, a
form of multiuser diversity whose persistent manifestation in IEEE 802.11 WLANs DCF is able
to exploit. This obviates the need for recently proposed link layer flow control schemes [20],
[44] aimed at preventing MAC throughput degradation. We also show that empirical evidence
of drastic throughput degradation of IEEE 802.11b WLANs under moderate load [19], [41] are
likely to stem from the influence of dynamic rate shifting implemented in most WLAN cards,

4
which suffer from the problem of not being able to effectively distinguish collision from channel
noise. Downshifting to fallback rates (e.g., 5.5, 2 and 1 Mbps in 802.11b) helps when increased
distance or channel noise results in small SNR, but is ineffective—in fact, detrimental—when
collisions are the primary cause of frame errors. In contrast to throughput, MAC layer fairness
degrades and jitter increases significantly at a critical offered load, and can benefit from traffic
controls aimed at operating the system outside the saturation region.
Second, we show that TCP-over-WLAN achieves high throughput commensurate with that of
wireline TCP, even under saturated conditions where the number of wireless stations is very large.
We show that TCP-over-WLAN prowess is facilitated by the self-regulating actions of DCF and
TCP feedback control, which jointly drive the shared baseband medium at an effective load of
2–3 wireless stations. As a consequence, the TCP data/ack collision problem raised in [17], [42],
[43] does not manifest as a real performance concern. TCP-over-WLAN also mitigates persistent
unfairness due to physical layer channel diversity and throughput degradation stemming from
dynamic rate shifting. We evaluate TCP-over-WLAN performance by analyzing a Markov chain
over the state space counting the number of backlogged stations. We show a strong negative
drift in the Markov chain which is established by inferring transition rates from measurement
traces, both from experiment and simulation. We identify situations—analogous to wireline TCP
with mismatched low bandwidth access links [35]—where buffer overflow at the gateway or AP
may become a dominant factor. We show that traffic controls utilizing receiver-side advertised
window and virtual delay control can alleviate the essentially wireline bottleneck problem.
The remainder of the paper is organized as follows. In the next section, we give the technical
set-up. This is followed by Section III which discusses the performance properties of IEEE
802.11b DCF. Section IV studies TCP-over-WLAN performance including control issues. We
conclude with a discussion of our results.
II. SYSTEM MODEL
A. Infrastructure WLAN Environment
We consider an integrated wireless/wireline IP internetwork where access networks are com-
prised of IEEE 802.11 infrastructure WLANs that service wireless hosts. An access point

5
(AP) may be connected to other APs by a wireline distribution network—typically one or
more Ethernet switches—that is then connected to the Internet via a wireline access link.
Figure 1 depicts the components of such a network system. Our focus is on the wireless access
client
server
server
server
MH VoIP
client
client
. . .
VoIP
AP
MH
MH
MH
WLANsegment
IP internetwork
Fig. 1. Wireless/wireline IP internetwork with IEEE 802.11 infrastructure WLAN segment.
segment representative of hot spots deployed at coffee houses, airport lounges, SOHOs, and
residential home networks. Typical last mile access technology include broadband cable/DSL
and DS3/OC3 lines for small-to-medium enterprises. We model the wireless/wireline network
system as a dumbbell network wheren wireless hosts access the wireline network through an
AP—collectively forming a basic service set (BSS)—which is connected to a router that, in
turn, connectsn wireline hosts. A canonical configuration treats the wireless hosts as clients that
communicate with servers on the wireline side. Inns-2 simulations, the dumbbell configuration
also serves as the physical topology.
B. Experimental Set-up
We connect an Enterasys RoamAbout R2 AP supporting IEEE 802.11b through a 100 Mbps
Ethernet crossover cable to a Dell Inspiron 8100 laptop with a 1 GHz Mobile Pentium III
processor and 512 MB memory running Linux 2.4.7-10. The kernel has netfilter enabled to
facilitate TCP-transparent receiver-side traffic control that are implemented as IP hook callback
functions. We also performed benchmark experiments on a private IP-over-SONET testbed
comprised of 9 Cisco 7206VXR routers—the wireline backbone segment—where the AP is
directly connected to one of the routers and the PCs are connected to the other 8 routers acting
as servers. The two set-ups yield similar results and we report benchmark suites from the laptop-
to-AP wireline configuration. The BSS wireless segment is populated by 16 Compaq/HP 3800

6
and two 3600 series iPAQ pocket PCs with 64 MB memory running Familiar Linux v0.7.2.
Figure 2(a) depicts some of the hardware components. Each pocket PC is housed in an external
(a)
15 m
AP
109
110
111 113
114
115
116
131
132
133
134
135
136137
138
139
(b)
Fig. 2. (a) iPAQ pocket PCs and Enterasys RoamAbout R2 AP forming BSS. (b) Basement indoor office experiment environment
showing locations of AP and wireless stations and their antennae direction.
PCMCIA jacket which connects an Enterasys RoamAbout 802.11b PC Card. The data rate on the
AP and pocket PCs is set to 11 Mbps (fixed rate), RTS/CTS and power control are disabled, and
the channel is fixed at an unoccupied frequency band with minimal cross-channel interference. We
use WildPackets AiroPeek NX [1], a state-of-the-art commercial WLAN sniffing and analysis
tool, to determine the state of the wireless medium for channel selection and monitoring of
MAC-level transmission activity. The latter, in conjunction with tcpdump traces collected at the
laptop and pocket PCs, is used to infer backlog Markov chain associated with TCP-over-WLAN
dynamics. The experiments in this paper focus on an indoor office environment in the basement
of the Computer Science Building at Purdue University. Figure 2(b) depicts the physical layout.
We also performed benchmarks in a table top configuration where all pocket PCs are co-located
on a conference table which minimizes the influence of distance on signal strength and resultant
throughput.
C. Simulation Set-up
We usens [3] with CMU’s WLAN extension (version 2.27) to simulate the dumbbell wire-
less/wireline WLAN topology corresponding to Figure 1, where the IP network cloud is replaced
by a single router. Wireline bandwidth is set to 100 Mbps, with link latency between router and
7
AP set to 1 msec and the link latency between wireline hosts and router set to 10 msec. The
IEEE 802.11 BSS data rate is set at 11 Mbps and ACK frames are transmitted at 2 Mbps.
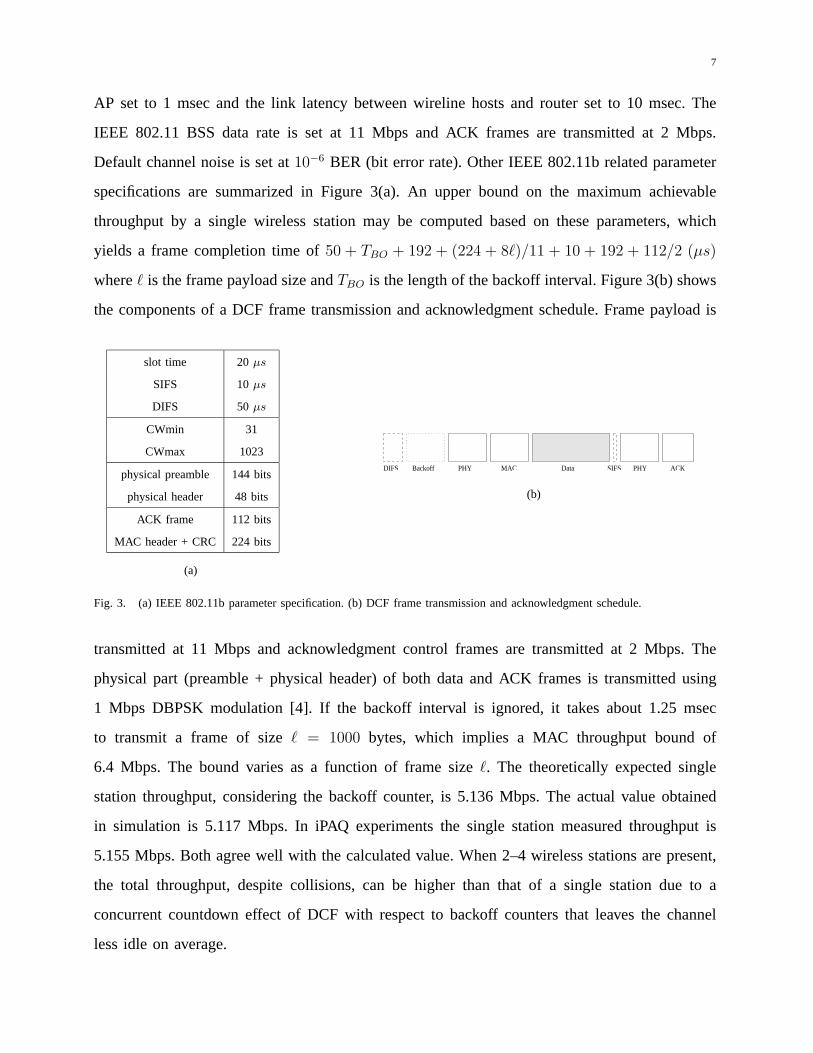
Default channel noise is set at10−6 BER (bit error rate). Other IEEE 802.11b related parameter
specifications are summarized in Figure 3(a). An upper bound on the maximum achievable
throughput by a single wireless station may be computed based on these parameters, which
yields a frame completion time of50 + TBO + 192 + (224 + 8`)/11 + 10 + 192 + 112/2 (µs)
where` is the frame payload size andTBO is the length of the backoff interval. Figure 3(b) shows
the components of a DCF frame transmission and acknowledgment schedule. Frame payload is
slot time 20 µs
SIFS 10 µs
DIFS 50 µs
CWmin 31
CWmax 1023
physical preamble 144 bits
physical header 48 bits
ACK frame 112 bits
MAC header + CRC 224 bits
(a)
Data SIFS PHY ACKMACBackoffDIFS PHY
(b)
Fig. 3. (a) IEEE 802.11b parameter specification. (b) DCF frame transmission and acknowledgment schedule.
transmitted at 11 Mbps and acknowledgment control frames are transmitted at 2 Mbps. The
physical part (preamble + physical header) of both data and ACK frames is transmitted using
1 Mbps DBPSK modulation [4]. If the backoff interval is ignored, it takes about 1.25 msec
to transmit a frame of size = 1000 bytes, which implies a MAC throughput bound of
6.4 Mbps. The bound varies as a function of frame size`. The theoretically expected single
station throughput, considering the backoff counter, is 5.136 Mbps. The actual value obtained
in simulation is 5.117 Mbps. In iPAQ experiments the single station measured throughput is
5.155 Mbps. Both agree well with the calculated value. When 2–4 wireless stations are present,
the total throughput, despite collisions, can be higher than that of a single station due to a
concurrent countdown effect of DCF with respect to backoff counters that leaves the channel
less idle on average.

8
III. C HARACTERISTICS OFIEEE 802.11 DCF PERFORMANCE
A. DCF Throughput: Agility
The first issue concerns the throughput of DCF which has been claimed to degrade signifi-
cantly as the contention level—offered load or number of stations—is increased. We start with
simulation-based performance evaluation, then incorporate the impact of physical layer channel
diversity and dynamic code rate shifting using experimentation.
1) Equidistant DCF Throughput—Simulation:We consider a BSS configuration where wire-
less nodes are symmetrically placed on a circle of radius 10 m with the AP located at the center.
Equidistance and symmetry affect maximal DCF contention. Single point location—a logical
configuration commonly used in contention-based MAC studies where all stations, including
the AP, are co-located at a single point, random location, and other layout configurations are
considered in Section III-A.3. Figure 4(a) shows simulated DCF throughput as a function of total
offered load for 2–100 wireless stations where each station generates an equal share of the offered
load. Individual offered load is constant bit rate traffic with a small uniformly random inter-packet
noise (within 10% of the packet spacing interval) added to break up deterministic synchronization
0
1
2
3
4
5
6
3.5 4 4.5 5 5.5 6 6.5
Thr
ough
put (
Mb/
s)
Offered Load (Mb/s)
number of nodes 2number of nodes 5
number of nodes 10number of nodes 16number of nodes 30number of nodes 50
number of nodes 100
(a)
0
0.2
0.4
0.6
0.8
1
3.5 4 4.5 5 5.5 6 6.5
Col
lisio
n R
ate
Offered Load (Mb/s)
number of nodes 2number of nodes 5
number of nodes 10number of nodes 16number of nodes 30number of nodes 50
number of nodes 100
(b)
Fig. 4. (a) Simulated IEEE 802.11 DCF throughput as a function of offered load for 2–100 wireless stations. (b) Corresponding
DCF collision rate.
effects. A single simulation run lasts for 200 seconds during which approximately 180,000 frame
transmission events are generated with 10 wireless stations at saturation. Experiments also last
for 200 seconds. We exclude the first 100 seconds from the reported performance measurements

9
to remove transient effects. First, we note that the 2 and 5 station throughput is higher than the
single station throughput of 5.117 Mbps due to the concurrent countdown effect (cf. Section II-
C). The single station throughput is not shown to reduce clutter. As offered load is increased,
throughput grows linearly until a saturation point is reached at which throughput ceases to
increase; in fact, it may decline. Onset of saturation throughput occurs after a critical offered
load where the collision rate increases sharply as shown in Figure 4(b). When the number of
stations is large, both peak and saturation throughput decrease and their relative gap widens.
The drop in peak and saturation throughput as a function of the number of wireless stations is
shown in Figure 5. Throughput decline is overall gradual with saturation throughput exhibiting
a faster drop. At a moderate load of 16 wireless stations, peak throughput decreases 5.9% from
the throughput level of 2 wireless stations and saturation throughput decreases by 11.4%. At a
heavy load of 50 stations, the reductions are 11.4% and 24.2%, respectively. Peak throughput—
0
1
2
3
4
5
6
0 20 40 60 80 100
Thr
ough
put (
Mb/
s)
Number of Nodes
peak throughputsaturation throughput
Fig. 5. Decrease in DCF peak and saturation throughput as the number of wireless stations is increased.
vis-a-vis saturation throughput—is relevant for two reasons. In [9] it is argued that saturation
throughput should be considered as the attainable equilibrium performance measure. We find
that when physical layer channel diversity is incorporated, the gap between peak and saturation
throughput shrinks markedly, and when TCP operates over WLAN the joint actions of DCF and
TCP feedback control drive the baseband channel near the peak throughput level. We discuss
the first point next.
2) Physical Layer Diversity—Experiment:Physical layer channel diversity—a form of mul-
tiuser diversity [23], [39]—plays a significant role in mitigating DCF throughput degradation

10
under heavy contention. Figure 6(a) shows measured throughput of 802.11 DCF from experiments
in the indoor office environment depicted in Figure 2(b). Offered load is increased from 4 Mbps
to 7 Mbps with 2–16 iPAQ pocket PCs competing for the shared channel. UDP is used as
the transport protocol. We observe two differences when compared to equidistant simulated
DCF throughput in Figure 4(a): the overall throughput for 2, 5, 10 and 16 wireless stations is
higher—in the range 5.7–5.876 Mbps for experiment vs. 4.816–5.432 Mbps for simulation—and
the gap between peak and saturation throughput is much narrower. For 16 stations, the gap is
0
1
2
3
4
5
6
4 4.5 5 5.5 6 6.5 7
Thr
ough
put (
Mb/
s)
Offered Load (Mb/s)
number of nodes 2number of nodes 5
number of nodes 10number of nodes 12number of nodes 16
(a)
0
1
2
3
4
5
6
4 4.5 5 5.5 6 6.5 7
Thr
ough
put (
Mb/
s)
Offered Load (Mb/s)
number of nodes 2number of nodes 5
number of nodes 10number of nodes 12number of nodes 16
(b)
Fig. 6. (a) Empirical IEEE 802.11 DCF throughput as a function of offered load for 2, 5, 10, 12, 16 iPAQ pocket PCs in
indoor office environment. (b) Corresponding DCF throughput in indoor table top environment.
5.9% in simulation versus essentially 0% in experiment. Figure 6(b) shows DCF throughput
as a function of offered load from the indoor table top experiment. The less varied physical
layer channel diversity resulting from close station proximity effects a smaller throughput gain
vis-a-vis the indoor office configuration. Figure 7 compares the saturation throughput of DCF
as the number of wireless stations is increased for the indoor office experiment, indoor table top
experiment, and equidistant circle simulation. For 10 or 16 stations, we observe a 1 Mbps (20%)
difference in achieved throughput between simulation and indoor office experiment, indicating
the influence of physical layer diversity. When only a single wireless station is accessing the
channel, saturation throughput—for both simulation and experiment—is in the 5.1–5.2 Mbps
range.
In general, multiuser diversity may result from mobility and time-varying fading effects, and

11
0
1
2
3
4
5
6
2 4 6 8 10 12 14 16
Thr
ough
put (
Mb/
s)
Number of Nodes
indoor office experimentindoor table top experimentequidistant circle simulation
Fig. 7. Comparison of IEEE 802.11 DCF saturation throughput as a function of the number of wireless stations for indoor
office experiment, indoor table top experiment, and equidistant circle simulation.
a scheduler that wishes to harness channel diversity for throughput maximization may try to
allocate the channel at a given moment in time to an user with the best channel condition. In
infrastructure WLAN hot spots where users, for the most part, change their location infrequently,
physical layer channel diversity manifests in a persistent, location-dependent manner. That is,
“advantaged” stations continue to be advantaged, and “disadvantaged” stations remain disad-
vantaged. Figure 8(a) shows the throughput share of 8 wireless stations under different offered
loads in the indoor office environment. We observe that biases in channel diversity are preserved
across different experiments which translates to corresponding biases in individual throughput
share. The bias is location dependent—e.g., switching the pocket PCs makes little difference—
0
0.2
0.4
0.6
0.8
1
4 4.5 5 5.5 6 6.5 7 7.5 8
Thr
ough
put (
Mb/
s)
Offered Load (Mb/s)
node 1node 2node 3node 4node 5node 6node 7node 8
(a)
0
0.2
0.4
0.6
0.8
1
150 155 160 165 170 175 180
Thr
ough
put (
Mb/
s)
Time (sec)
node 1node 3node 5node 7
(b)
Fig. 8. (a) Persistent channel diversity and resultant stratification of throughput share in indoor office WLAN experiment with
8 iPAQ pocket PCs. (b) Persistent throughput stratification over time at offered load 7.4 Mbps for four nodes.

12
determined by the geometry of radio propagation in indoor environments. It is well-known that
signal strength distribution in closed spaces is varied [14], [21], [38], whose theoretical foundation
with respect to persistence, sensitivity, and high variability may be found in the chaotic nature
of radio wave propagation in cavities [36]. DCF exploits this physical layer channel diversity
in two ways: one, by a simple capture effect where a collision between two frames of different
strengths may result in a successful decoding of the dominant frame due to signal strength
differential, and two, by subsequent exponential backoff of the weaker station which amplifies
the access priority that the stronger station receives. In Figure 8(a), we observe that as collision
rate increases with increased offered load, the throughput share of the strongest station increases
due to the reinforcing action of DCF. The DCF amplification effect is reminiscent of “the rich get
richer and the poor get poorer” dynamics. From a system throughput perspective, because DCF
“schedules” stations with stronger signal strength more frequently, system throughput improves
by the maxim of multiuser diversity scheduling [15]. Figure 8(b), which shows throughput time
dynamics of 4 of the 8 pocket PCs over a 30 second time window, indicates that persistent
physical layer channel diversity also holds over time.
3) Non-equidistant DCF Throughput—Simulation:In the CMU wireless extension ofns-
2, capture effect may be considered by an application of SIR (signal-to-interference ratio)
thresholding. We consider four additional BSS configurations where distance-based capture effect
may be isolated and discerned: “line” (configuration) where all stations are aligned 1 m apart
on a line with the AP at one end, “near random” where stations are placed uniformly randomly
inside a disk of radius 10 m with the AP at the center, “far random” where the AP is not at
the center of the random disk but outside at a distance of 20 m from the center, and “single
point” where all nodes, including the AP, are co-located at a single point. Figure 9 shows
simulated DCF throughput as a function of the number of stations for the five configurations.
We observe that the line configuration achieves the highest throughput, closely followed by the
near random configuration. This is expected since channel diversity—due to path loss modeled
by distance—is highest for the line configuration followed by the near random configuration. In
the far random configuration, which is in distant fourth place, relative channel diversity inside
the disk is dampened by the far distance of the wireless stations from the AP. The circle and

13
0
1
2
3
4
5
6
0 20 40 60 80 100
Thr
ough
put (
Mb/
s)
Number of Nodes
linenear random
circlefar randomsingle point
Fig. 9. Simulated DCF throughput as a function of the number of stations for line, near random, far random, single point, and
circle configurations.
single point configurations achieve similar throughputs as the far random configuration due to
their lack of diversity and resultant unbiased DCF multiple access competition.
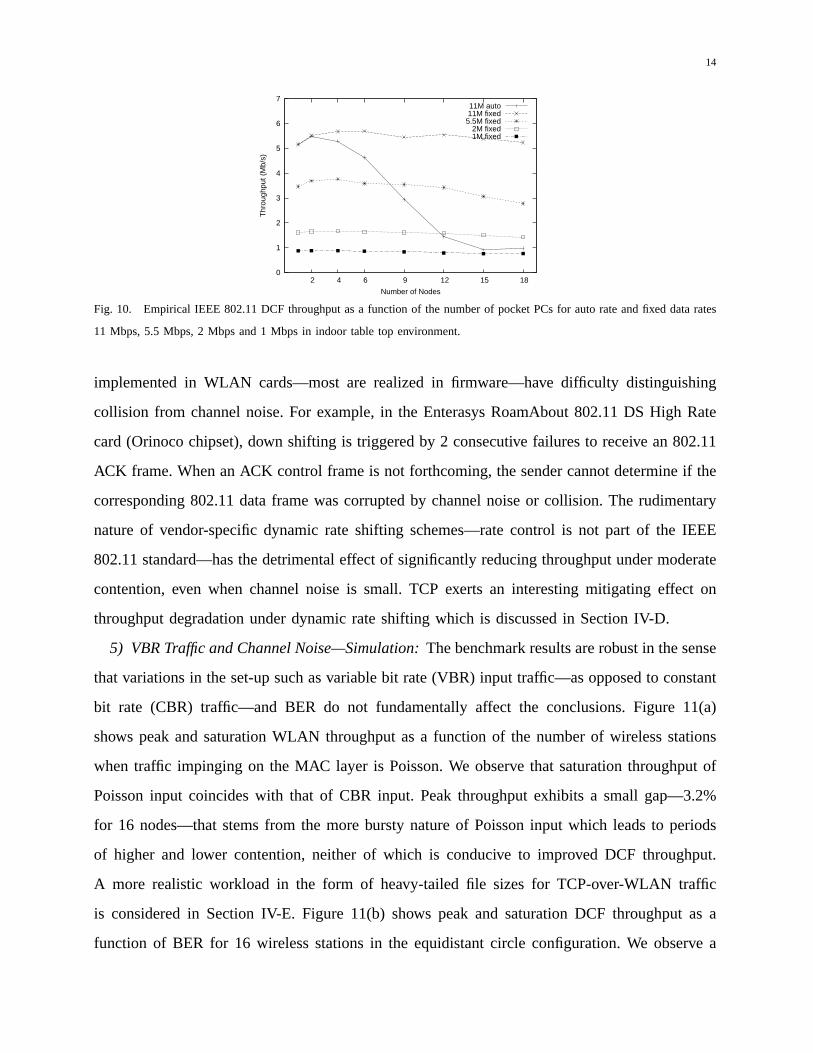
4) Dynamic Rate Shifting—Experiment:In [41] it is shown that empirical IEEE 802.11b
throughput in an infrastructure WLAN decreases from above 6 Mbps to below 2 Mbps as the
number of stations is increased from 1 to 14. Perception of significant throughput degradation at
moderate load is widespread, for example, in [19] it is claimed that “as the number of contending
stations increases, aggregate capacity drops precipitously (to less than 1 Mb/s with 10 contending
stations)” which is attributed to the multiple access nature of IEEE 802.11 CSMA/CA. We do
not doubt the validity of the empirical observations—we believe they are factually accurate—
but we question the conclusions drawn from the observations, in particular, the assignment of
responsibility to DCF.
Figure 10 shows IEEE 802.11 DCF throughput as a function of the number of stations from
an indoor table top experiment for different data rates of 802.11b—11 Mbps, 5.5 Mbps, 2 Mbps
and 1 Mbps—and dynamic rate shifting (“auto rate”) implemented in Enterasys WLAN cards. At
fixed data rates, the throughput curves are relatively flat as the number of pocket PCs is increased
from 2 to 18, consistent with the graded throughput behavior seen in Figure 7. When auto rate
is enabled—the default mode in most WLAN cards—aggregate throughput declines drastically
as seen in Figure 10, dropping below 1 Mbps at 15 wireless stations. The prominent throughput
decline, however, is not due to DCF. Testing of several 802.11b vendor cards with AiroPeek
NX [1] monitoring MAC transmission activity reveals that the dynamic rate shifting algorithms
14
0
1
2
3
4
5
6
7
2 4 6 9 12 15 18
Thr
ough
put (
Mb/
s)
Number of Nodes
11M auto11M fixed5.5M fixed
2M fixed1M fixed
Fig. 10. Empirical IEEE 802.11 DCF throughput as a function of the number of pocket PCs for auto rate and fixed data rates
11 Mbps, 5.5 Mbps, 2 Mbps and 1 Mbps in indoor table top environment.
implemented in WLAN cards—most are realized in firmware—have difficulty distinguishing
collision from channel noise. For example, in the Enterasys RoamAbout 802.11 DS High Rate
card (Orinoco chipset), down shifting is triggered by 2 consecutive failures to receive an 802.11
ACK frame. When an ACK control frame is not forthcoming, the sender cannot determine if the
corresponding 802.11 data frame was corrupted by channel noise or collision. The rudimentary
nature of vendor-specific dynamic rate shifting schemes—rate control is not part of the IEEE
802.11 standard—has the detrimental effect of significantly reducing throughput under moderate
contention, even when channel noise is small. TCP exerts an interesting mitigating effect on
throughput degradation under dynamic rate shifting which is discussed in Section IV-D.
5) VBR Traffic and Channel Noise—Simulation:The benchmark results are robust in the sense
that variations in the set-up such as variable bit rate (VBR) input traffic—as opposed to constant
bit rate (CBR) traffic—and BER do not fundamentally affect the conclusions. Figure 11(a)
shows peak and saturation WLAN throughput as a function of the number of wireless stations
when traffic impinging on the MAC layer is Poisson. We observe that saturation throughput of
Poisson input coincides with that of CBR input. Peak throughput exhibits a small gap—3.2%
for 16 nodes—that stems from the more bursty nature of Poisson input which leads to periods
of higher and lower contention, neither of which is conducive to improved DCF throughput.
A more realistic workload in the form of heavy-tailed file sizes for TCP-over-WLAN traffic
is considered in Section IV-E. Figure 11(b) shows peak and saturation DCF throughput as a
function of BER for 16 wireless stations in the equidistant circle configuration. We observe a

15
0
1
2
3
4
5
6
0 20 40 60 80 100
Thr
ough
put (
Mb/
s)
Number of Nodes
peak throughput (CBR)peak throughput (VBR)
saturation throughput (CBR)saturation throughput (VBR)
(a)
0
1
2
3
4
5
6
0 2e-05 4e-05 6e-05 8e-05 0.0001 0.00012 0.00014
Thr
ough
put (
Mb/
s)
BER
peak throughputsaturation throughput
(b)
Fig. 11. (a) Peak throughput and saturation throughput for CBR and Poisson VBR input traffic. (b) Peak and saturation
throughput as a function of BER for 16 wireless stations.
near-linear decline in throughput as BER is increased from10−6—a typical indoor noise level [2],
[18]—to 0.00012, a two orders of magnitude increase. Peak and saturation throughput merge for
large BER where frame errors from channel noise dominate their counterpart from collision. A
discussion of BER’s influence on throughput may be found in [13].
B. DCF Fairness and Jitter
In this section, we discuss the sensitive dependence of DCF fairness and jitter on offered load,
and issues related to its control.
1) DCF Fairness—Diversity Amplification:Figure 12 shows fairness, presented as the ratio
of minimum throughput over maximum throughput across participating stations, as a function
of offered load for 2–100 stations in the equidistant circle configuration simulation. We observe
a sharp degradation of fairness at a critical offered load commensurate with a sharp increase
in the collision rate (cf. Figure 4(b)). Unlike throughput, which is mitigated by physical layer
channel diversity, unfairness is further amplified by DCF. This is discernible on a per-flow
basis in Figure 13(a) where the individual throughput share of 16 wireless stations in a line
configuration is shown as a function of offered load. Up to the critical offered load, throughput
share is overall equitable. After the critical load where collision rate sharply increases, individual
throughput share stratifies into persistent levels whose total width—the minimum throughput

16
0
0.2
0.4
0.6
0.8
1
3.5 4 4.5 5 5.5 6 6.5
(Min
Th)
/(M
ax T
h)
Offered Load (Mb/s)
number of nodes 2number of nodes 5
number of nodes 10number of nodes 16number of nodes 30number of nodes 50
number of nodes 100
Fig. 12. Simulated DCF fairness as a function of offered load for 2–100 wireless stations in equidistant circle configuration.
over maximum throughput ratio—continues to expand. DCF exerts a self-reinforcing “the rich
get richer the poor get poorer” effect that amplifies unfairness triggered by multiuser diversity. In
the line configuration, multiuser diversity stems from SIR capture effect that puts distant stations
at a competitive disadvantage. Figure 13(b), which plots the corresponding throughput share of
16 wireless stations in the equidistant circle configuration, shows that when persistent multiuser
diversity is removed, so is DCF’s diversity amplification effect.
0
0.1
0.2
0.3
0.4
0.5
0.6
3.5 4 4.5 5 5.5 6 6.5 7 7.5 8
Thr
ough
put (
Mb/
s)
Offered Load (Mb/s)
(a)
0
0.1
0.2
0.3
0.4
0.5
0.6
3.5 4 4.5 5 5.5 6 6.5 7 7.5 8
Thr
ough
put (
Mb/
s)
Offered Load (Mb/s)
(b)
Fig. 13. (a) Simulated DCF fairness with respect to individual throughput share as a function of offered load for 16 wireless
stations in line configuration. (b) Corresponding DCF fairness plots in equidistant circle configuration.
2) DCF Jitter—Sensitivity:We consider jitter performance—in the sense of throughput vari-
ation over time—at different offered loads. We use normalized standard deviation to capture
throughput variability in time. Figure 14(a) shows normalized standard deviation as a function

17
of offered load for 2–100 stations in the equidistant circle configuration. We observe that at the
critical load where collision rate sharply increases (and fairness sharply degrades), jitter exhibits
0
0.1
0.2
0.3
0.4
0.5
0.6
0.7
0.8
0.9
1
3.5 4 4.5 5 5.5 6 6.5
Nor
mal
ized
Sta
ndar
d D
evia
tion
Offered Load (Mb/s)
number of nodes 2number of nodes 5
number of nodes 10number of nodes 16number of nodes 30number of nodes 50
number of nodes 100
(a)
0
0.1
0.2
0.3
0.4
0.5
0.6
0.7
0 20 40 60 80 100
Thr
ough
put (
Mb/
s)
Time (sec)
offered load = 5.1Mb/soffered load = 5.2Mb/s
(b)
Fig. 14. (a) Simulated DCF jitter performance—captured as normalized standard deviation of throughput—for the equidistant
circle configuration. (b) Throughput variation over time before (5.1 Mbps) and after (5.2 Mbps) critical offered load.
a sudden jump. Operating an infrastructure WLAN in the saturation regime need not degrade
throughput, however, it markedly increases throughput variability which has bearing on VoIP
(voice-over-IP) and multimedia streaming applications. Figure 14(b) shows throughput variation
over time for a wireless station—there are a total of 16 nodes—when offered load is slightly
below (5.1 Mbps) the critical offered load and when it is slightly larger (5.2 Mbps). Second-order
throughput and delay performance experiences a phase transition at the critical offered load.
3) Link Layer Rate Control:In [20], [44] link layer rate control is proposed to mitigate
CSMA/CA throughput decline under excessive offered load. Our results show that unless the
number of wireless stations in a BSS is very large, DCF throughput degrades gracefully, aided
by DCF’s ability to exploit physical layer channel diversity. Fairness and jitter, however, suffer
significantly under excessive offered load, and rate controls that limit traffic impinging on the
802.11 MAC can improve fairness and jitter. Viewing the “dome shaped” static input-output
profile of IEEE 802.11 DCF (cf. Figure 4(a)) as a dynamic feedback control problem, it is not
difficult to design a PI controller that is asymptotically stable and efficient. The well-known
instability problem of ALOHA (and ALOHA-like) contention-based protocols [22], [34] applies
only in the queuing sense—backlog growing unboundedly if the application layer arrival rate

18
exceeds the link layer service rate—but not for maximizing the link layer’s throughput which is
a function of the controlled link layer arrival rate. For open-loop applications such as VoIP link
layer rate shaping may be harmful. With IEEE 802.11e support, prioritized MAC access may be
affected using EDCF which significantly reduces jitter. Figure 15 shows MAC throughput over
time in the saturation regime for high- and normal-priority traffic under 802.11e. For closed-
0
0.1
0.2
0.3
0.4
0.5
0.6
0.7
0 20 40 60 80 100
Thr
ough
put (
Mb/
s)
Time (sec)
high prioritynormal priority
Fig. 15. Throughput variability in time under IEEE 802.11e EDCF for high- and normal-priority traffic under saturation.
loop or elastic applications such as TCP-based file transfer—the dominant constituent of Internet
traffic which has also been confirmed for WLANs [7], [25]—link layer rate control may be
beneficial, especially due to the increased collision rate associated with the saturation regime (cf.
Figure 4(b)) that may translate to increased frame error rate. We established in Section III-A.4 that
dynamic rate shifting implemented in WLAN cards easily confuse collision with channel noise
leading to significant throughput degradation. In the case of TCP which is sensitive to spurious
packet loss this may prove to be problematic. Interestingly TCP-over-WLAN performance does
not suffer under this problem, achieving performance on par with wireline TCP. The reasons
underlying this surprising agility is the subject of the next section.
IV. TCP-OVER-WLAN PERFORMANCE
We first discuss throughput performance of TCP-over-WLAN, followed by explication of its
prowess, and benchmarking of receiver-side traffic controls aimed at improving fairness/jitter.
The latter is relevant when TCP coexists with VoIP. We use simulation to study the details of
TCP-over-WLAN dynamics augmented by experimental benchmarks.

19
A. Scalable Throughput
It is known from steady-state TCP analysis [31] that TCP throughput depends polynomially
on packet loss rate (i.e.,∝ p−1/2) which renders TCP sensitive to spurious packet loss. An
important focus of past TCP-over-Wireless research [8], [33] has been distinguishing channel
noise from congestion, so that TCP’s congestion control may be desensitized against random
packet loss. Pronounced collision, a form of congestion on the wireless segment, can in indoor
environments dominate channel noise—the reason why WLAN throughput, under the action of
dynamic rate shifting, drastically degrades when subject to moderate contention (cf. Figure 10)—
and significantly diminish TCP throughput. To evaluate TCP-over-WLAN performance under
multiple access contention, we use the single point simulation configuration which suffers under
the heaviest collision and throughput drop, providing maximal challenge to TCP. We consider
a client/server environment where wireless stations, acting as clients, fetch files from wireline
servers. This incorporates the TCP data/ack collision problem [17], [42]. We use TCP NewReno
without selective and delayed ACK, and study infinite source sessions in steady-state. TCP
sessions with heavy-tailed file transfers are considered separately. Figure 16(a) shows TCP
throughput as a function of the number of wireless stations. As multiple access contention
is increased from 1 to 100, TCP-over-WLAN throughput remains flat. The same goes for TCP
ACK traffic which is at the same packet rate (pps) but smaller data rate (bps). In contrast, UDP
0
1
2
3
4
5
6
0 20 40 60 80 100
Thr
ough
put (
Mb/
s)
Number of Nodes
TCP DATA (1500B)TCP ACK (40B)
UDP (1000B)
(a)
0
0.1
0.2
0.3
0.4
0.5
0.6
0.7
0 20 40 60 80 100
Col
lisio
n R
ate
Number of Nodes
TCPUDP
(b)
Fig. 16. (a) TCP-over-WLAN throughput and ACK traffic as a function of the number of wireless stations; UDP throughput
is shown for comparative purposes. (b) Corresponding collision rate.

20
(i.e., DCF) throughput declines under high contention. Figure 16(b) shows the corresponding
collision rate experienced by TCP data and ACK frames at the DCF MAC layer which also
remains essentially flat. We use a MSS of 1500 bytes for the above benchmarks but the same
qualitative profile holds for other frame sizes. The AP has a buffer size of 200 (in frame units),
a capacity in the same range as the Enterasys RoamAbout R2 AP.
Figure 17 shows frame error rate, collision rate, channel error rate (FER + collision rate),
frame discard rate, and AP buffer drop rate as the number of contending stations is increased.
At the given BER level10−6, common for indoor environments [2], [18], collisions make up
the bulk of frame errors. However, no frames are discarded by the 802.11 MAC layer due to
DCF’s ARQ which performs 7 retransmissions under exponential backoff before giving up. The
loss rate at the AP shows that it is downstream buffer overflow at the AP—a classical wireline
bottleneck that exists in other pure wireline contexts such as low bandwidth access links [35]—
that throttles the application layer data rate. The flat TCP throughput curve is caused by the flat
0
0.02
0.04
0.06
0.08
0.1
0.12
0.14
0 20 40 60 80 100
Number of Nodes
collision ratechannel error rate
frame error rateMAC discard rate
AP buffer drop rate
Fig. 17. Frame error rate, collision rate, channel error rate, frame discard rate, and AP buffer drop rate as a function of the
number of stations.
WLAN collision rate. Collision rate stays flat even if the AP is endowed with infinite buffer
capacity. TCP-over-WLAN is able to operate at a small, constant collision rate independent of
the number of TCP flows competing for the shared wireless baseband bandwidth. We refer to this
as TCP-over-WLAN’s scalable throughput property. The TCP data/ack collision problem raised
in [17], [42] does not materialize. In Section IV-C we explicate how the scalable throughput
property comes about.

21
B. Efficiency: UDP Emulation
To evaluate how efficiently TCP utilizes WLAN capacity, we emulate TCP using UDP in a rate-
matched, open-loop fashion wheren downstream UDP sessions transmit 1500 byte data frames
at λ pps that is matched byn upstream UDP flows transmitting 40 byte packets (mimicking ACK
packets) at the same rate. From Section III we know that under excessive offered load collision
increases sharply and DCF throughput declines, albeit gradually. Our aim is to understand at
what offered load TCP drives DCF which determines channel utilization and capacity. Figure 18
0
1
2
3
4
5
6
30 32 34 36 38 40 42 44
Thr
ough
put (
Mb/
s)
Frame Generation Rate (frame/sec)
Downstream UDP (1500B)Upstream UDP (40B)
TCP
Fig. 18. UDP emulation of TCP with 10 wireless stations with varying frame generation rateλ.
shows downstream and upstream UDP throughput as the frame generation rateλ is varied. We
also show the throughput attained by TCP under the same benchmark setting. We observe that
UDP throughput increases with increased offered load until it hits a peak—coinciding with TCP’s
throughput—after which it declines due to increased collision. The UDP emulation result shows
that when the AP-to-wireless station traffic ratio (in pps) isn : 1, a typical scenario for WLAN
hot spots that are used as Internet access networks, TCP is able to drive DCF at its maximal
throughput level. In other words, TCP-over-WLAN operates the WLAN at its peak throughput.
C. TCP-over-WLAN Dynamics: Effective Contention
1) Markov Chain Analysis—Negative Drift:Our goal is to understand how TCP-over-WLAN
is able to achieve a constant collision rate over a wide contention range of 1–100 wireless stations.
We define a Markov chain that tracks TCP-over-WLAN dynamics at the WLAN level: at any
instant in time, the state of the birth-death Markov chain is given by the number of backlogged

22
wireless stations, including the AP, where backlogged means that the MAC protocol—typically
implemented as firmware in NICs—has received one or more frames from the upper layer that
have not been successfully transmitted yet. Thus the backlog chain counts the number of actually
active stations participating in the multiple access competition at an instant in time. In simulation,
it is straightforward to infer the backlog Markov chain from measurement logs: starting from
time 0, we have a point process whose realization or sample path we track. Conditioned on
these states, we tabulate next state transition statistics from which the transition rates can be
estimated. Figure 19 shows the backlog Markov chain inferred from a single point configuration
simulation with 20 wireless stations. Starting from “counting” state 3, we see a strong negative
0
1 0.06
2 4 5 630.37
0.29
0.35 0.34 0.37
10.53
0.11
0.59 0.63 0.63
0.03
0.360.34
Fig. 19. TCP-over-WLAN dynamics: inferred backlog Markov chain from simulation benchmark with 20 wireless stations.
drift—rate 0.53 to state 2 versus rate 0.11 to state 4—that ends at state 6. In the client/server
wireless/wireline TCP environment, the AP is a conduit for all downstream traffic from wireline
servers to wireless clients, and vice versa for the resultant upstream ACK traffic. When the AP
successfully grabs the shared channel, it may send a TCP data frame to a wireless station with
an existing backlog—in which case the counting state remains put (i.e., a self-loop)—or the
AP may send it to a non-backlogged station in which case the counting state increases by 1.
The full Markov chain contains micro-states that count the number of backlogged packets per
station. The chain shown in Figure 19 is a projection of the full chain. A client station, upon
grabbing the channel, may have more than one frame in its backlog, in which case the counting
state stays put; otherwise, it is decremented by 1.
DCF’s contribution to the negative drift is as follows: the AP in a BSS, by virtue of its
conduit role with an : 1 traffic ratio, is in a special forwarding position. However, under DCF
all wireless stations, including the AP, are treated equal with respect to channel access. For the
counting chain to grow, it requires that the AP transmit a TCP data frame. But the larger the
counting statek, the smaller the probability (≈ 1/k) that the AP will win in the channel grabbing
competition. Conversely, the larger the likelihood (≈ 1 − 1/k) that one of the wireless stations

23
will win the competition. Hence the strong negative drift that pulls the Markov chain toward
the origin. Figure 20(a) shows the equilibrium probability distribution of the Markov chain.
Figure 20(b) shows a typical sample path of TCP-over-WLAN dynamics over the state-space
of backlogged stations. Figure 21 shows the average, maximum, and average plus two standard
0
0.1
0.2
0.3
0.4
0.5
0.6
0 1 2 3 4 5 6 7
Ste
ady-
Sta
te P
roba
bilit
y
Number of Backlogged Nodes
(a)
0
1
2
3
4
5
6
0 0.2 0.4 0.6 0.8 1N
umbe
r of
Bac
klog
ged
Nod
es
Time (sec)
(b)
Fig. 20. (a) Equilibrium probability distribution of backlog Markov chain with 20 wireless stations. (b) Sample path of
TCP-over-WLAN dynamics over the state-space of backlogged stations.
deviations counting states, in equilibrium, of all backlog Markov chains for 1–100 stations in the
simulation benchmarks of Figure 16. The average counting state is 2.2, even when there are 100
contending wireless stations. This implies that the WLAN operates under an effective contention
level of 2–3 wireless stations. 95% of all data points fall within two standard deviations of the
mean which, in Figure 21, is around 4 active stations. The maximum is 7 active stations which
are reached less than 5% of the time. Pertinent WLAN performance measures such as MAC
throughput and collision rate also correspond to that of 2–3 wireless stations, albeit in saturation
mode. The throughput and collision rate for 2 wireless stations may be discerned in Figure 4.
Overall it is desirable to operate a WLAN at an effective contention level of 2–3 wireless stations,
even in saturation mode.
2) Verification through Experiment:Simulation is well-suited for carrying out accurate back-
log Markov chain analysis because all relevant events can be logged with certainty and there
is a global clock that makes event synchronization simple. In experimental benchmarking, there
is system noise and synchronization of events, given only local clocks, is an inherent technical

24
0
1
2
3
4
5
6
7
0 20 40 60 80 100
Num
ber
of B
ackl
ogge
d N
odes
Number of Nodes
maxavg + 2*std
average
Fig. 21. Average counting state in equilibrium for 1–100 wireless station simulation benchmark.
problem. With the aid of AiroPeek NX, a state-of-the-art commercial WLAN sniffing and analysis
tool, and tcpdump logging at the laptop and all pocket PCs, we are able to estimate the backlog
Markov chain using sequential event ordering at the AiroPeek sniffer. This method works but
with a caveat: due to channel noise, collision, and system noise, not all frame transmission
events are sensed by the sniffer. This leads to ambiguity and resultant frames that cannot be
resolved. The fraction of such frames, however, is less than 2%, and we estimate the backlog
chain after excluding these frames. Figure 22 shows the inferred Markov chain from a table top
experiment with 15 pocket PCs. The average counting state is 2.59—a little higher than that of
simulation-based benchmark results—which we attribute to the aforementioned inaccuracies. A
strong negative drift is discernible consistent with backlog Markov chain analysis.
0
1
2 430.30
0.51
0.150.19
10.57
0.26
0.68
0.17
0.08
7 8
0.09 0.25
0.83 0.75
0.080.17
5 6
0.14 0.13
0.75 0.79
0.11
Fig. 22. Backlog Markov chain inferred from table top client/server TCP benchmark experiment with 15 iPAQ pocket PCs.
3) DCF vs. TCP Feedback Control Contribution to Negative Drift:Both DCF and TCP
feedback control contribute to the strong negative drift in the backlog Markov chain, with DCF
being the dominant factor. Figure 23 shows the average and average plus two standard deviation
counting states of open-loop UDP emulation of TCP with an : 1 AP-to-wireless client traffic
ratio for 5–100 wireless stations. For a given number of wireless stations, the traffic rateλ
is set at a value that achieves peak throughput (cf. Figure 18). It turns out that the relation

25
nλ = 380 fps holds for peak throughput. Figure 23 also shows the counting states for TCP for
comparative purposes. The average counting state of UDP emulation is in the 2–3 range, closer
0
1
2
3
4
5
6
7
0 20 40 60 80 100
Num
ber
of A
ctiv
e N
odes
Number of Nodes
avg + 2*std (UDP emulation)avg + 2*std (TCP)
average (UDP emulation)average (TCP)
Fig. 23. Average counting state of UDP emulation for 5–100 wireless stations.
to 3, whereas in the case of TCP it is closer to 2. We observe the characteristic flatness of the
effective contention level as the number of wireless stations is increased from 5 to 100. Since
UDP emulation is open-loop, TCP’s self-clocking feedback mechanism doesn’t enter into play,
and it is DCF’s self regulating mechanism (cf. Section IV-C.1) along with then : 1 traffic ratio
characteristic of hot spot infrastructure WLANs that leads to scalable performance. The average
plus two standard deviation curve lies in the 5–6 counting stage range, somewhat higher than
the 3–4 range for TCP. Qualitatively the scalable throughput property is achieved by DCF alone,
although quantitatively the counting states are a little higher without TCP running on top of
DCF. It is in the latter that TCP’s self-clocking feedback mechanism additionally contributes to
negative drift in the backlog chain.
D. Dynamic Rate Shifting under TCP-over-WLAN
In Section III-A.4 we showed that dynamic rate shifting implemented in WLAN cards easily
confuse collision with channel noise resulting in significant throughput degradation even under
moderate load when channel conditions are good. Figure 24 shows empirical TCP throughput in
the indoor office environment for auto rate and fixed rates 11, 5.5, 2, and 1 Mbps as the number
of contending iPAQ pocket PCs is increased from 1 to 14. Unlike in Figure 10, we observe
a flat throughput curve under auto rate that is facilitated by then : 1 traffic ratio of hot spot
WLANs and the mitigating influence of TCP’s self-clocking mechanism. TCP-over-WLAN, by

26
0
1
2
3
4
5
6
0 2 4 6 8 10 12 14
Thr
ough
put (
Mb/
s)
Number of Nodes
11M auto11M fixed5.5M fixed
2M fixed1M fixed
Fig. 24. Empirical TCP throughput as a function of the number of pocket PCs for auto rate and fixed data rates 11 Mbps,
5.5 Mbps, 2 Mbps and 1 Mbps in indoor office environment.
operating the shared baseband channel at an effective contention level of 2–3 wireless stations,
is able to keep the collision rate in check preventing frequent occurrence of two consecutive
missing 802.11 ACK frames that trigger downshifting to fallback rates. With 14 pocket PCs,
less than 0.5% of IEEE 802.11 data frames carrying TCP payload are transmitted at fallback
rate 5.5 Mbps (or below) under dynamic rate shifting—data frames with 2 and 1 Mbps data
rates are essentially nonexistent—whose low occurrence stems from the fact that less than 0.1%
of 802.11 ACK frames are missing back-to-back. The higher fraction (0.5%) of data frames
transmitted at fallback rates is due to an asymmetry in the downshift/upshift procedure: upshift
in data rate is instituted more conservatively than downshift. Nonetheless, their low frequency
renders their performance impact negligible.
E. Heavy-Tailed File Sizes
TCP file transfer constitutes the bulk of Internet traffic and file sizes tend to be heavy-tailed [32]
which has also been noted for WLANs [7], [25]. We consider on/off TCP file transfer workload
with exponential session interarrival time—mean 20 msec—and heavy-tailed files modeled by
a Pareto distribution with tail index 1.3 and location parameter 1000. The simulation was run
for 1000 seconds to allow for the sample mean to converge to the population mean, a process
significantly slower than with light-tailed distributions. The population and sample means were
4.333 and 4.281 (in packet units), respectively. Figure 25(a) shows TCP throughput under heavy-
tailed and infinite source workloads as the number of wireless stations is increased. For the

27
given session interarrival time, it requires 20 stations to offer sufficient load and reach maximum
throughput. The 500 Kbps gap with infinite source TCP stems from the overhead associated with
frequent connection set-up and tear-down of short-lived TCP sessions which make up the majority
0
0.5
1
1.5
2
2.5
3
3.5
4
4.5
5
0 20 40 60 80 100
Thr
ough
put (
Mb/
s)
Number of Nodes
infinite sourceheavy-tailed
(a)
0
1
2
3
4
5
6
0 20 40 60 80 100
Num
ber
of B
ackl
ogge
d N
odes
Number of Nodes
average (infinite source)average (heavy-tailed)
avg + 2*std (infinite source)avg + 2*std (heavy-tailed)
(b)
Fig. 25. (a) TCP throughput with Pareto file size distribution vs. infinite source as a function of number of wireless stations.
(b) Corresponding comparison of average and average plus two standard deviation counting states.
of TCP sessions. Figure 25(b) shows the corresponding backlogged station plot for average and
average plus two standard deviation counting states. When offered load is sufficiently high, we
find close agreement between heavy-tailed and infinite source workload with respect to effective
contention level. The throughput curve is flat thereafter, showing the scalable throughput property
of TCP-over-WLAN in the presence of bursty workload.
F. TCP-over-WLAN Mitigation: Persistent Unfairness
In Sections III-A.2 and III-B.1 we showed that physical layer diversity in conjunction with
DCF’s diversity amplification effect leads to persistent unfairness across both space and time.
Persistent unfairness is a characteristic trait of WLANs and different from transient unfairness
stemming from AP buffer overflow. The latter predominantly affects short-lived flows, the
very flows where a 200% slowdown—e.g., file transfer completion time increased from 1 to
3 seconds—does not mean as much QoS perception-wise as a slowdown from 5 to 15 minutes
for long-lived connections. In the preceding sections, we demonstrated the mitigating influence
of TCP-over-WLAN with respect to throughput, including a neutralizing effect on dynamic rate

28
shifting which easily confuses collision with channel noise. Figure 26 shows the mitigating
influence of TCP-over-WLAN with respect to persistent unfairness for 14 pocket PCs in the
indoor office environment. Without TCP, WLAN throughput exhibits significant variation among
0
0.1
0.2
0.3
0.4
0.5
0.6
0.7
1 2 3 4 5 6 7 8 9 10 11 12 13 14
Thr
ough
put (
Mb/
s)
Node ID
UDPTCP
Fig. 26. The mitigating influence of TCP-over-WLAN on persistent unfairness for 14 iPAQ pocket PCs in indoor office
environment.
the 14 wireless stations caused by physical layer channel diversity. Throughput share is distributed
evenly across the range 232–572 Kbps with a min/max ratio of 0.41. With TCP, unfairness is
markedly reduced where stations who were receiving an excessive share get their throughput
reduced, and vice versa for stations in disadvantaged locations. The mitigating influence of
TCP-over-WLAN encompasses both throughput and fairness.
G. Receiver-Side Traffic Control
TCP-over-WLAN achieves scalable throughput by operating DCF at an effective contention
level of 2–3 wireless stations, albeit in the saturation regime. Reduced contention also helps
alleviate persistent unfairness. The collision rate for 2–3 stations in saturation is not sufficiently
large to cause IP datagram loss on the WLAN segment due to DCF’s ARQ, although it may
increase jitter that can adversely influence other flows sharing the wireless medium such as
VoIP. The dominant contributor of jitter is buffer overflow at the AP (cf. Figure 17) due to a
classical wireline bandwidth mismatch problem. If priority queuing at the AP and prioritized
channel access—both part of IEEE 802.11e—is supported, then jitter for high priority flows can
be kept in check (cf. Figure 15 in Section III-B.3). An alternative approach to jitter control that
is legacy system compatible is receiver-side traffic control proposed in [35] for improving TCP

29
performance over low bandwidth wireline access links. By adjusting the advertised window in the
network/link layer of the protocol stack at end systems—transparent to TCP and application—it
is possible to throttle traffic rate to prevent buffer overflow and excessive queuing1. In Linux,
transparent receiver-side TCP traffic control can be implemented using a dynamically loadable
module that registers callback functions with IP hooks in netfilter—a kernel facility that extends
IP chains—available in Linux 2.4+. In Windows, transparent receiver-side control can be realized
as an intermediate driver in NDIS. We have implemented receiver-side advertised window
control and virtual delay control—a complement to advertised window control that delays ACK
transmission at receiver-side to emulate elongated round-trip time (RTT) to pace the sender’s
data rate—as netfilter modules in Linux.
Figure 27(a) shows TCP throughput variation over time for 10 pocket PCs in the indoor office
environment without receiver-side traffic control. We observe significant fluctuations resulting
from buffer overflow at the downstream AP buffer to which TCP congestion control reacts.
Figure 27(b) shows TCP throughput dynamics for the same set-up when receiver-side advertised
window control is enabled. In this benchmark, advertised windows are set to 5. Throughput
fluctuation is quiescent and jitter control is achieved without sacrificing system throughput:
0
0.2
0.4
0.6
0.8
1
1.2
1.4
100 105 110 115 120 125 130 135 140 145 150
Thr
ough
put (
Mb/
s)
Time (sec)
(a)
0
0.2
0.4
0.6
0.8
1
1.2
1.4
100 105 110 115 120 125 130 135 140 145 150
Thr
ough
put (
Mb/
s)
Time (sec)
(b)
Fig. 27. (a) Jitter with respect to throughput variation experienced by 10 iPAQ pocket PCs in indoor office environment without
receiver-side advertised window control. (b) Same configuration with receiver-side advertised window control.
1In commodity 802.11b APs the maximum sojourn time in the AP FIFO buffer is in the 500 msec–1 sec range, a delay range
that violates toll quality VoIP.

30
total throughput for TCP with receiver-side control is 5.192 Mbps whereas it is 5.189 Mbps
without. A beneficial by-product of jitter control is that short-term unfairness stemming from AP
buffer overflow—the non-persistent kind—is alleviated. We note that TCP-over-WLAN mitigates
persistent unfairness but is still subject to the effects of transient unfairness. Figure 28 shows TCP
throughput share across the 10 pocket PCs with and without receiver-side advertised window
control. Transient unfairness resulting from buffer overflow, which can be significant for small
time windows, is improved through jitter control. Whereas receiver advertised window control
0
0.1
0.2
0.3
0.4
0.5
0.6
0.7
1 2 3 4 5 6 7 8 9 10
Thr
ough
put (
Mb/
s)
Node ID
TCPawnd-controlled TCP
Fig. 28. TCP-over-WLAN transient unfairness with/without receiver-side advertised window control in indoor office
environment.
directly limits the sender’s effective window size, virtual delay control aims to control a long-
lived TCP flow’s sending rate by exploiting the property that steady-state TCP throughput is
proportional to1/RTT [31]. By delaying transmission of a TCP ACK packet for a suitable
period from the time of arrival of a TCP data packet, the RTT experienced by the sender can
be increased.
Figure 29(a) shows TCP-over-WLAN throughput and short-term fairness—captured as mini-
mum over maximum throughput—when receiver-side delayed ACK control is activated. System
throughput stays constant for virtual delay in the range 0–1000 msec, but starts to decline
thereafter due to excessive throttling of sending rate. Short-term fairness, on the other hand,
continues to improve with increased virtual delay, converging to a value near 1 at 600 msec. To
achieve high throughput and good fairness—low jitter and good short-term fairness go hand-in-
hand—virtual delay needs to be set between 600–1000 msec, a regime where AP buffer overflow
and underflow (i.e., buffer becomes empty) are both prevented. Figure 29(b) shows a second by-

31
0
1
2
3
4
5
6
0 200 400 600 800 1000 1200 1400 0
0.2
0.4
0.6
0.8
1T
hrou
ghpu
t (M
b/s)
(Min
Th)
/(M
ax T
h)
Virtual Delay (ms)
throughputmin th/max th
(a)
0
100
200
300
400
500
600
No control awnd=10 awnd=5 awnd=5, vd=50 awnd=2, vd=50
Del
ay (
ms)
(b)
Fig. 29. (a) TCP-over-WLAN throughput and short-term fairness with receiver-side virtual delay control. (b) TCP-over-WLAN
delay with receiver-side advertised window and virtual delay control.
product of jitter control: control of queuing delay at the AP buffer which can be up to 1 second
in commodity 802.11b APs. In the Enterasys RoamAbout R2 AP, the maximum sojourn time
with 1500 byte segment sizes is around 500 msec. With 10 pocket PCs running TCP, this limit
is easily reached. For VoIP and other real-time applications, queuing delay must be held below
a threshold value to meet the application’s QoS requirements. Figure 29(b) shows that by setting
the advertised window at the pocket PCs to 10 and 5, AP queuing delay can be decreased
to 200 and 100 msec, respectively. Further reduction may be obtained by increasing virtual
delay—at 50 msec virtual delay with advertised window size 5 a queuing delay of 50 msec
can be attained—or decreasing the advertised window size. The experiments in Figure 29(b)
only involve 10 pocket PCs. With more pocket PCs even an advertised window size of 1, by
itself, is insufficient to keep queuing delay at bay, which necessitates joint advertised window and
virtual delay control. The discussion on receiver-side traffic control focused on static control—the
foundation for optimal dynamic control—without considering how to design feedback controls
that achieve desired jitter, short-term fairness, and delay control. The latter is not a problem
specific to WLANs—the same issues hold in low bandwidth wireline access links [35], [29]—
and fall outside the scope of this paper.

32
V. CONCLUSION
In this paper we have studied WLAN and TCP-over-WLAN performance by incorporating
the influence of physical layer channel diversity, inter-layer protocol dependencies, and issues
surrounding their effective control. We have shown that DCF throughput degrades gracefully
under increasing offered load and number of contending stations, but fairness and jitter un-
dergo sharp transition at a critical offered load. We have shown how dynamic rate shifting can
significantly degrade WLAN throughput under moderate multiple access contention, which may
underlie part of the negative perception of 802.11 DCF throughput performance. We have shown
that TCP-over-WLAN achieves scalable throughput which is facilitated by the self-regulating
actions of DCF and TCP feedback control. As a consequence, we have shown that the TCP
data/ack collision problem does not materialize. We have also shown that TCP-over-WLAN
mitigates persistent unfairness stemming from physical layer channel diversity and neutralizes
the detrimental effect of dynamic rate shifting on WLAN throughput. The remaining control
dimension—jitter—may be effectively addressed in a legacy system compatible manner using
receiver-side traffic control, providing a complementary deployment path to IEEE 802.11e for
supporting VoIP and mixed applications. Several interesting challenges remain including study
of multi-BSS WLANs incorporating inter-layer dependence—we suspect that the ad hoc wireless
capacity results of Gupta and Kumar [16] and hybrid extensions [26], [27] are but a starting
point—improvement of dynamic rate shifting algorithms that are less susceptible to collision-
based frame errors (when TCP is running over WLAN this link layer problem is mitigated), and
optimal receiver-side advertised window and virtual delay control to calibrate performance in
wireless/wireline network environments.
ACKNOWLEDGMENT
This research was supported, in part, by NSF grants ANI-9875789, EIA-9972883 and ANI-
0082861, and KOSEF grant R01-2001-00360, R01-2004-000-10372-0 and BK-21 grant. Part of
the research was carried out while Sunwoong Choi was visiting the Network Systems Lab at
Purdue University. We would like to thank Namgi Kim for conducting corridor experiments that
benchmark WLAN throughput under fixed data rates and dynamic rate shifting. We would also

33
like to thank WildPackets for free use of their AiroPeek NX WLAN sniffing software.
REFERENCES
[1] AiroPeek NX, WildPackets, Inc. http://www.wildpackets.com/.
[2] http://www.enterasys.com/wireless/.
[3] The network simulator – ns-2. http://www.isi.edu/nsnam/ns/.
[4] IEEE 802.11 part 11: Wireless LAN medium access control (MAC) and physical layer (PHY) specifications, Aug. 1999.
[5] N. Abramson. The Aloha system—another alternative for computer communications. InProc. Fall Joint Comput. Conf.
AFIPS Conf., pages 281–285, 1970.
[6] D. Aguayo, J. Bicket, S. Biswas, G. Judd, and R. Morris. Link-level measurements from an 802.11b mesh network. In
Proc. ACM SIGCOMM ’04, 2004.
[7] A. Balachandran, G. Voelker, P. Bahl, and P. Rangan. Characterizing user behavior and network performance in a public
wireless LAN. InProc. ACM SIGMETRICS ’02, pages 195–205, 2002.
[8] H. Balakrishnan, V. Padmanabhan, S. Seshan, and R. Katz. A comparison of mechanisms for improving TCP performance
over wireless links.IEEE/ACM Trans. Networking, 5(6):756–769, 1997.
[9] G. Bianchi. Performance analysis of the IEEE 802.11 distributed coordination function.IEEE Journal on Selected Areas
in Communications, 18(3):535–547, 2000.
[10] D. Boggs, J. Mogul, and C. Kent. Measured capacity of an Ethernet: myths and reality. InProc. ACM SIGCOMM ’88,
pages 222–234, 1988.
[11] F. Cali, M. Conti, and E. Gregori. IEEE 802.11 wireless LAN: Capacity analysis and protocol enhancement. InProc.
IEEE INFOCOM ’98, pages 142–149, 1998.
[12] F. Cali, M. Conti, and E. Gregori. IEEE 802.11 protocol: Design and performance evaluation of an adaptive backoff
mechanism.IEEE Journal on Selected Areas in Communications, 18(9):1774–1786, 2000.
[13] P. Chatzimisios, A. C. Boucouvalas, and V. Vitsas. Performance analysis of IEEE 802.11 DCF in presence of transmission
errors. InProc. IEEE ICC ’2004, pages 3854–3858, 2004.
[14] I. Cuinas and M. Sanchez. Measuring, modeling, and characterizing of indoor radio channel at 5.8GHz.IEEE Transactions
on Vehicular Technology, 50(2):526–535, 2001.
[15] M. Grossglauser and D. Tse. Mobility increases the capacity of ad-hoc wireless networks. InProc. IEEE INFOCOM ’01,
pages 1360–1369, 2001.
[16] P. Gupta and P. Kumar. The capacity of wireless networks.IEEE Trans. Inf. Theory, 46(2):388–404, 2000.
[17] W. Haitao, P. Yong, L. Keping, C. Shiduan, and M. Jian. Performance of reliable transport protocol over IEEE 802.11
wireless LAN: Analysis and enhancement. InProc. IEEE INFOCOM ’02, pages 599–607, 2002.
[18] G. Holland, N. Vaidya, and P. Bahl. A rate-adaptive MAC protocol for multi-hop wireless networks. InProc. ACM
MobiCom ’01, 2001.
[19] V. Joel. Exploding the myth of WLAN performance. Telephony Online, October 2004.
[20] H. Kim and J. Hou. Improving protocol capacity with model-based frame scheduling in IEEE 802.11-operated WLANs.
In Proc. ACM MobiCom ’03, pages 190–204, 2003.

34
[21] S. Kjesbu and T. Brunsvik. Radiowave propagation in industrial environments. In26th Annual Conference of the IEEE
Industrial Electronics Society, volume 4, pages 2425–2430, 2000.
[22] L. Kleinrock and F. Tobagi. Packet switching in radio channels: Part I - carrier sense multiple-access modes and their
throughput-delay characteristics.IEEE Trans. Commun., 23(12):1400–1416, 1975.
[23] R. Knopp and P. Humblet. Information capacity and power control in single-cell multiuser communications. InProc. ICC
’95, 1995.
[24] A. Kochut, A. Vasan, A. U. Shankar, and A. Agrawala. Sniffing out the correct physical layer capture model in 802.11b.
In Proc. IEEE ICNP ’04, 2004.
[25] D. Kotz and K. Essien. Analysis of a campus-wide wireless network. InProc. ACM MobiCom ’02, pages 107–118, 2002.
[26] U. Kozat and L. Tassiulas. Throughput capacity of random ad hoc networks with infrastructure support. InProc. ACM
MobiCom ’03, pages 55–65, 2003.
[27] B. Liu, Z. Liu, and D. Towsley. On the capacity of hybrid wireless networks. InProc. IEEE INFOCOM ’03, pages
1543–1552, 2003.
[28] S. Lu, T. Nandagopal, and V. Bharghavan. A wireless fair service algorithm for packet cellular networks. InProc. ACM
MobiCom ’98, pages 10–20, 1998.
[29] P. Mehra, A. Zakhor, and C. Vleeschouwer. Receiver-driven bandwidth sharing for TCP. InProc. IEEE INFOCOM ’03,
2003.
[30] R. Metcalfe and D. Boggs. Ethernet: distributed packet switching for local computer networks.Communications of the
ACM, 19(7):395–404, 1976.
[31] J. Padhye, V. Firoiu, D. Towsley, and J. Kurose. Modeling TCP throughput: A simple model and its empirical validation.
In Proc. ACM SIGCOMM ’98, pages 303–314, 1998.
[32] K. Park and W. Willinger. Self-similar network traffic: An overview. In K. Park and W. Willinger, editors,Self-Similar
Network Traffic and Performance Evaluation. Wiley-Interscience, 2000.
[33] K. Pentikousis. TCP in wired-cum-wireless environments.IEEE Communications Surveys, Fourth Quarter(7):2–14, 2000.
[34] R. Rom and M. Sidi.Multiple Access Protocols: Performance and Analysis. Springer-Verlag New York, 1990.
[35] N. Spring, M. Chesire, M. Berryman, V. Sahasranaman, T. Anderson, and B. Bershad. Receiver based management of
low bandwidth access links. InProc. IEEE INFOCOM ’00, pages 245–254, 2000.
[36] S. Sridhar, D. Hogenboom, and B. Willemsen. Microwave experiments on chaotic billiards.J. Stat. Phys., 68(239), 1992.
[37] D. Tang and M. Baker. Analysis of a local-area wireless network. InProc. ACM MobiCom ’00, pages 1–10, 2000.
[38] R. Tingley and K. Pahlavan. Space-time measurement of indoor radio propagation.IEEE Trans. Instrum. Meas., 50(1):22–
31, 2001.
[39] D. Tse. Optimal power allocation over parallel Gaussian channels. InProc. International Symposium on Information
Theory, 1997.
[40] N. Vaidya, P. Bahl, and S. Gupta. Distributed fair scheduling in a wireless LAN. InProc. ACM MobiCom ’00, pages
167–178, 2000.
[41] A. Vasan and U. Shankar. An empirical characterization of instantaneous throughput in 802.11b WLANs. Technical Report
CS-TR-4389, UMIACS-TR-2002-69, Department of Computer Science and UMIACS, University of Maryland College Park,
2002.

35
[42] G. Xylomenos and G. Polyzos. TCP and UDP performance over a wireless LAN. InProc. IEEE INFOCOM ’99, pages
439–446, 1999.
[43] G. Xylomenos, G. Polyzos, P. Mahonen, and M. Saaranen. TCP performance issues over wireless links.IEEE
Communications Magazine, 39(4):52–58, 2001.
[44] C. Yuen and P. Marbach. Service differentiation in random access networks. Technical Report CSRG-472, Computer
System Research Group, University of Toronto, Jul. 2003.
PLACE
PHOTO
HERE
Sunwoong Choireceived his B.S. and M.S. degrees in the Department of Computer Science from Seoul
National University in 1998 and 2000, respectively. He is currently a Ph.D. candidate in the School
of Computer Science and Engineering at Seoul National University. His research interests are wireless
networks, resource management, and performance evaluation.
PLACE
PHOTO
HERE
Kihong Park is an Associate Professor in the Department of Computer Sciences at Purdue University. He
received a B.A. from Seoul National University and a Ph.D. in computer science from Boston University.
His research interests include QoS provisioning, traffic modeling, and network security. Park was a
Presidential University Fellow at Boston University, a recipient of the NSF CAREER Award, and a
Fellow-at-Large of the Santa Fe Institute.
PLACE
PHOTO
HERE
Chong-kwon Kim received the B.S. degree in industrial engineering from Seoul National University,
the M.S. degree in operations research from Georgia Institute of Technology, and the Ph.D. degree in
Computer Science from University of Illinois at Urbana-Champaign in 1981, 1982, and 1987, respectively.
In 1987, he joined Bellcore (now, Telcodia) as an MTS and worked on Broadband ISDN and ATM QoS
support. Since February 1991, he has been with Seoul National University as a Professor in the School of
Computer Science and Engineering. His research interests include wireless and mobile networking, high
speed network control, distributed processing, and performance evaluation.