1 nta country report china’s case ling li china center for economic research at peking university...
TRANSCRIPT

1
NTA country report
China’s Case
Ling Li
China Center for Economic Research at Peking UniversityBeijing, China
2007-01

2
China Center for Economic Research
Contents
Country background Economic and population growth Private transfer system Public transfer system poverty alleviation program
Progress Made on NTA Account Work progress Data Source Short description on unique methodology NTA Estimation Results Future plan

3
China Center for Economic Research
Country background
Per capita GDP and Growth Rate, China, (1978-2005)
0
2000
4000
6000
8000
10000
12000
14000
16000
1978 1980 1982 1984 1986 1988 1990 1992 1994 1996 1998 2000 2002 2004
0
2
4
6
8
10
12
14
16
18
per capita GDP(Yuan,current price) GDP growth rate(%)

4
China Center for Economic Research
Country background
Shift from “high birth rate, high mortality” to “low birth rate and low mortality ”
Demographic Characters of Chinese Population(‰)
0.00
5.00
10.00
15.00
20.00
25.00
30.00
35.00
40.00
1952 1957 1962 1965 1970 1975 1980 1985 1990 1995 2000 2004
Birth Rate
Mortality
Growth rate

5
China Center for Economic Research
Country background
Private transfer system to the elderly No developed social security system especially in rural areas The majority of elderly Chinese lives in the same household with their
offspring
Living Arragement of the elderly
0%
20%
40%
60%
80%
100%
2002rural 2002urban 2005rural 2005urban
with others
in a nursing house
alone
with spouse only
with offspring

6
China Center for Economic Research
Country background
Private transfer system to the elderly intra-household transfer is the main channel of supporting the elderly 11.3% of the elderly in the rural area aged 65 and above still make living by
themselves 26.3% of rural elderly and 18.2% of urban elderly do not get adequate financial
support to cover their living cost
Table 2 Main source of financial support of the elderly, 2002
urban rural Total
pension 37.8% 5.5% 19.9%
spouse 2.4% 1.9% 2.1%
child(ren) 43.8% 69.0% 57.8%
grandchild(ren) 3.9% 6.0% 5.0%
other relative(s) 0.4% 0.7% 0.6%
local government or community 5.8% 4.2% 4.9%
work by self 3.9% 11.3% 8.0%
others 2.1% 1.3% 1.7%

7
China Center for Economic Research
Country Background
Pensions Urban: basic old-age insurance system for the enterprises employees
Enterprise employees who have reached retirement age and who have paid their share of the premiums for 15 years or more shall be entitled to collect a basic old-age pension every month after retirement
Two parts: base pension and personal account Coverage: 155.06 million, 116.46 million of whom were employees (2003) Raising Funds:
Premium payment by both enterprises and employees Government subsidy National social security fund
Rural: old-age security in rural areas is centered mostly on families In 2004, the Chinese Government began to experiment with a system that supports
and rewards households that practice family planning by having only one child or two girls in some of the rural areas. Each person of such couple may receive a minimum of 600 Yuan a year from the age of 60 till the end of his or her life.

8
China Center for Economic Research
Country Background
Health care Delivery System
Over 90% healthcare resources are owned by public hospitals 3-tire healthcare service network
Financing Government subsidy accounted for less than 10% of hospital income Price and healthcare expenditure grew rapidly (12 times from 1990 to 2005) The poorer get the less service
20
25
30
35
40
45
1993 1998
income quintiles
inp
ati
en
t a
dm
issi
on
ra
tep
er
10
00
ru
ral
Ch
ina
poorest quintile
2nd poorestmiddle quintile2nd richest
richest quintile

9
China Center for Economic Research
Country Background
Health care Low insurance coverage Of all the healthcare expenditure, individual out-of-pocket expenditure account for as much
as 60% Basic Medical Insurance System for the Urban Employees
Rural: New Collective Medical Insurance: the reimbursement rate is low
Healthcare Insurance Coverage
Total Urban Rural
2003 1998 2003 1998 2003 1998
Basic insurance 8.9 - 30.4 - 1.5 -
Public insurance 1.2 4.9 4 16 0.2 1.2
Labor insurance 1.3 6.2 4.6 22.9 0.1 0.5
Cooperative Insurance 8.8 5.6 6.6 2.7 9.5 6.6
Other social insurance 1.4 5 2.2 10.9 1.2 3
Private Insurance 7.6 1.9 5.6 3.3 8.3 1.4
Out-of-pocket 70.3 76.4 44.8 44.1 79 87.3

10
China Center for Economic Research
Country Background
Education compulsory education (9 years) and voluntary education the government expenditure accounts for the majority of education
expenditure.
Enrollment rates of variety levels of schools
41.4
99.15 95
52.7
21
0
10
20
30
40
50
60
70
80
90
100
Kindergarten Elementaryschool
Junior highschool
Senior highschool
University
Component of education expenditure
0
100000
200000
300000
400000
500000
600000
700000
1992 1993 1994 1995 1996 1997 1998 1999 2000 2001 2002 2003
milli
on y
uan
Gov. EE Social Organizations and Private EE
Donations & Fund-raising Tuition & Miscellaneous Fee
Other

11
China Center for Economic Research
Country Background
Education Challenge
Growing regional gap and gap between the rural and urban Deficiencies in Education for Women Unmet Education Needs of Migrant Children
Education Expenditure per Pupil, 1999
0.00
200.00
400.00
600.00
800.00
1000.00
1200.00
Shanghai Beijing Yunnan Hubei Shaanxi Guizhou
U.S
. Do
llars
primary
juniorsecondary
seniorsecondary

12
China Center for Economic Research
Country Background
Unemployment Insurance All enterprises and institutions in urban areas and their employees must
participate in the unemployment insurance program employers pay 2% of their total wage bill and individuals pay 1% of their
personal wages as unemployment insurance premiums.
Guarantee of the Minimum Standard of Living for Urban Residents

13
China Center for Economic Research
Country Background
poverty alleviation programs According to China’s national poverty line, rural poverty population has
dropped from 250 million in 1978 to 28.2 million in 2002, decreasing by 88.7%
why China can decrease poverty population by a large margin high economic growth rural labor force transfers to non-agricultural industries Human capital has been obviously improved. Anti-poverty actions adopted by the government
Government Policies for the Aid-the-Poor Program Defining the Key Poverty-stricken Counties to Be Aided by the State Putting the Stress on the Poverty-stricken Areas in the Central and
Western Regions Financial support Aiding the Poor with Technology and Education Cooperation of the Eastern and Western Regions in the Aid-the- Poor
Work (对口支援) Encouraging Migration

14
China Center for Economic Research
Progress Made on NTA Account
Work progress New private data source: Chinese Household Income Project (CHIP)
data , 1995 The sample size of CHIP95 (over 50,000 individuals) is much bigger than
our previous data (no more than 5000 individuals) We are in the progress of negotiating with the Academy of Chinese Social
Science to get the CHIP2002
Public data source Statistical yearbook Population census data Some specific yearbooks

15
China Center for Economic Research
Progress Made on NTA Account
Short description on unique methodology Separately estimation between urban and rural area
most of the micro data in China is collected and reported separately big gap between the rural and urban China For the private accounts, people may have different behaviors For the public accounts, most government expenditures (public resources)
are allocated in the urban areas

16
China Center for Economic Research
NTA Estimation Results
Private consumption
Private consumption, urban, 1995
private consumption,per capita,urban
0
1000
2000
3000
4000
5000
0 7 14 21 28 35 42 49 56 63 70 77 84
Education Health Other
Private consumption, per capita, rural, 1995
private consumption,per capita, rural
0
500
1000
1500
2000
2500
0 8
16 24 32 40 48 56 64 72 80 88
Education Health Other

17
China Center for Economic Research
NTA Estimation Results
Private consumption : discussion Healthcare expenditure
regression method may lead to bias Big gap between the urban and rural The elderly (over 50 years old) consumes less than other countries
Age-health profile by different methods, urban
Age-health profile by different methods
-100
0
100
200
300
400
0 5 10 15 20 25 30 35 40 45 50 55 60 65 70 75 80 85 90
Indivudual data Regression
Private Healthcare expenditure,per capita
0
50
100
150
200
250
300
350
400
1 5 9 13 17 21 25 29 33 37 41 45 49 53 57 61 65 69 73 77 81 85 89
urban self report rural National
Private Healthcare Expenditure, per capita, 1995

18
China Center for Economic Research
NTA Estimation Results
Private consumption : discussion Healthcare expenditure
Why the elderly consumes less? the household choose to allocate more resource to the mid-ages rather than the
elderly when they get sick The elasticity of the healthcare expenditure for the mid-ages (25-50) to the
household income is 0.35, while the old-ages (50 and above) is 0.25
Two-week healthcare expenditure of different age groups, 1997
Two-week healthcare expenditure by age,1997
0
2040
6080
100
120140
160
0-4 .5-14 15-24 25-34 35-44 45-54 55-64 65-+
Age
Yua
n
Total Urban Rural
Source: 2nd National Healthcare Service Survey
19
China Center for Economic Research
NTA Estimation Results
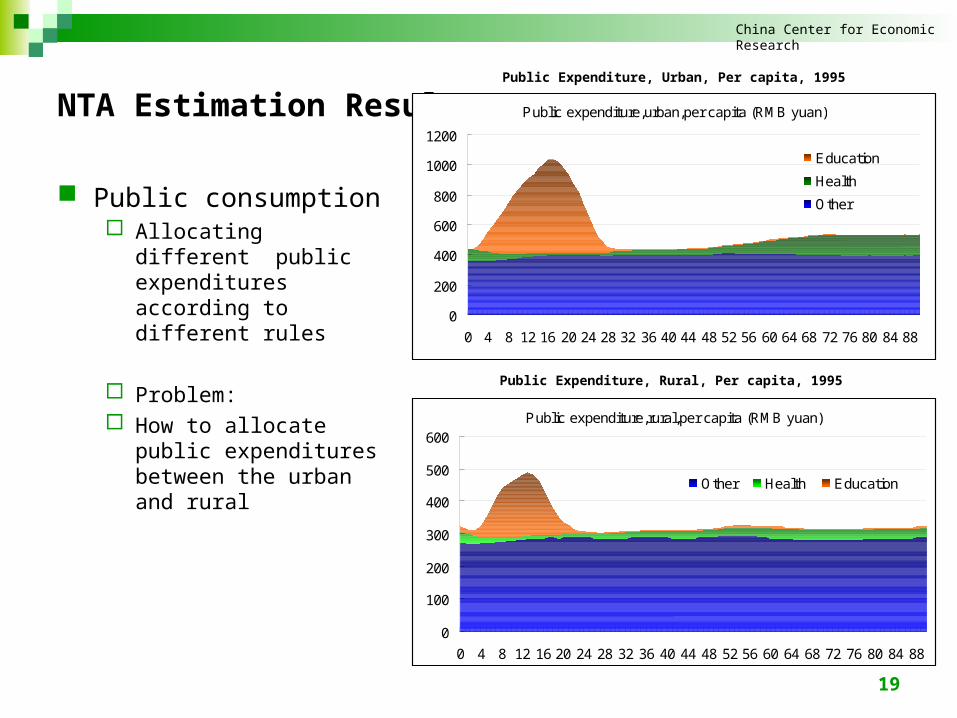
Public consumption Allocating different public
expenditures according to different rules
Problem: How to allocate public
expenditures between the urban and rural
Public Expenditure, Urban, Per capita, 1995
Public expenditure,urban,per capita (RMB yuan)
0
200
400
600
800
1000
1200
0 4 8 12 16 20 24 28 32 36 40 44 48 52 56 60 64 68 72 76 80 84 88
Education
Health
Other
Public Expenditure, Rural, Per capita, 1995
Public expenditure,rural,per capita (RMB yuan)
0
100
200
300
400
500
600
0 4 8 12 16 20 24 28 32 36 40 44 48 52 56 60 64 68 72 76 80 84 88
Other Health Education

20
China Center for Economic Research
NTA Estimation Results
Labor income the gap of labor income
contributes much to the income diversity between urban and rural.
The age-labor income curve of the rural is much “fatter” than the urban
Labor incomes, urban, per capita, 1995
labor income, urban, per capita
0
1000
2000
3000
4000
5000
6000
7000
8000
0 4 8 12 16 20 24 28 32 36 40 44 48 52 56 60 64 68 72 76 80 84 88
Labor income, rural, per capita, 1995
Labor income,rural,per capita
0
500
1000
1500
2000
2500
3000
3500
4000
0 4 8 12 16 20 24 28 32 36 40 44 48 52 56 60 64 68 72 76 80 84 88
Wage income
self-employed income
Total labor income
21
China Center for Economic Research
NTA Estimation Results
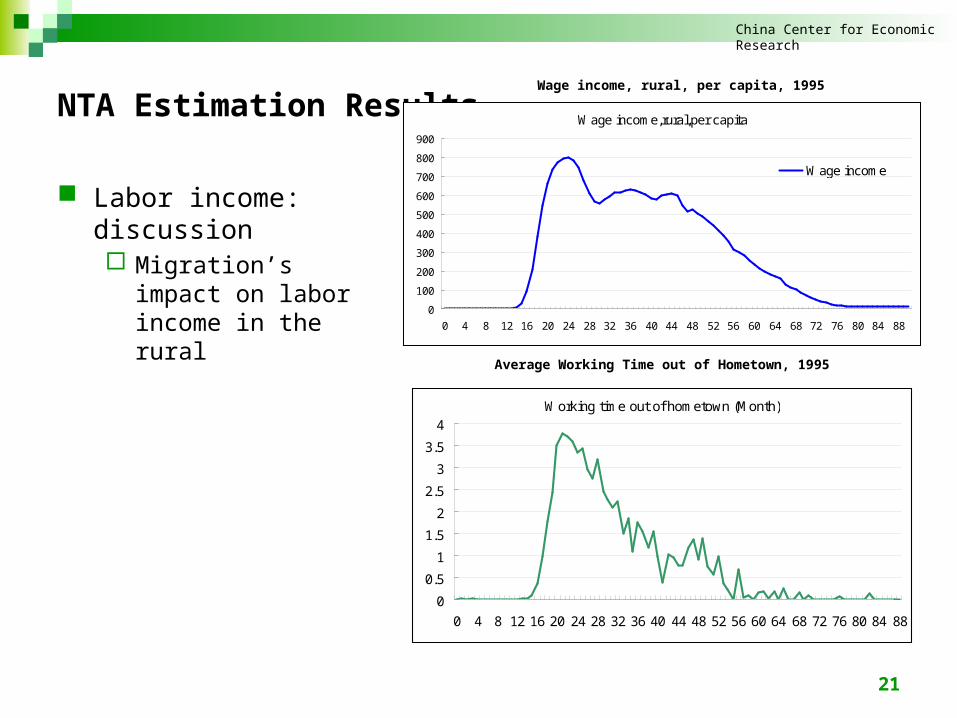
Labor income: discussion Migration’s impact on
labor income in the rural
Wage income,rural,per capita
0
100
200
300
400
500
600
700
800
900
0 4 8 12 16 20 24 28 32 36 40 44 48 52 56 60 64 68 72 76 80 84 88
Wage income
Working time out of hometown (Month)
0
0.5
1
1.5
2
2.5
3
3.5
4
0 4 8 12 16 20 24 28 32 36 40 44 48 52 56 60 64 68 72 76 80 84 88
Average Working Time out of Hometown, 1995
Wage income, rural, per capita, 1995

22
China Center for Economic Research
NTA Estimation Results
Labor income: discussion Ronald Lee (2004)
Brazil type France type Japan type
the China age-labor income profile in the urban follows the mixture of type I and type II, while the rural one follows type II
whether they have the same mechanism is an interesting topic to be discussed.
Share of aggregate earnings for youth (20 and under) and elderly (65 and over)
0 2 4 6 8 10
Brazil(1996)
France(1995)
Indonesia(1996)
Taiwan(1998)
Thailand(1990)
US(2001)
Australia(2000)
Japan(1999)
China,urban(1995)
China,rural(1995)
China,national(1995)age 65+
age 20-
Share of aggregate earrings from youth (20- ) and elderly (65+), 1995

23
China Center for Economic Research
NTA Estimation Results
Life-cycle Deficit Note
Underestimation of the labor income
Incomplete aggregate data
Labor income includes only earning
2/3 agriculture income is considered as labor income, I think that the ratio is lower, as the agriculture production is labor-intensive.
Over-estimation of public consumption
Public investment is includes
LCD,per capita,rural
0
500
1000
1500
2000
2500
3000
3500
4000
0 4 8 12 16 20 24 28 32 36 40 44 48 52 56 60 64 68 72 76 80 84 88
Consumption
Labor income
LCD, per capita, rural, 1995
LCD, per capita, urban, 1995
LCD,urban,per capita
0
1000
2000
3000
4000
5000
6000
7000
8000
0 4 8 12 16 20 24 28 32 36 40 44 48 52 56 60 64 68 72 76 80 84 88
consumption
Labor income

24
China Center for Economic Research
Future plan
Complete the estimation using CHIP95 data and make full estimation with CHIP2002 data after we get it
Construct methodology to separate government expenditure to the urban and rural
Estimate and discuss the difference and transfers across the urban and rural Investigate the reason why Chinese elderly consumes relatively less
healthcare expenditure. The National Aging Population Survey data is full of health indexes, which may help us a lot.
Discuss the role of migration in terms of the NTA Account.
25
China Center for Economic Research
Thanks