1 municipal infrastructure grant (mig) expenditure as at end april 2013 04 june 2013 10/17/2015
TRANSCRIPT
1
Municipal Infrastructure Grant (MIG) Expenditure
as at end April 2013
04 June 2013
04/20/23

Outline of the Presentation
National Overview of MIG Expenditure as at 30 April 2013
Challenges• Annexure MIG expenditure per municipality per
province – end of April 2013
204/20/23
National Overview of MIG Expenditure as at 30 April 2013
ProvinceAllocated
(R'000)
Transferred to date(R'000)
Transfers as % allocation
Expenditure to date
(R'000)
Expenditure as %
allocation
Expenditure as % transferred
Balance Unspent(R'000)
Eastern Cape
2,918,290
2,918,290 100.00%
1,889,978 64.76% 64.76%
1,028,312
Free State
1,020,313
1,020,313 100.00% 705,027 69.10% 69.10%
315,286
Gauteng
484,655
484,655 100.00% 261,305 53.92% 53.92%
223,350
KwaZulu Natal
3,152,666
3,152,666 100.00%
1,850,531 58.70% 58.70%
1,302,135
Limpopo
2,462,883
2,460,412 99.90%
1,188,112 48.24% 48.29%
1,272,300
Mpumalanga
1,427,874
1,427,874 100.00% 584,212 40.91% 40.91%
843,661
Northern Cape
515,429
515,429 100.00% 271,726 52.72% 52.72%
243,703
North West
1,444,203
1,444,203 100.00% 672,299 46.55% 46.55%
771,904
Western Cape
455,320
455,320 100.00% 300,269 65.95% 65.95%
155,051
TOTAL
13,881,633
13,879,161 99.98%
7,723,459 55.64% 55.65%
6,155,702
04/20/23 3

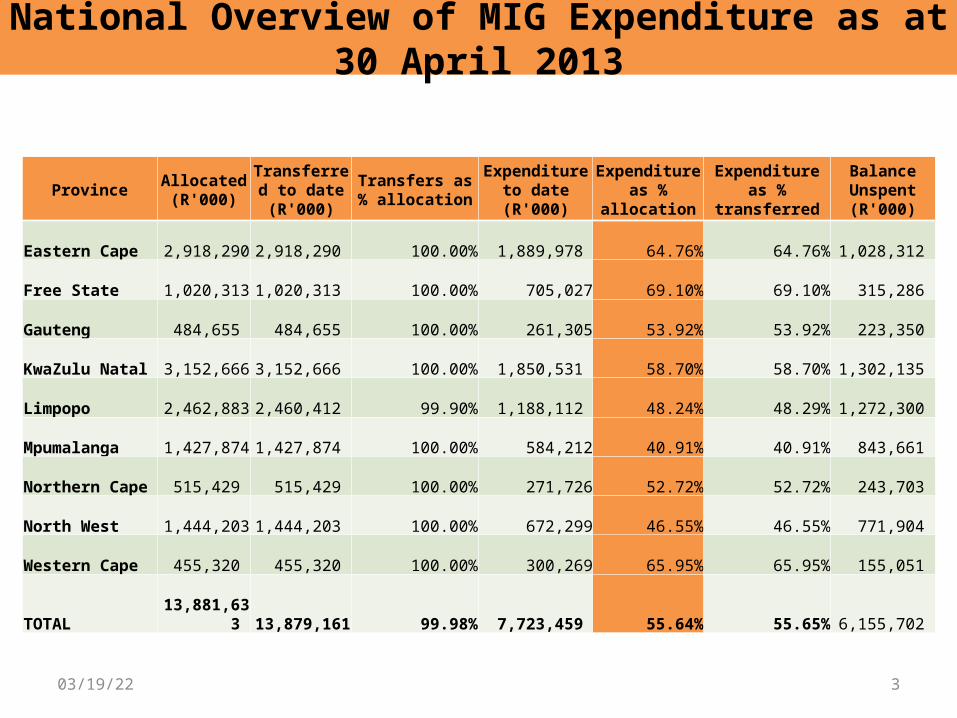
• As at 30 April 2013, R13,8 billion or 99.98 percent of the total MIG allocation was transferred to 247 municipalities (21 districts and 226 local) in the 9 provinces (transfers were made during July 2012, November 2012 and March 2013).
– Only 99.98% of the 2012/13 MIG funds were transferred to Limpopo municipalities as some funds (R2,471,000) were not transferred to Bela Bela Local Municipality.
• Municipalities spent 53 percent of the funds transferred between July 2012 and April 2013 representing 53 percent expenditure on the total MIG allocation of R13,8 billion.– The Eastern Cape is the best overall spender having spent 64.9 percent of their
total MIG allocation followed by the Free State which spent 61 percent of their total MIG allocation.
– KwaZulu-Natal, Limpopo and Northern Cape had by the end of April 2013, spent less than 50 percent of their overall allocations.
– Some of the municipalities spending on the MIG funds are also spending on the 2011/12 approved funds, for example, 3 of the municipalities in the Free State that spent less than 50 percent of the 2012/13 allocations at the end of March 2013 were also spending on the 2011/12 approved rollovers.
04/20/23
National Overview of MIG Expenditure as at 30 April 2013
4

504/20/23
• Summary Report :- – Insert explanations for variance from payment
schedules, transfers and expenditure and other matters
– Remedial measures (if any) e.g.:– One on One will be on the 1st week of March 2013 (reflected in
April Report), – No report received– Expenditure zero (no reasons for variance, no remedial measures)
Challenges – Monthly DoRA Report

ANNEXURE
MIG EXPENDITURE PER MUNICIPALITY PER PROVINCE– END OF APRIL 2013
04/20/23 6

MIG Expenditure Per Municipality Per Province (EASTERN CAPE) – April 2013
Municipality Allocated (R'000)
Transferred to date(R’000)
Expenditure to date
(R’000)
Expenditure as % allocation
Expenditure as % transferred
Balance Unspent(R’000)
Camdeboo
15,735 15,735 15,731 99.97% 99.97%
4
Blue Crane Route
20,345 20,345 9,423 46.32% 46.32%
10,922
Ikwezi
10,244 10,244 4,013 39.17% 39.17%
6,231
Makana
29,490 29,490 14,190 48.12% 48.12%
15,300
Ndlambe
27,230 27,230 19,092 70.11% 70.11%
8,138
Sundays River Valley
23,659 23,659 16,137 68.21% 68.21%
7,522
Baviaans
12,672 12,672 6,598 52.07% 52.07%
6,074
Kouga
27,902 27,902 15,708 56.30% 56.30%
12,194
Kou-kamma
17,763 17,763 10,509 59.16% 59.16%
7,254
704/20/23

MIG Expenditure Per Municipality Per Province (EASTERN CAPE) – April 2013
MunicipalityAllocated
(R'000)
Transferred to date(R’000)
Expenditure to date
(R’000)
Expenditure as % allocation
Expenditure as %
transferred
Balance Unspent(R’000)
Mbhashe 39,800
39,800 19,680 49.45% 49.45% 20,120
Mnquma 53,815
53,815 43,965 81.70% 81.70% 9,850
Great Kei 14,426
14,426 8,404 58.26% 58.26% 6,022
Amahlathi 27,759
27,759 20,374 73.40% 73.40% 7,385
Ngqushwa 20,934
20,934 4,066 19.42% 19.42% 16,868
Nkonkobe 26,315
26,315 18,013 68.45% 68.45% 8,302
Nxuba 11,729
11,729 5,119 43.64% 43.64% 6,610
Amatole District Municipality
389,786
389,786 179,526 46.06% 46.06% 210,260
804/20/23

MIG Expenditure Per Municipality Per Province (EASTERN CAPE) – April 2013
MunicipalityAllocated
(R'000)
Transferred to date(R’000)
Expenditure to date(R’000)
Expenditure as %
allocation
Expenditure as %
transferred
Balance Unspent(R’000)
Inxuba Yethemba 13,228
13,228
5,306 40.11% 40.11%
7,922
Tsolwana 11,683
11,683
4,749 40.65% 40.65%
6,934
Inkwanca 9,991
9,991
5,846 58.51% 58.51%
4,145
Lukhanji 32,122
32,122
8,982 27.96% 27.96%
23,140
Intsika Yethu 31,461
31,461
25,846 82.15% 82.15%
5,615
Emalahleni 23,311
23,311
8,901 38.18% 38.18%
14,410
Engcobo 26,227
26,227
17,559 66.95% 66.95%
8,668
Sakhisizwe 16,292
16,292
15,373 94.36% 94.36%
919
Chris Hani District Municipality 345,243
345,243
345,243 100.00% 100.00%
-
904/20/23

MIG Expenditure Per Municipality Per Province (EASTERN CAPE) – April 2013
MunicipalityAllocated
(R'000)
Transferred to date(R’000)
Expenditure to date
(R’000)
Expenditure as %
allocation
Expenditure as %
transferred
Balance Unspent(R’000)
Elundini
27,253 27,253 17,256 63.32% 63.32%
9,997
Senqu
28,025 28,025 13,604 48.54% 48.54%
14,421
Maletswai
15,300 15,300 6,452 42.17% 42.17%
8,848
Gariep
12,044 12,044 2,675 22.21% 22.21%
9,369
Joe Gqabi District Municipality
174,629
174,629 126,463 72.42% 72.42%
48,166
Ngquza Hill
38,263 38,263 15,543 40.62% 40.62%
22,720
Port St Johns
24,569 24,569 13,900 56.58% 56.58%
10,669
Nyandeni
39,753 39,753 25,274 63.58% 63.58%
14,479
Mhlontlo
34,376 34,376 20,135 58.57% 58.57%
14,241
King Sabata Dalindyebo
56,139 56,139 22,903 40.80% 40.80%
33,236
O.R. Tambo District Municipality
682,682
682,682 356,310 52.19% 52.19%
326,372
1004/20/23
MIG Expenditure Per Municipality Per Province (EASTERN CAPE) – April 2013
MunicipalityAllocated
(R'000)
Transferred to date
(R’000)
Expenditure to date
(R’000)
Expenditure as % allocation
Expenditure as % transferred
Balance Unspent(R’000)
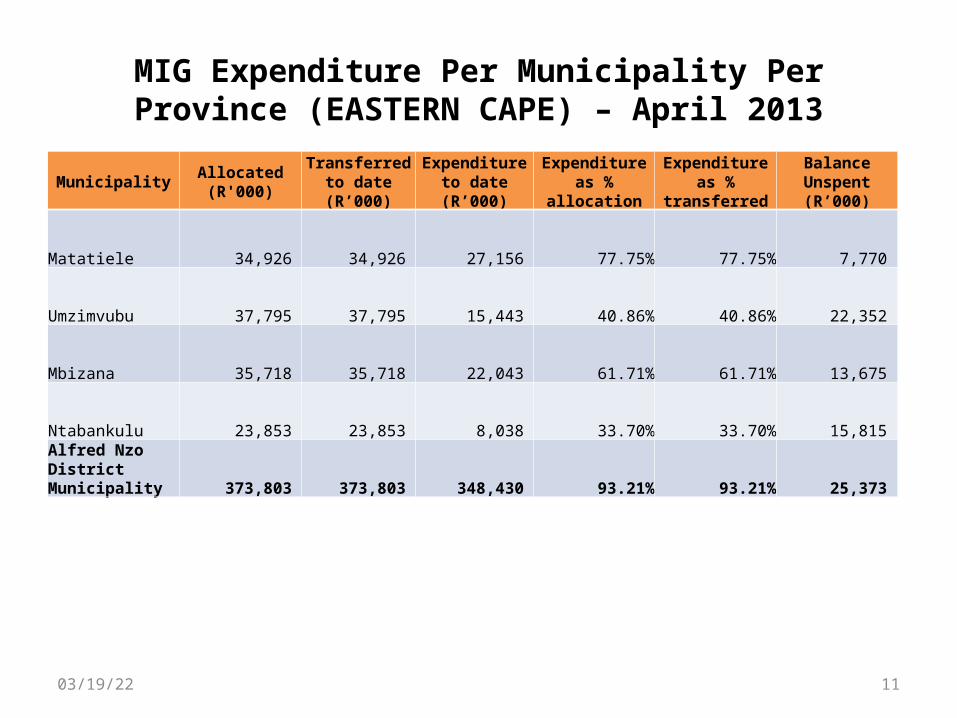
Matatiele
34,926 34,926
27,156 77.75% 77.75% 7,770
Umzimvubu
37,795 37,795
15,443 40.86% 40.86% 22,352
Mbizana
35,718 35,718
22,043 61.71% 61.71% 13,675
Ntabankulu
23,853 23,853
8,038 33.70% 33.70% 15,815 Alfred Nzo District Municipality
373,803 373,803
348,430 93.21% 93.21% 25,373
1104/20/23

MIG Expenditure Per Municipality Per Province (FREE STATE) – April 2013
Municipality Allocated (R'000)
Transferred to date
(R’000)
Expenditure to date
(R’000)
Expenditure as % allocation
Expenditure as % transferred
Balance Unspent(R’000)
Letsemeng
22,090 22,090 13,674 61.90% 61.90%
8,416
Kopanong
23,521 23,521 19,652 83.55% 83.55%
3,869
Mohokare
18,840 18,840 13,596 72.17% 72.17%
5,244
Naledi
17,163 17,163 9,249 53.89% 53.89%
7,914
Masilonyana
36,782 36,782 22,407 60.92% 60.92%
14,375
Tokologo
21,658 21,658 17,238 79.59% 79.59%
4,420
Tswelopele
30,344 30,344 26,579 87.59% 87.59%
3,765
Matjhabeng
200,030 200,030 139,477 69.73% 69.73%
60,553
Nala
55,367 55,367 39,934 72.13% 72.13%
15,433
1204/20/23
MIG Expenditure Per Municipality Per Province (FREE STATE) - April 2013
MunicipalityAllocated
(R'000)
Transferred to date
(R’000)
Expenditure to date
(R’000)
Expenditure as % allocation
Expenditure as % transferred
Balance Unspent(R’000)
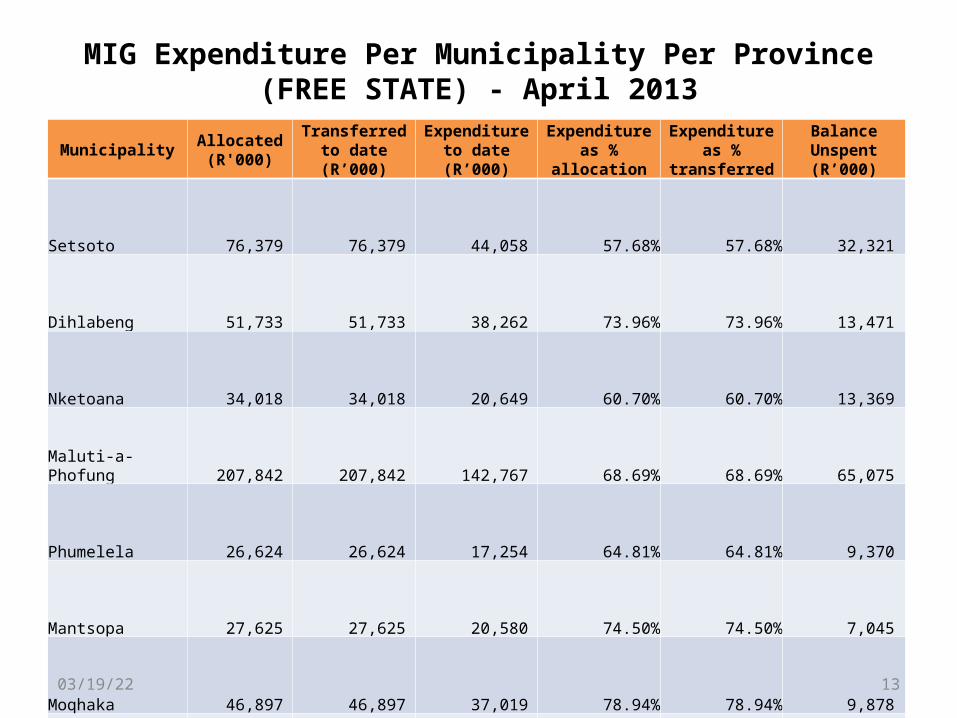
Setsoto
76,379 76,379 44,058 57.68% 57.68% 32,321
Dihlabeng
51,733 51,733 38,262 73.96% 73.96% 13,471
Nketoana
34,018 34,018 20,649 60.70% 60.70% 13,369
Maluti-a-Phofung
207,842 207,842 142,767 68.69% 68.69% 65,075
Phumelela
26,624 26,624 17,254 64.81% 64.81% 9,370
Mantsopa
27,625 27,625 20,580 74.50% 74.50% 7,045
Moqhaka
46,897 46,897 37,019 78.94% 78.94% 9,878
Ngwathe
50,441 50,441 22,457 44.52% 44.52% 27,984
Metsimaholo
47,118 47,118 43,525 92.37% 92.37% 3,593
Mafube
25,841 25,841 16,650 64.43% 64.43% 9,191
1304/20/23
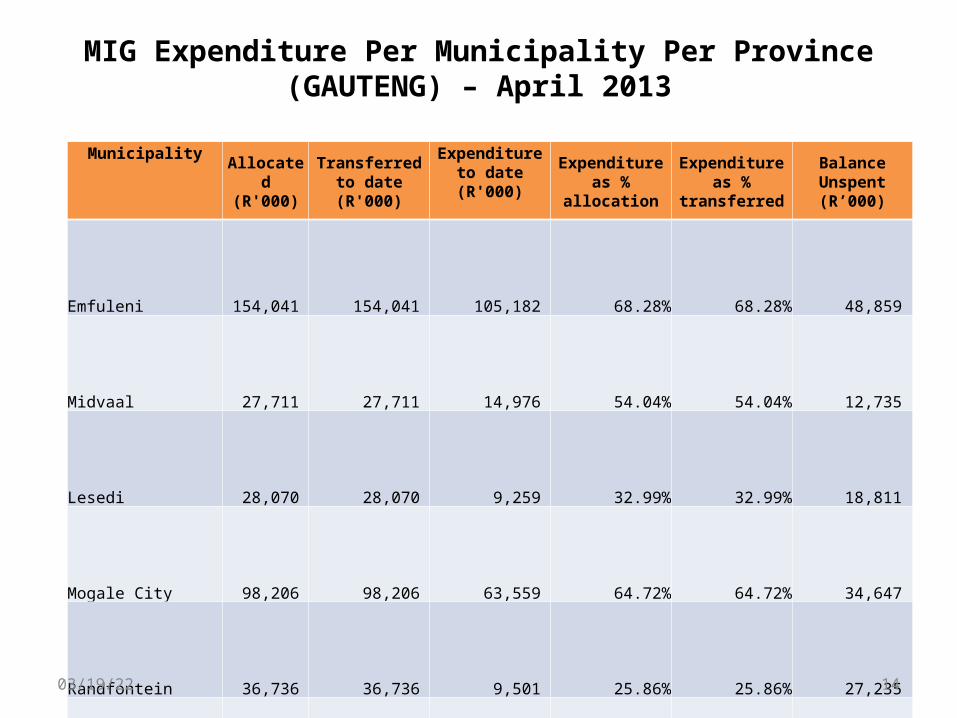
MIG Expenditure Per Municipality Per Province (GAUTENG) – April 2013
MunicipalityAllocated
(R'000)
Transferred to date
(R'000)
Expenditure to date (R'000)
Expenditure as % allocation
Expenditure as % transferred
Balance Unspent (R’000)
Emfuleni
154,041 154,041 105,182 68.28% 68.28% 48,859
Midvaal
27,711 27,711 14,976 54.04% 54.04% 12,735
Lesedi
28,070 28,070 9,259 32.99% 32.99% 18,811
Mogale City
98,206 98,206 63,559 64.72% 64.72% 34,647
Randfontein
36,736 36,736 9,501 25.86% 25.86% 27,235
Westonaria
65,728 65,728 19,383 29.49% 29.49% 46,345
Merafong City
74,163 74,163 39,445 53.19% 53.19% 34,718
1404/20/23

Municipal Infrastructure Grant Expenditure Per Municipality Per Province (KWAZULU NATAL) – April 2013
Municipality Allocated (R'000)
Transferred to date(R’000)
Expenditure to date
(R’000)
Expenditure as % allocation
Expenditure as %
transferred
Balance Unspent(R’000)
Vulamehlo
16,408 16,408 5,972 36.40% 36.40%
10,436
uMdoni
15,803 15,803 8,855 56.03% 56.03%
6,948
Umzumbe
29,908 29,908 13,366 44.69% 44.69%
16,542
uMuziwabantu
18,351 18,351 8,072 43.99% 43.99%
10,279
Ezinqolweni
13,496 13,496 8,689 64.38% 64.38%
4,807
Hibiscus Coast
30,787 30,787 8,849 28.74% 28.74%
21,938
Ugu District Municipality
289,979 289,979 196,836 67.88% 67.88%
93,143
uMshwathi
18,404 18,404 10,012 54.40% 54.40%
8,392
uMngeni
16,190 16,190 6,258 38.65% 38.65%
9,932
Mpofana
11,728 11,728 5,753 49.05% 49.05%
5,975
Impendle
10,761 10,761 3,857 35.84% 35.84%
6,904
Msunduzi
153,399 153,399 82,590 53.84% 53.84%
70,809
Mkhambathini
12,442 12,442 5,801 46.62% 46.62%
6,641
Richmond
16,376 16,376 8,923 54.49% 54.49%
7,453 uMgungundlovu District Municipality
104,142 104,142 82,736 79.45% 79.45%
21,406 1504/20/23
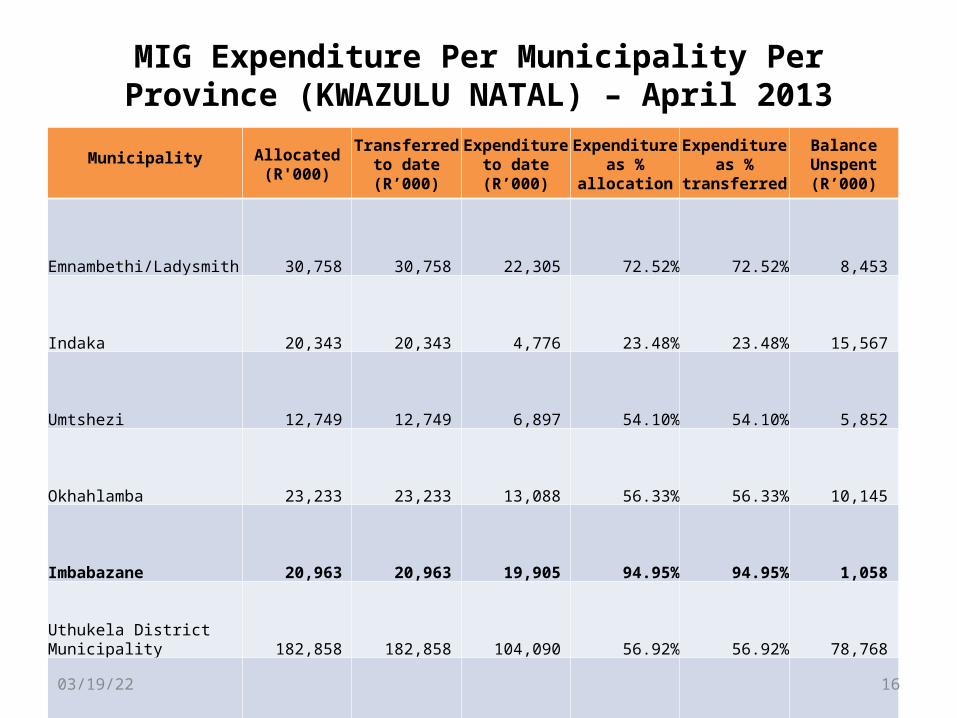
MIG Expenditure Per Municipality Per Province (KWAZULU NATAL) – April 2013
Municipality Allocated (R'000)
Transferred to date(R’000)
Expenditure to date(R’000)
Expenditure as %
allocation
Expenditure as %
transferred
Balance Unspent(R’000)
Emnambethi/Ladysmith
30,758 30,758 22,305 72.52% 72.52% 8,453
Indaka
20,343 20,343 4,776 23.48% 23.48% 15,567
Umtshezi
12,749 12,749 6,897 54.10% 54.10% 5,852
Okhahlamba
23,233 23,233 13,088 56.33% 56.33% 10,145
Imbabazane
20,963 20,963 19,905 94.95% 94.95% 1,058 Uthukela District Municipality
182,858 182,858 104,090 56.92% 56.92% 78,768
Endumeni
12,434 12,434 2,720 21.88% 21.88% 9,714
Nquthu
25,498 25,498 15,224 59.71% 59.71% 10,274
Msinga
26,665 26,665 22,210 83.29% 83.29% 4,455
Umvoti
17,870 17,870 7,728 43.25% 43.25% 10,142 Umzinyathi District Municipality
196,447 196,447 146,638 74.65% 74.65% 49,809
1604/20/23

Municipal Infrastructure Grant Expenditure Per Municipality Per Province (KWAZULU NATAL) – April 2013
MunicipalityAllocated
(R'000)
Transferred to date
(R’000)
Expenditure to date
(R’000)
Expenditure as % allocation
Expenditure as % transferred
Balance Unspent(R’000)
Newcastle
90,038 90,038 55,080 61.17% 61.17% 34,958
EMadlangeni
10,461 10,461 2,673 25.55% 25.55% 7,788
Dannhauser
18,604 18,604 12,588 67.66% 67.66% 6,016 Amajuba District Municipality
49,992 49,992 12,166 24.34% 24.34% 37,826
eDumbe
15,462 15,462 5,013 32.42% 32.42% 10,449
uPhongolo
20,371 20,371 10,710 52.57% 52.57% 9,661
Abaqulusi
25,444 25,444 9,695 38.10% 38.10% 15,749
Nongoma
25,314 25,314 14,101 55.70% 55.70% 11,213
Ulundi
26,700 26,700 24,202 90.64% 90.64% 2,498 Zululand District Municipality
275,487 275,487 221,850 80.53% 80.53% 53,637
1704/20/23
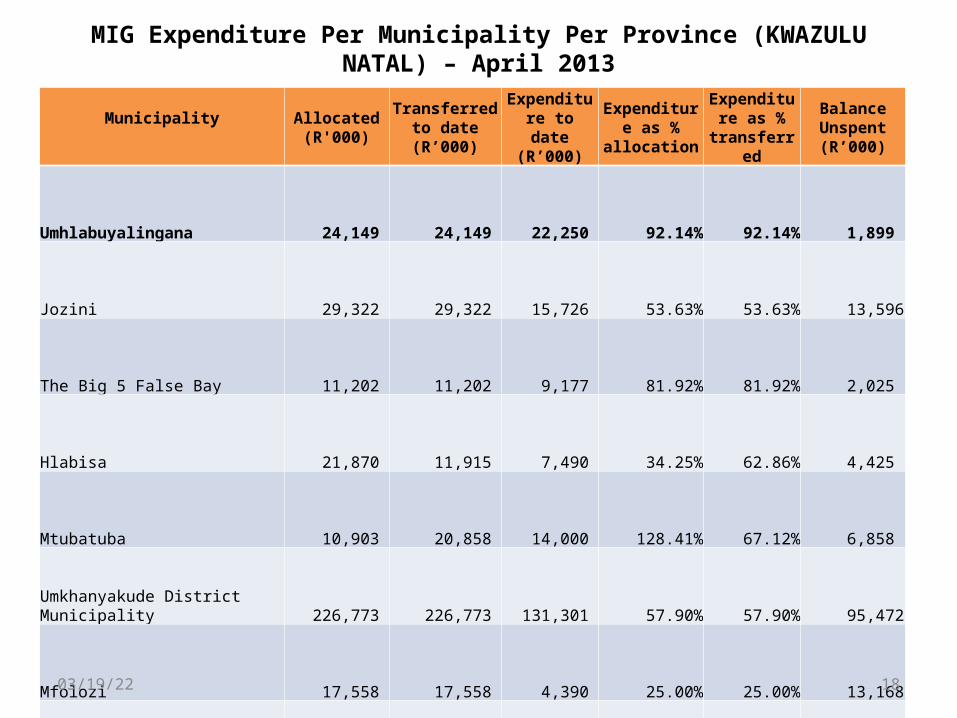
MIG Expenditure Per Municipality Per Province (KWAZULU NATAL) – April 2013
Municipality Allocated (R'000)
Transferred to date
(R’000)
Expenditure to date(R’000)
Expenditure as %
allocation
Expenditure as %
transferred
Balance Unspent(R’000)
Umhlabuyalingana
24,149 24,149 22,250 92.14% 92.14%
1,899
Jozini
29,322 29,322 15,726 53.63% 53.63%
13,596
The Big 5 False Bay
11,202 11,202
9,177 81.92% 81.92%
2,025
Hlabisa
21,870 11,915
7,490 34.25% 62.86%
4,425
Mtubatuba
10,903 20,858 14,000 128.41% 67.12%
6,858
Umkhanyakude District Municipality
226,773 226,773
131,301 57.90% 57.90%
95,472
Mfolozi
17,558 17,558
4,390 25.00% 25.00%
13,168
uMhlathuze
86,617 86,617 28,386 32.77% 32.77%
58,231
Ntambanana
12,364 12,364
8,935 72.27% 72.27%
3,429
uMlalazi
27,031 27,031 12,415 45.93% 45.93%
14,616
Mthonjaneni
13,053 13,053
3,598 27.56% 27.56%
9,455
Nkandla
21,698 21,698 11,437 52.71% 52.71%
10,261
uThungulu District Municipality
195,223 195,223 87,614 44.88% 44.88%
107,609
1804/20/23

Municipal Infrastructure Grant Expenditure Per Municipality Per Province (KWAZULU NATAL) – April 2013
MunicipalityAllocated
(R'000)
Transferred to date
(R’000)
Expenditure to date
(R’000)
Expenditure as % allocation
Expenditure as % transferred
Balance Unspent(R’000)
Mandeni
25,659 25,659 20,321 79.20% 79.20% 5,338
KwaDukuza
35,149 35,149 6,391 18.18% 18.18% 28,758
Ndwedwe
24,496 24,496 9,629 39.31% 39.31% 14,867
Maphumulo
20,477 20,477 7,638 37.30% 37.30% 12,839 iLembe District Municipality
179,292 179,292 97,094 54.15% 54.15% 82,198
Ingwe
20,099 20,099 6,665 33.16% 33.16% 13,434
Kwa Sani
9,567 9,567 1,553 16.23% 16.23% 8,014
Greater Kokstad
19,320 19,320 14,555 75.34% 75.34% 4,765
Ubuhlebezwe
21,118 21,118 7,764 36.76% 36.76% 13,354
Umzimkhulu
48,144 48,144 33,035 68.62% 68.62% 15,109 Sisonke District Municipality
165,717 165,717 98,939 59.70% 59.70% 66,778
1904/20/23

Municipal Infrastructure Grant Expenditure Per Municipality Per Province (LIMPOPO) - April 2013
MunicipalityAllocated
(R'000)
Transferred to date
(R’000)
Expenditure to date(R’000)
Expenditure as % allocation
Expenditure as % transferred
Balance Unspent(R’000)
Greater Giyani
36,331 36,331 2,034 5.60% 5.60% 34,297
Greater Letaba
40,027 40,027 27,993 69.94% 69.94% 12,034
Greater Tzaneen
56,665 56,665 25,955 45.80% 45.80% 30,710
Ba-Phalaborwa
20,778 20,778 18,506 89.07% 89.07% 2,272
Maruleng
30,174 30,174 24,746 82.01% 82.01% 5,428 Mopani District Municipality
319,302 319,302 45,055 14.11% 14.11% 274,247
Musina
14,604 14,604 6,289 43.06% 43.06% 8,315
Mutale
16,977 16,977 11,943 70.35% 70.35% 5,034
Thulamela
74,355 74,355 62,771 84.42% 84.42% 11,584
Makhado
67,400 67,400 34,726 51.52% 51.52% 32,674 Vhembe District Municipality
359,404 359,404 316,212 87.98% 87.98% 43,192
2004/20/23
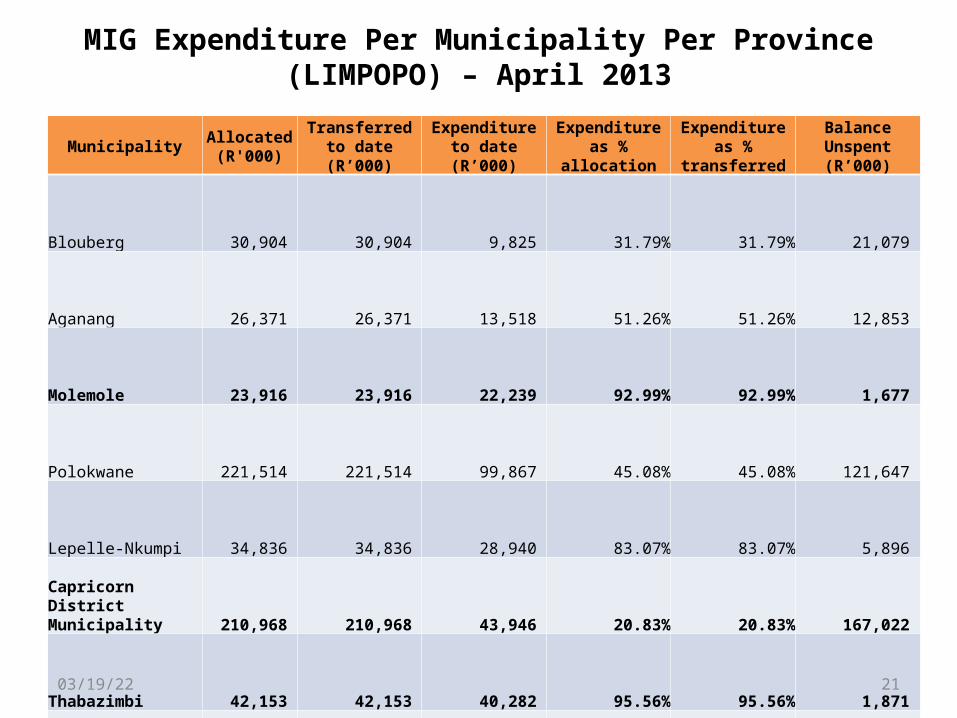
MIG Expenditure Per Municipality Per Province (LIMPOPO) – April 2013
MunicipalityAllocated
(R'000)
Transferred to date
(R’000)
Expenditure to date
(R’000)
Expenditure as % allocation
Expenditure as % transferred
Balance Unspent(R’000)
Blouberg 30,904 30,904 9,825 31.79% 31.79% 21,079
Aganang 26,371 26,371 13,518 51.26% 51.26% 12,853
Molemole 23,916 23,916 22,239 92.99% 92.99% 1,677
Polokwane 221,514 221,514 99,867 45.08% 45.08% 121,647
Lepelle-Nkumpi 34,836 34,836 28,940 83.07% 83.07% 5,896
Capricorn District Municipality
210,968 210,968 43,946 20.83% 20.83% 167,022
Thabazimbi 42,153 42,153 40,282 95.56% 95.56% 1,871
Lephalale 43,557 43,557 13,178 30.25% 30.25% 30,379
Mookgopong 16,420 16,420 11,391 69.37% 69.37% 5,029
Modimolle 41,434 41,434 8,646 20.87% 20.87% 32,788
Bela Bela 18,824 16,353 16,057 85.30% 98.19% 296
Mogalakwena 137,346 137,346 34,361 25.02% 25.02% 102,985
2104/20/23

MIG Expenditure Per Municipality Per Province (LIMPOPO) – April 2013
MunicipalityAllocated
(R'000)
Transferred to date(R’000)
Expenditure to date(R’000)
Expenditure as %
allocation
Expenditure as %
transferred
Balance Unspent(R’000)
Ephraim Mogale
21,678 21,678 8,673 40.01% 40.01%
13,005
Elias Motsoaledi
35,223 35,223 35,253 100.09% 100.09%
- 30
Makhuduthamaga
41,436 41,436 4,920 11.87% 11.87%
36,516
Fetakgomo
18,690 18,690 10,835 57.97% 57.97%
7,855
Greater Tubatse
44,048 44,048 24,801 56.30% 56.30%
19,247
Sekhukhune District Municipality
417,548
417,548 185,150 44.34% 44.34%
232,398
2204/20/23
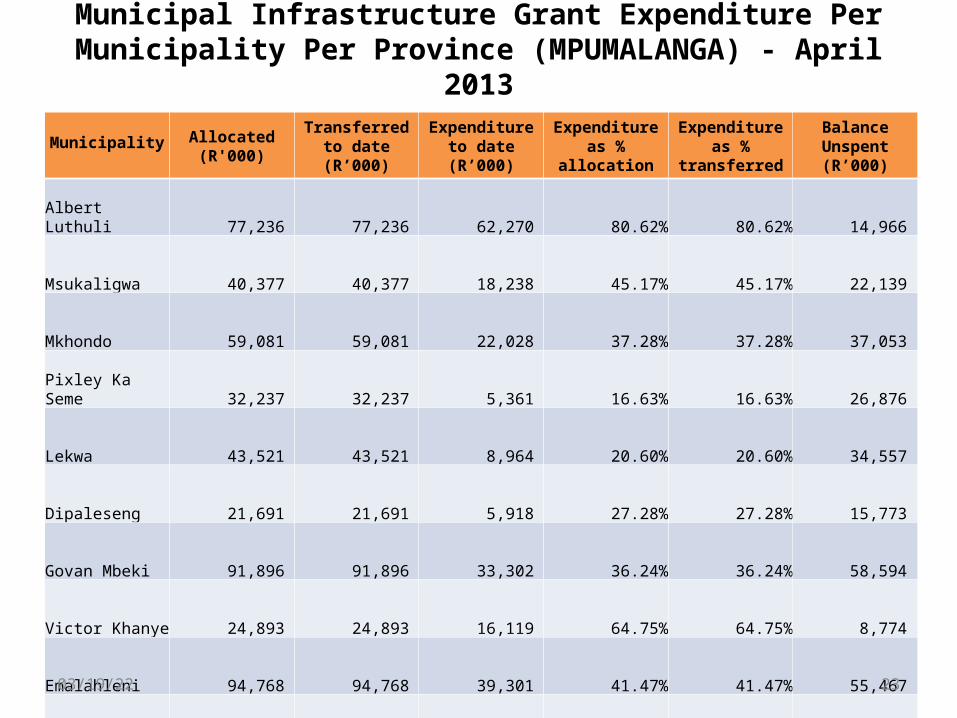
Municipal Infrastructure Grant Expenditure Per Municipality Per Province (MPUMALANGA) - April 2013
Municipality Allocated (R'000)
Transferred to date
(R’000)
Expenditure to date
(R’000)
Expenditure as % allocation
Expenditure as % transferred
Balance Unspent(R’000)
Albert Luthuli
77,236 77,236 62,270 80.62% 80.62% 14,966
Msukaligwa
40,377 40,377 18,238 45.17% 45.17% 22,139
Mkhondo
59,081 59,081 22,028 37.28% 37.28% 37,053
Pixley Ka Seme
32,237 32,237 5,361 16.63% 16.63% 26,876
Lekwa
43,521 43,521 8,964 20.60% 20.60% 34,557
Dipaleseng
21,691 21,691 5,918 27.28% 27.28% 15,773
Govan Mbeki
91,896 91,896 33,302 36.24% 36.24% 58,594
Victor Khanye
24,893 24,893 16,119 64.75% 64.75% 8,774
Emalahleni
94,768 94,768 39,301 41.47% 41.47% 55,467
Steve Tshwete
37,552 37,552 30,189 80.39% 80.39% 7,363
Emakhazeni
15,929 15,929 6,199 38.92% 38.92% 9,730
Thembisile
108,092 108,092 48,579 44.94% 44.94% 59,513
Dr JS Moroka
110,783 110,783 34,314 30.97% 30.97% 76,469 2304/20/23
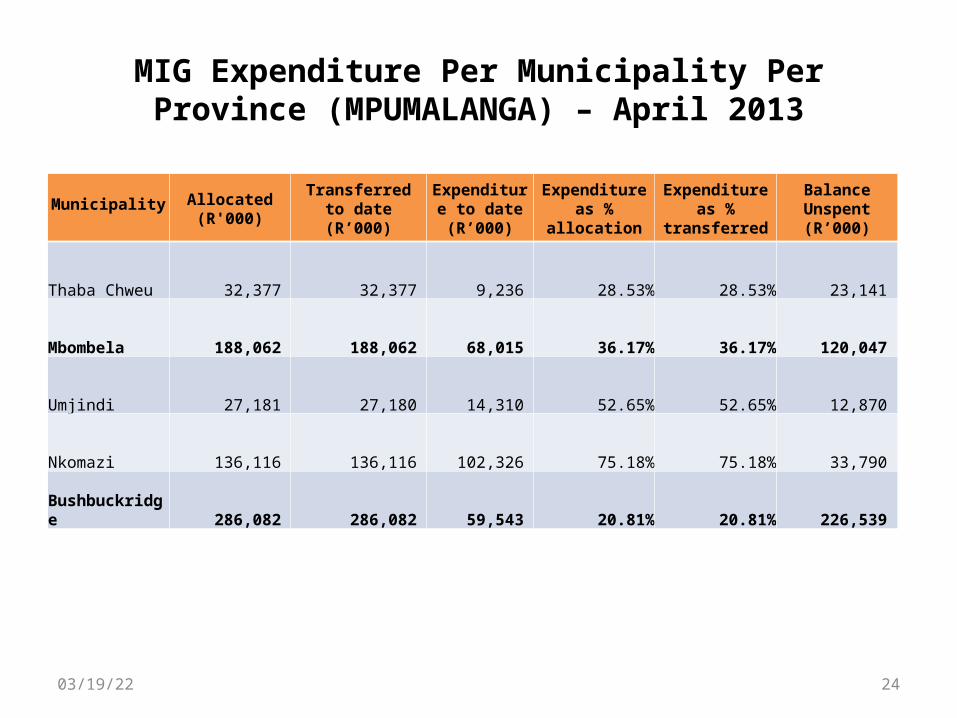
MIG Expenditure Per Municipality Per Province (MPUMALANGA) – April 2013
Municipality Allocated (R'000)
Transferred to date
(R’000)
Expenditure to date(R’000)
Expenditure as % allocation
Expenditure as % transferred
Balance Unspent(R’000)
Thaba Chweu
32,377 32,377
9,236 28.53% 28.53% 23,141
Mbombela
188,062 188,062 68,015 36.17% 36.17% 120,047
Umjindi
27,181 27,180 14,310 52.65% 52.65% 12,870
Nkomazi
136,116 136,116
102,326 75.18% 75.18% 33,790
Bushbuckridge
286,082 286,082 59,543 20.81% 20.81% 226,539
2404/20/23

Municipal Infrastructure Grant Expenditure Per Municipality Per Province (NORTHERN CAPE) – April 2013
Municipality Allocated (R'000)Transferred to
date(R’000)
Expenditure to date
(R’000)
Expenditure as % allocation
Expenditure as % transferred
Balance Unspent(R’000)
Richtersveld
8,628 8,628 - 0.00% 0.00% 8,628
Nama Khoi
16,088 16,088 1,622 10.08% 10.08% 14,466
Kamiesberg
11,686 11,686 4,331 37.06% 37.06% 7,355
Hantam
12,743 12,743 11,650 91.42% 91.42% 1,093
Karoo Hoogland
11,381 11,381 3,159 27.76% 27.76% 8,222
Khai-Ma
10,723 10,723 - 0.00% 0.00% 10,723
Ubuntu
11,510 11,510 6,189 53.77% 53.77% 5,321
Umsobomvu
14,271 14,271 6,596 46.22% 46.22% 7,675
Emthanjeni
16,141 16,141 5,145 31.88% 31.88% 10,996
Kareeberg
9,574 9,574 2,753 28.75% 28.75% 6,821
Renosterberg
9,911 9,911 2,603 26.26% 26.26% 7,308
Thembelihle
13,569 13,569 9,095 67.03% 67.03% 4,474
Siyathemba
12,429 12,429 6,478 52.12% 52.12% 5,951
Siyancuma
20,513 20,513 7,657 37.33% 37.33% 12,856 2504/20/23

MIG Expenditure Per Municipality Per Province (NORTHERN CAPE) – April 2013
MunicipalityAllocated
(R'000)
Transferred to date
(R’000)
Expenditure to date
(R’000)
Expenditure as % allocation
Expenditure as % transferred
Balance Unspent(R’000)
Mier
11,384 11,384 4,164 36.58% 36.58% 7,220
!Kai! Garib
20,977 20,977 16,636 79.31% 79.31% 4,341
//Khara Hais
23,789 23,789 10,680 44.89% 44.89% 13,109
!Kheis
13,870 13,870 10,987 79.21% 79.21% 2,883
Tsantsabane
14,420 14,420 2,627 18.22% 18.22% 11,793
Kgatelopele
9,373 9,373 - 0.00% 0.00% 9,373
Sol Plaatje
55,028 55,028 26,334 47.86% 47.86% 28,694
Dikgatlong
25,617 25,617 25,616 100.00% 100.00% 1
Magareng
13,099 13,099 8,180 62.45% 62.45% 4,919
Phokwane
26,366 26,366 14,836 56.27% 56.27% 11,530
Joe Morolong
56,479 56,479 51,574 91.32% 91.32% 4,905
Ga-Segwanyane
55,163 55,163 22,144 40.14% 40.14% 33,019
Gamagara
10,697 10,697 10,670 99.75% 99.75% 27
2604/20/23
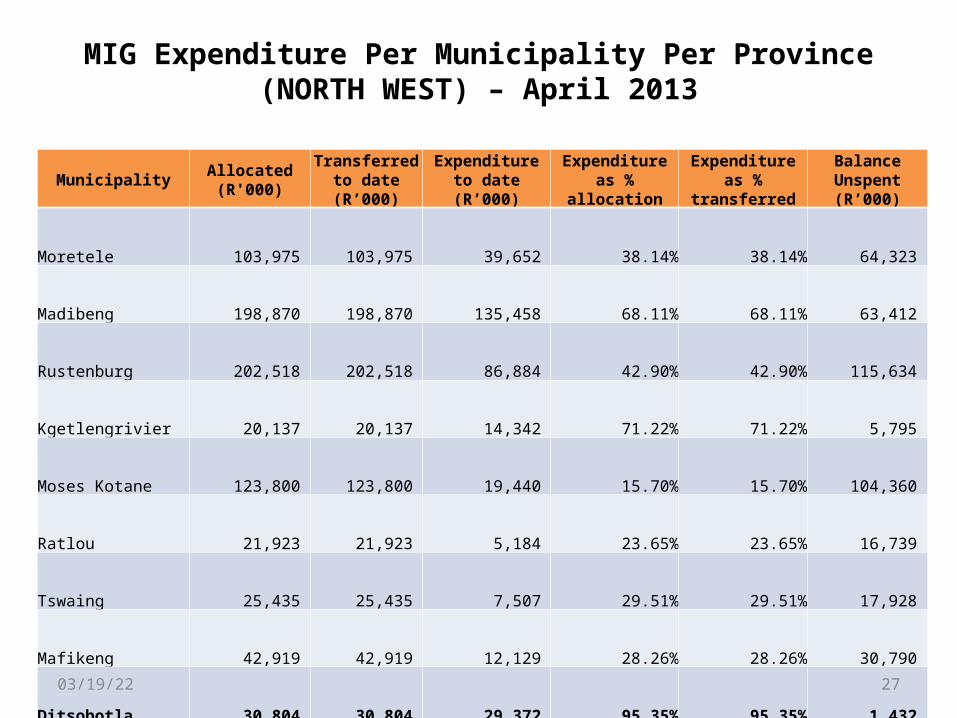
MIG Expenditure Per Municipality Per Province (NORTH WEST) – April 2013
MunicipalityAllocated
(R'000)
Transferred to date
(R’000)
Expenditure to date
(R’000)
Expenditure as % allocation
Expenditure as % transferred
Balance Unspent(R’000)
Moretele
103,975 103,975 39,652 38.14% 38.14% 64,323
Madibeng
198,870 198,870 135,458 68.11% 68.11% 63,412
Rustenburg
202,518 202,518 86,884 42.90% 42.90% 115,634
Kgetlengrivier
20,137 20,137 14,342 71.22% 71.22% 5,795
Moses Kotane
123,800 123,800 19,440 15.70% 15.70% 104,360
Ratlou
21,923 21,923 5,184 23.65% 23.65% 16,739
Tswaing
25,435 25,435 7,507 29.51% 29.51% 17,928
Mafikeng
42,919 42,919 12,129 28.26% 28.26% 30,790
Ditsobotla
30,804 30,804 29,372 95.35% 95.35% 1,432
Ramotshere Moiloa
27,401 27,401 4,967 18.13% 18.13% 22,434 Ngaka Modiri Molema District Municipality
203,144 203,144 166,716 82.07% 82.07% 36,428
2704/20/23

MIG Expenditure Per Municipality Per Province (NORTH WEST) – April 2013
MunicipalityAllocated
(R'000)
Transferred to date
(R’000)
Expenditure to date
(R’000)
Expenditure as % allocation
Expenditure as % transferred
Balance Unspent(R’000)
Naledi
14,567 14,567 7,183 49.31% 49.31% 7,384
Mamusa
16,739 16,739 9,372 55.99% 55.99% 7,367
Greater Taung
32,722 32,722 4,138 12.65% 12.65% 28,584
Lekwa-Teemane
15,987 15,987 6,526 40.82% 40.82% 9,461
NW397
29,856 29,856 10,209 34.19% 34.19% 19,647 Dr Ruth Segomotsi Mompati District Municipality
111,098 111,098 45,611 41.05% 41.05% 65,487
Ventersdorp
24,317 24,317 12,497 51.39% 51.39% 11,820
Tlokwe
41,475 41,475 3,686 8.89% 8.89% 37,789
City of Matlosana
122,046 122,046 27,130 22.23% 22.23% 94,916
Maquassi Hills
34,470 34,470 24,296 70.48% 70.48% 10,174
2804/20/23

MIG Per Municipality Per Province (WESTERN CAPE) – April 2013
MunicipalityAllocated
(R'000)
Transferred to date
(R’000)
Expenditure to date
(R’000)
Expenditure as % allocation
Expenditure as % transferred
Balance Unspent(R’000)
Matzikama
18,584 18,584 13,874 74.66% 74.66% 4,710
Cederberg
15,544 15,544 5,065 32.58% 32.58% 10,479
Bergrivier
11,799 11,799 5,272 44.68% 44.68% 6,527
Saldanha Bay
18,394 18,394 16,170 87.91% 87.91% 2,224
Swartland
14,525 14,525 14,525 100.00% 100.00% -
Witzenberg
22,112 22,112 15,752 71.24% 71.24% 6,360
Drakenstein
35,080 35,080 30,167 86.00% 86.00% 4,913
Stellenbosch
25,420 25,420 17,844 70.20% 70.20% 7,576
Breede Valley
30,911 30,911 17,729 57.35% 57.35% 13,182
Langeberg
18,376 18,376 10,935 59.51% 59.51% 7,441
2904/20/23

MIG Expenditure Per Municipality Per Province (WESTERN CAPE) – April 2013
Municipality Allocated (R'000)
Transferred to date
(R’000)
Expenditure to date
(R’000)
Expenditure as % allocation
Expenditure as % transferred
Balance Unspent(R’000)
Theewaterskloof
26,174 26,174 11,819 45.16% 45.16% 14,355
Overstrand
16,947 16,947 10,674 62.99% 62.99% 6,273
Cape Agulhas
10,284 10,284 6,723 65.37% 65.37% 3,561
Swellendam
11,125 11,125 8,101 72.82% 72.82% 3,024
Kannaland
11,517 11,517 4,092 35.53% 35.53% 7,425
Hessequa
12,799 12,799 4,460 34.85% 34.85% 8,339
Mossel Bay
17,156 17,156 13,178 76.81% 76.81% 3,978
George
44,044 44,044 20,459 46.45% 46.45% 23,585
Oudtshoorn
17,505 17,505 11,595 66.24% 66.24% 5,910
Bitou
14,655 14,655 13,674 93.31% 93.31%
981
Knysna
24,180 24,180 17,597 72.77% 72.77% 6,583
Laingsburg
8,194 8,194 4,921 60.05% 60.05% 3,273
Prince Albert
8,558 8,558 5,671 66.27% 66.27% 2,887
Beaufort West
21,437 21,437 19,972 93.17% 93.17% 1,465 3004/20/23
Challenges (1/4)
The challenges which are outlined in the following 3 slides are based on the experiences and lessons from interactions with 92 MIG under spending municipalities during the 2012/13 financial year.
3104/20/23

Challenges (2/4)
Institutional (administration and governance) – A large number of municipalities are faced with key positions
vacant (e.g. Municipal Manager, CFO, Director – Technical Services) for a long time or others have people acting in these positions resulting in lack of decision making and accountability thus significantly delaying progress on projects
– Municipalities are characterized by high staff turnover making the retention of institutional memory impossible and thereby necessitating the re-training of key staff members and resulting in further delays
– Some municipal officials are totally lacking in accountability and delay progress by not following up on necessary processes pertaining to project implementation
3204/20/23

Challenges (3/4)
Planning and Procurement– Municipalities fail to prioritise projects and get
necessary documents to initiate projects on time.• e.g. technical reports not submitted or inputs by sector
departments not considered timeously
– Often the lack of understanding of Supply Chain Management procedures and lack of commitment to processes and timelines result in further delays.
• e.g. Bid evaluation committees and bid adjudication committees are not sitting regularly thereby negatively impacting on decision making processes and delaying project initiation and implementation.
3304/20/23

Challenges (4/4)
Project and Financial Management– There is often no oversight or management of
consultants/contractors on the part of the relevant municipal officials.
3404/20/23

Supporting Municipalities (1/2) Some HR issues impacting on the institutional (administration
and governance) matters include the following:• Supporting municipalities to develop and implement recruitment and
retention strategies.• Monitoring municipalities to fill vacancies in terms of the Municipal
Structures Act. Planning and Procurement:
• District Appraisal sessions convened by the MIG national unit help municipalities to commit their allocations well in advance of the forthcoming financial year in order to get projects in construction at the commencement of the municipal financial year.
• MISA is deploying engineers to assist with infrastructure planning in municipalities (this deployment is done following the diagnostic conducted, which revealed challenges of infrastructure delivery)
• The Provincial Treasuries will be requested to provide support around procurement issues.
3504/20/23

Supporting Municipalities (2/2)
Project and Financial Management: The DCoG to continue providing advise to those municipalities (in the context of MIG) to appropriately manage their projects from both project and financial management perspectives.
3604/20/23