1 model academic curriculum module 13 assessing and evaluating responses
TRANSCRIPT

1
MODEL ACADEMIC CURRICULUM
MODULE 13
Assessing and Evaluating Responses

2
Module 13 Components
• Assessment and Evaluation
• Conducting Community Surveys

3
Introduction
1. Did the problem decline?
2. If so, did the response cause the decline?
The purpose of assessing a problem-solving effort is to help you make better decisions by answering two specific questions:

4
Assessment and Evaluation
5
Reviewing the SARA Model
•SCANNING
•ANALYSIS
•RESPONSE
•ASSESSMENT

6
The Role of Evaluation in Problem-Solving

7
Types of Evaluations
• Process Evaluations
• Impact Evaluations

8
Interpretation of Process and Impact
Evaluations

9
Conducting Process Evaluations
• Observe response implementation
• Interview relevant parties
• Conduct focus groups
• Conduct surveys

10
Conducting Process Evaluations
• Record decisions and progress in meeting minutes
• Develop a timeline of important achievements
• Document everything!!

11
Process Evaluation Timeline
Process Evaluation Timeline
Jan
-03
Feb
-03
Mar
-03
Ap
r-03
May
-03
Jun
-03
Jul-
03
Au
g-0
3
Sep
-03
Oct
-03
No
v-03
Dec
-03
Project meetings
Analysis of problem
Training development
Training of first 50 tellers
Training of next 100 tellers
Training of final 50 tellers
Response fully implemented
12
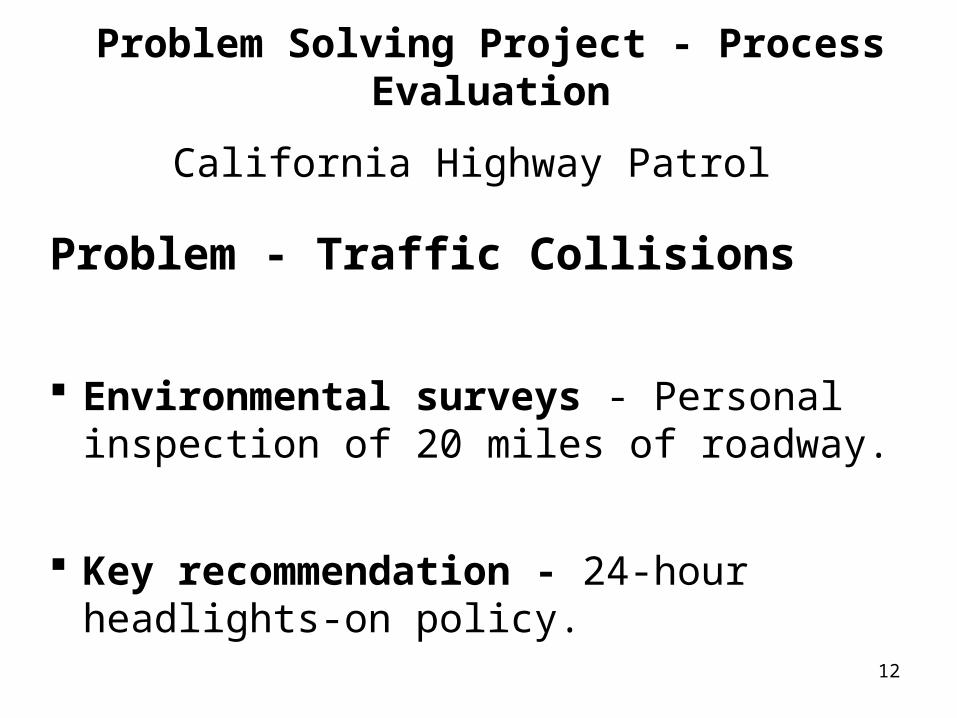
Problem Solving Project - Process Evaluation
California Highway Patrol
Problem - Traffic Collisions
Environmental surveys - Personal inspection of 20 miles of roadway.
Key recommendation - 24-hour headlights-on policy.

13
Conducting Impact Evaluations
Measures– Quantitative Measures
– Qualitative Measures
– Measurement Validity
– Selecting Valid Measures
14
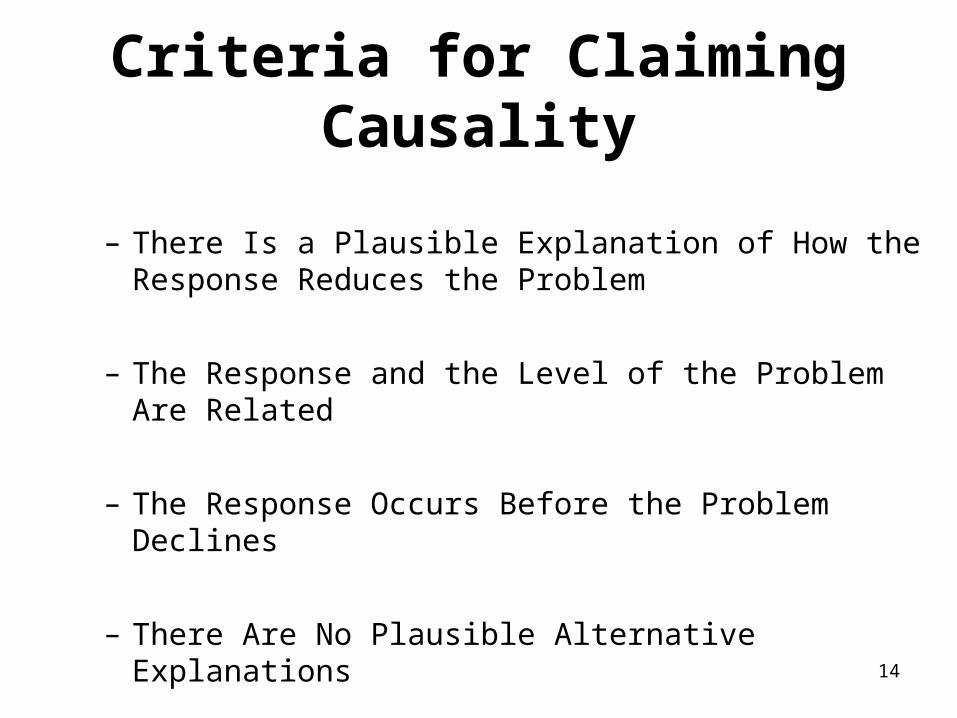
Criteria for Claiming Causality
– There Is a Plausible Explanation of How the Response Reduces the Problem
– The Response and the Level of the Problem Are Related
– The Response Occurs Before the Problem Declines
– There Are No Plausible Alternative Explanations

15

16
Types of Evaluation Designs

17
Pre-Post Designs

18
Pre-Post Design with a Control Group

19
Interrupted Time Series Designs

20
Multiple Time Series Design

21
Practical Limitations to Interrupted Time Series Designs • Measurement is expensive or difficult.
• Data are unavailable for many periods before the response.
• Decision-makers cannot wait for sufficient time to elapse after the response.
• Data recording practices have changed, making inter-period comparisons invalid.
• Problem events are rare for short time intervals, forcing you to use fewer, longer intervals.

22
Combining and Selecting Designs

23
Spatial Displacement of Crime or Disorder, and
Spatial Diffusion of Crime Prevention Benefits
24
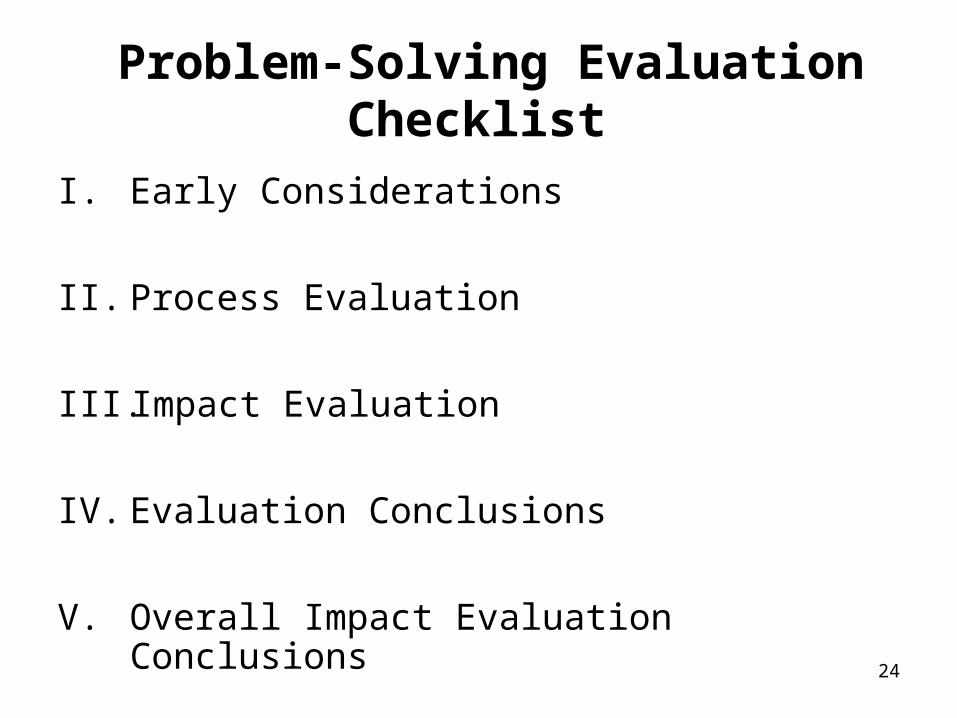
Problem-Solving Evaluation Checklist
I. Early Considerations
II. Process Evaluation
III. Impact Evaluation
IV. Evaluation Conclusions
V. Overall Impact Evaluation Conclusions

25
I. Early Considerations
A. What will the evaluation help you decide?
B. Do you know the problem?
C. Do you know how the response works?
26
II. Process Evaluation
A. Did you implement the response?
B. Did you implement enough of the response?

27
III. Impact Evaluation
A. Do you need a control group?
B. How often can you measure the problem?
C. What type of evaluation design should you use?
D. What type of control group do you need?

28
IV. Evaluation Conclusions
A. What are your findings from the process evaluation?
B. What are your findings from the impact evaluation?

29
V. Overall Impact Evaluation Conclusions
1. Did the problem decline after the response?
2. If the problem did decline, did it do so at a faster rate after the response than before the response?
3. If the problem did decline, can you rule out all other plausible explanations for the decline, other than the response? Use your list of differences between the response and control groups to help answer this question.

30
Conducting Community Surveys

31
General Use of SurveysGeneral Use of Surveys
CJ Researchers – to better understand crime and public fear of crime
Social Scientists and Political Pollsters– to learn about social relations and predict future events
Government Agencies– to predict economic trends and how people react to policy
Police– to measure public opinion and operational effectiveness

32
Specific Uses for Community-based Surveys
• Gather information about public attitudes regarding police or crime
• Detect and analyze problems in neighborhoods
• Evaluate problem solving efforts and other interventions by taking baseline measures
• Control crime and fear of crime

33
Basic Sampling Designs
Simple random sampling – ensures that everyone in the population has a chance to be included in the sampling bias
Nonrandom sampling – sometimes is the best option available given the time and other limits
How many will be sampled?
- Sample size, sampling error
Survey Process

34
– Mail surveys
– Telephone surveys
– In-person interviews
– Internet-based surveys
– Officer/Deputy or volunteer delivery
– Surveys are filled out at a designated location
Methods for Contacting Respondents

35
– General considerations
– How to ask questions
– Open ended vs. close ended questions
– Designing the questionnaire
Asking Questions

36
– Characteristics of the sample
– Does the sample represent the population?
– Making inferences about the population
– Estimating relationships
– Significance testing
Analysis of the Data

37
94.188.7
87.892.1
92.989.9
76.796.9
10085.7
81.8100
91.2100
93.3
Percentage Positive
MenWomen
Crime VictimNot a Victim
RenterHomeowner
Live in Mobile HomeLive in Condo
Less than 1 year in Reno10-15 years in Reno
American IndianBlackWhiteAsian
Hispanic
70 80 90 100
By Demographic CharacteristicsIS RENO SAFE?

38
8278
49
82
76
51
74 74
32
9188
81
SurveyPerformance Lawbreakers Image Safety
30
40
50
60
70
80
90
100
This Survey Last Survey First Survey
Percentage of Positive Responses
Key Survey Questions
39
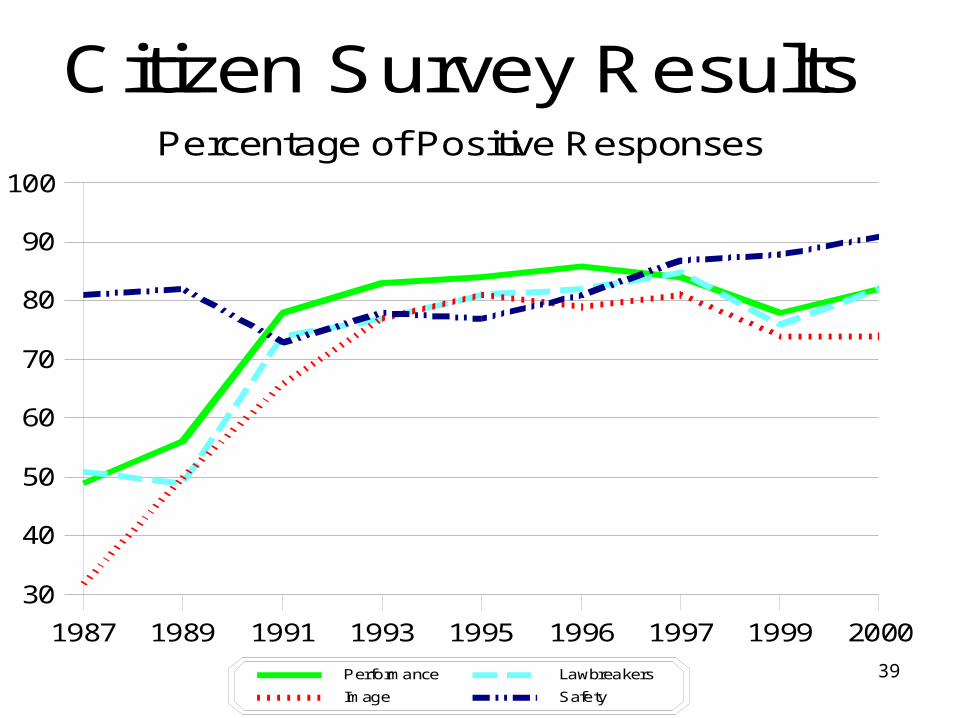
1987 1989 1991 1993 1995 1996 1997 1999 2000
30
40
50
60
70
80
90
100
Performance Lawbreakers
Image Safety
Percentage of Positive Responses
Citizen Survey Results