1 mobile, web, cloud and programming (with credits to dennis roberson and walt davis) february 17,...
TRANSCRIPT

1
Mobile, Web, CloudAnd Programming
(with credits to Dennis Roberson and Walt Davis)
February 17, 2013
Justin Y. Shi | [email protected]

2
Moment of Silence for Professor Charles Kapps
The Rev. Charles Augustus Kapps, Ph.D. quietly passed away Sundaymorning, February 10, 2013. He was at home surrounded by his family.

3

4
Gender of the First Computers• It was female.• This is not well-known.• But, I have the proof: In WWII, woman contributed more
to programming than man: Top Secret Roses (http://technicallyphilly.com/2010/09/22/top-secret-rosies-documentary-tells-story-of-women-computers-in-wwii)

5
World Changes According to Dave Evans*
• 6 devices per living person by 2020. (Mobile)
• Zettaflood is Coming: 1.2 Zettabytes unique data in 2011. (Web)
• 1/3 of all data will be on the cloud by 2020.
* Cisco’s Chief Futurist (this is a job title…)
6
,
, , , , , ,
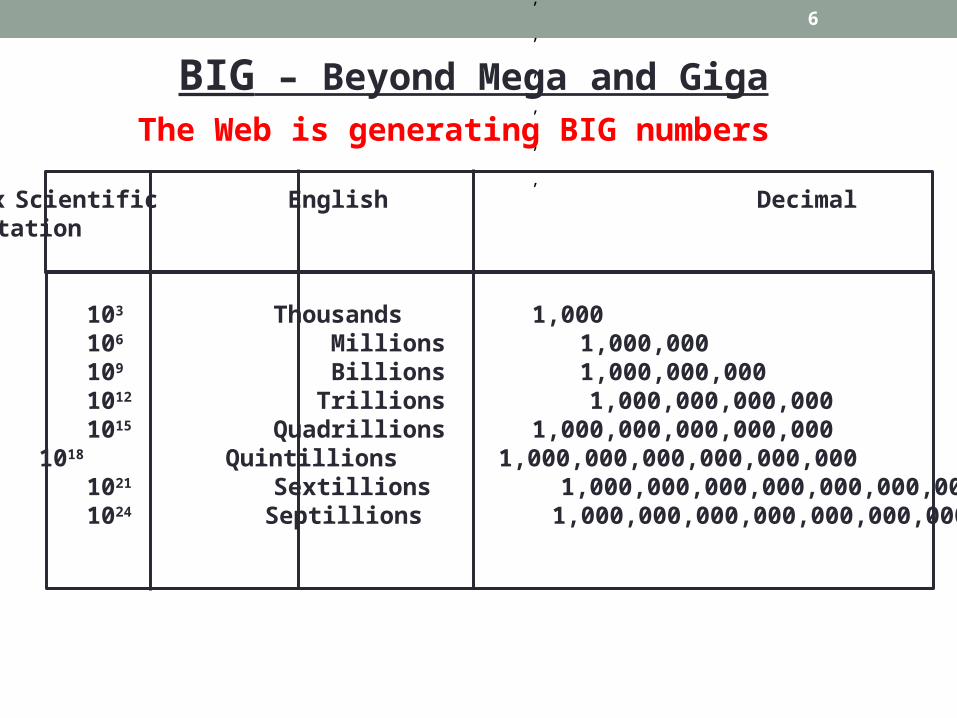
BIG – Beyond Mega and Giga
Prefix Scientific English DecimalNotation
Kilo 103 Thousands 1,000Mega 106 Millions 1,000,000Giga 109 Billions 1,000,000,000Tera 1012 Trillions 1,000,000,000,000Peta 1015 Quadrillions 1,000,000,000,000,000Exa 1018 Quintillions 1,000,000,000,000,000,000Zetta 1021 Sextillions 1,000,000,000,000,000,000,000Yotta 1024 Septillions 1,000,000,000,000,000,000,000,000
The Web is generating BIG numbers

7
,
, , , , , ,
BIG – Beyond Mega and Giga
Prefix Scientific English DecimalNotation
Kilo 103 Thousands 1,000Mega 106 Millions 1,000,000Giga 109 Billions 1,000,000,000Tera 1012 Trillions 1,000,000,000,000Peta 1015 Quadrillions 1,000,000,000,000,000Exa 1018 Quintillions 1,000,000,000,000,000,000Zetta 1021 Sextillions 1,000,000,000,000,000,000,000Yotta 1024 Septillions 1,000,000,000,000,000,000,000,000
The Web is generating BIG numbers
Wireless Trends © Walt Davis 2011

8
,
, , , , , ,
Refining BIG – Beyond Mega and Giga
Prefix Scientific English DecimalNotation
Kilo 103 Thousands 1,000Mega 106 Millions 1,000,000Giga 109 Billions 1,000,000,000Tera 1012 Trillions 1,000,000,000,000Peta 1015 Quadrillions 1,000,000,000,000,000Exa 1018 Quintillions 1,000,000,000,000,000,000Zetta 1021 Sextillions 1,000,000,000,000,000,000,000Yotta 1024 Septillions 1,000,000,000,000,000,000,000,000
The Web is redefining BIG numbers
Est 2020 Traffic = 2 ZettaBytes / MonthData that would fill 1 Billion 1 Terabyte disks

9
WEB OF CLOUDS
Google+
YouTubeAzure
Amazon
Wireless Trends © Walt Davis 2011 10
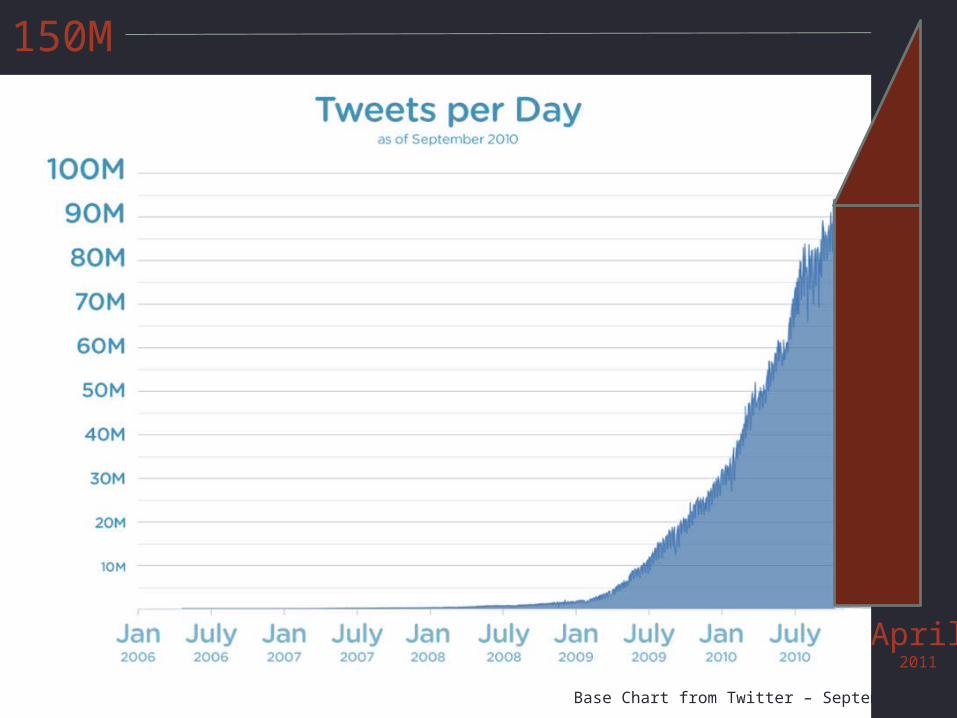
Base Chart from Twitter – September 2010
150M
April2011

11
13
What do these mean?• Information expansion• Privacy reduction• Security challenged
• And all thanks to:
Mobile, Web and Cloud
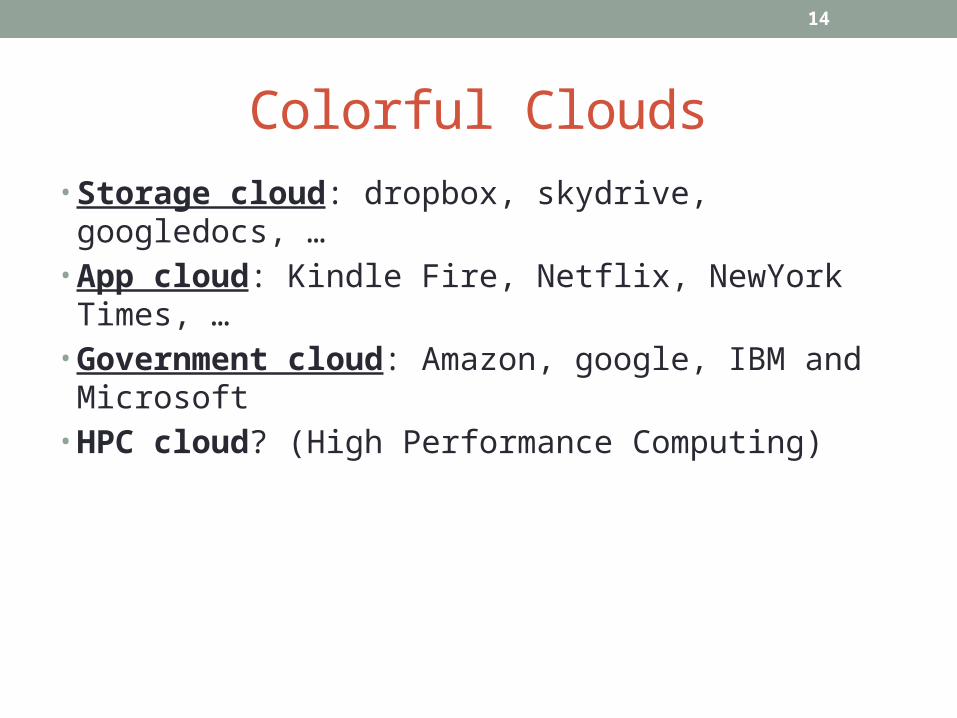
14
Colorful Clouds• Storage cloud: dropbox, skydrive, googledocs, …• App cloud: Kindle Fire, Netflix, NewYork Times, …• Government cloud: Amazon, google, IBM and Microsoft• HPC cloud? (High Performance Computing)

15
Programming
Is the ONLY way you can exercise control over Mobile, Web and Cloud.

16
How to Programming• It is like “giving directions”• Or, like directing traffic
• Need to learn multiple languages, just like in the real world. No big deal, right?
• Your reward: Devices behave exactly the way you wanted• You are the MASTER.

17
Mobile Programming
• So you phone will truly obey you…

18
Web Programming• It is hard to separate from mobile programming (why?)

19
Cloud Programming• So you know exactly how your stuff is saved: SLA
20
Mobile Programming Special Challenges
• It can bring time, space, people and things together without effort.
• It can move with you anywhere you go.• Immediate privacy and security concerns:
• What data do you collect?• Where do you store the data?• How are you going to share the data?• What do you extract?

21
Respect the Numbers…
Look where the World is going…

23
Wireless Broadband Network Trends
• Internet and Applications Growth
• Wire-line and Wireless Traffic Growth
• Wireless Growth – Smart Phones and Beyond
• So What?
24
The Mobile Programming Pyramid
• It’s fun.• It’s useful.• It makes money for you.• It challenges your creativity.• It helps solving people’s problems.• It gives you something to brag about.• It has more potentials than desktop and servers.• It is growing.• It’s cool.
25
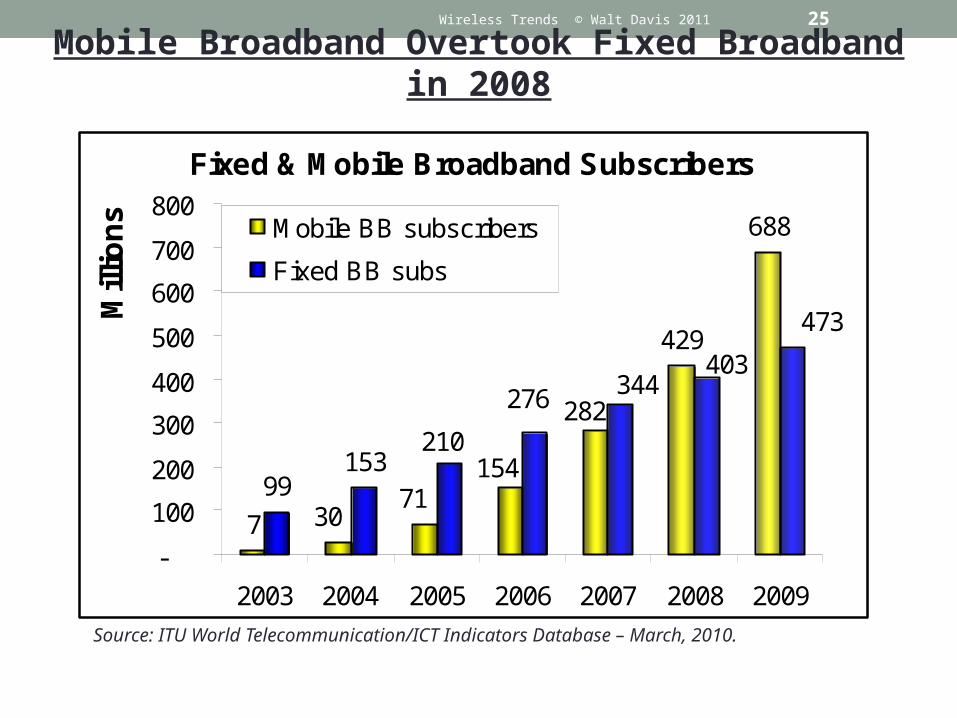
Mobile Broadband Overtook Fixed Broadband in 2008
Source: ITU World Telecommunication/ICT Indicators Database – March, 2010.
Fixed & Mobile Broadband Subscribers
7
429
688
99153
3071
154
282
473
276
210
344403
-
100
200
300
400
500
600
700
800
2003 2004 2005 2006 2007 2008 2009
Mill
ion
s Mobile BB subscribers
Fixed BB subs
Wireless Trends © Walt Davis 2011

26
Telecom markets on the moveGrowth in ICTs, 1998-2009
Source: ITU World Telecommunication/ICT Indicators Database – March, 2010

27Wireless Trends © Walt Davis 2011
Growth of Mobile-only Internet Users
2010 2011 2012 2013 2014 20150
100
200
300
400
500
600
700
800
900
Middle East & AfricaCentral & Estern EuropeJapanWestern EuropeNorth AmerciaLatin AmericaAsia
Nu
mb
er o
f U
sers
, Mill
ion
s
Year
Wireless Trends © Walt Davis 2011 28
2009 2010 2011 2012 2013 20140.00
5,000.00
10,000.00
15,000.00
20,000.00
25,000.00
30,000.00
35,000.00
40,000.00
45,000.00
File SharingInternet Video to PCInternet Video to TVWeb / DataVideo CallingOnline GamingVoIP
Mo
nth
ly T
raff
ic in
Pe
taB
yte
s
YearSource: Cisco Visual Networking Index, 2010
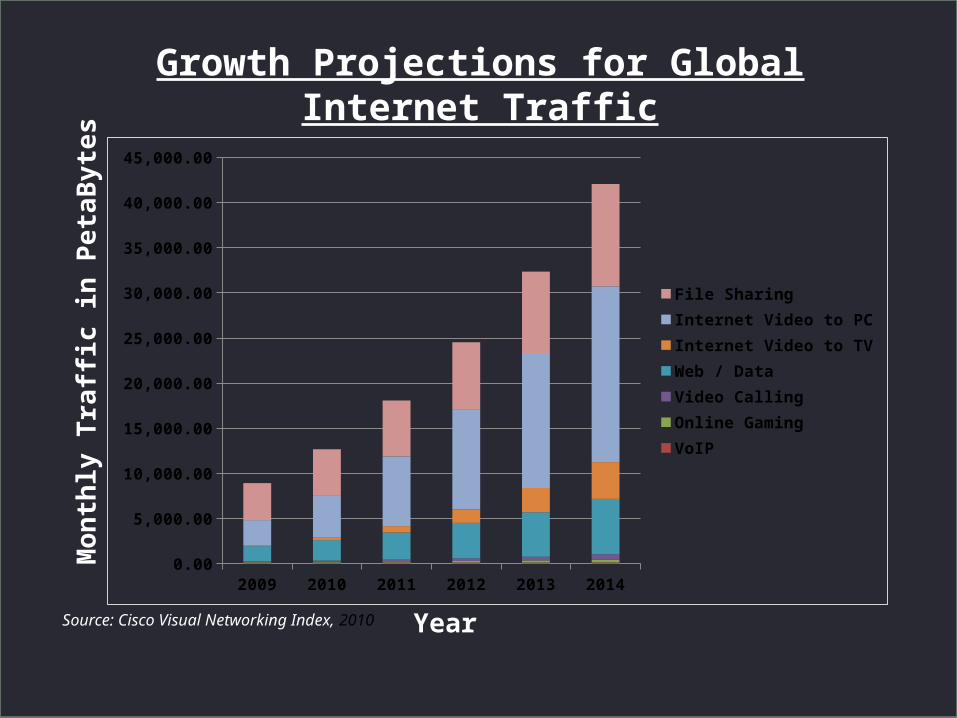
Growth Projections for Global Internet Traffic

29Wireless Trends © Walt Davis 2011
2009 2010 2011 2012 2013 20140.00
5,000.00
10,000.00
15,000.00
20,000.00
25,000.00
30,000.00
35,000.00
40,000.00
45,000.00
File SharingInternet Video to PCInternet Video to TVWeb / DataVideo CallingOnline GamingVoIP
Growth Projections for Global Internet TrafficM
on
thly
Tra
ffic
in P
eta
By
tes
Year
The total of all forms of video (Video to TV, Video to PC, and
Video calling) is projected to account for over
90% of global consumer traffic by 2014
Source: Cisco Visual Networking Index, 2010

30Wireless Trends © Walt Davis 2011
Wireless Broadband Network Trends
• Internet and Applications Growth
• Wire-line and Wireless Traffic Growth
• Wireless Growth – Smart Phones and Beyond
• So What?

31Wireless Trends © Walt Davis 2011
Cellular Subscriber Growth is Slowing
Source: ITU World Telecommunication/ICT Facts and Figures – October 20, 2010
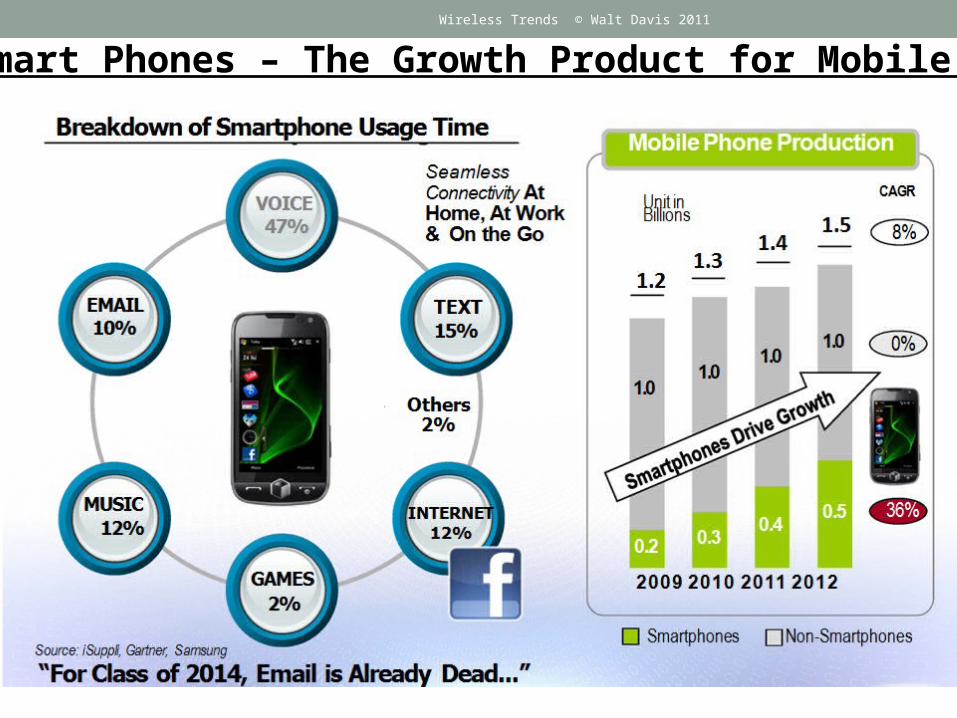
Smart Phones – The Growth Product for Mobile Wireless Trends © Walt Davis 2011

33Wireless Trends © Walt Davis 2011
Projected Smartphone Growth
34
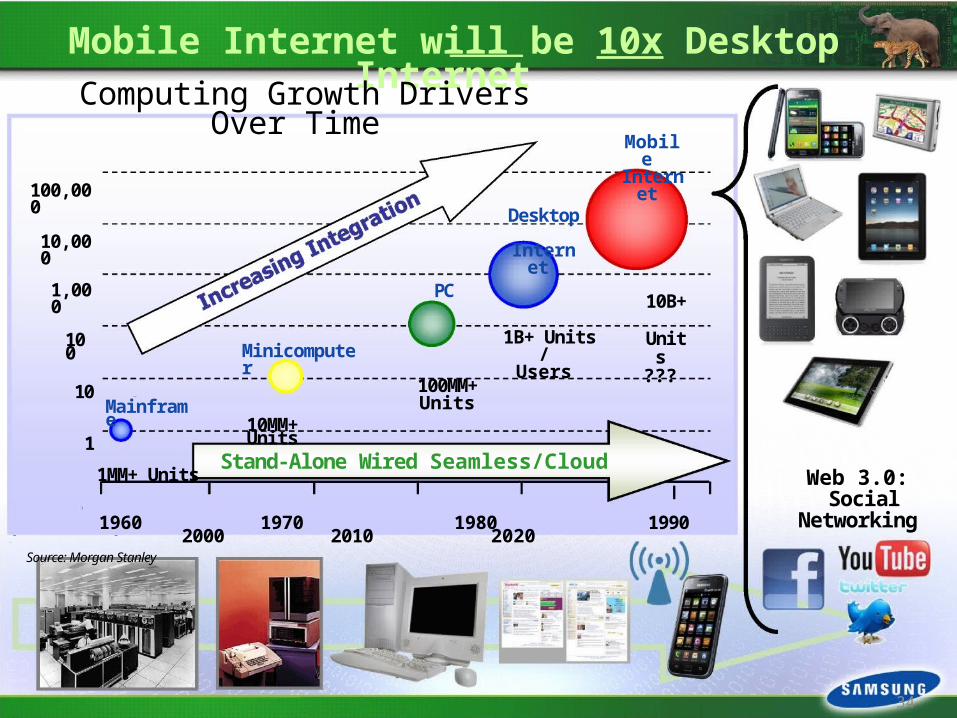
Mobile Internet will be 10x Desktop Internet Computing Growth Drivers Over
Time Mobile Internet
100,000
10,000 Desktop Internet
1,000 PC
100 1B+ Units / Users
10B+
Units
??? Minicomputer
10 100MM+ Units Mainframe
10MM+ Units 1
1MM+ Units Stand-Alone Wired Seamless/Cloud
1960 1970 1980 1990 2000 2010 2020
Web 3.0: Social Networking
Source: Morgan Stanley
34
35
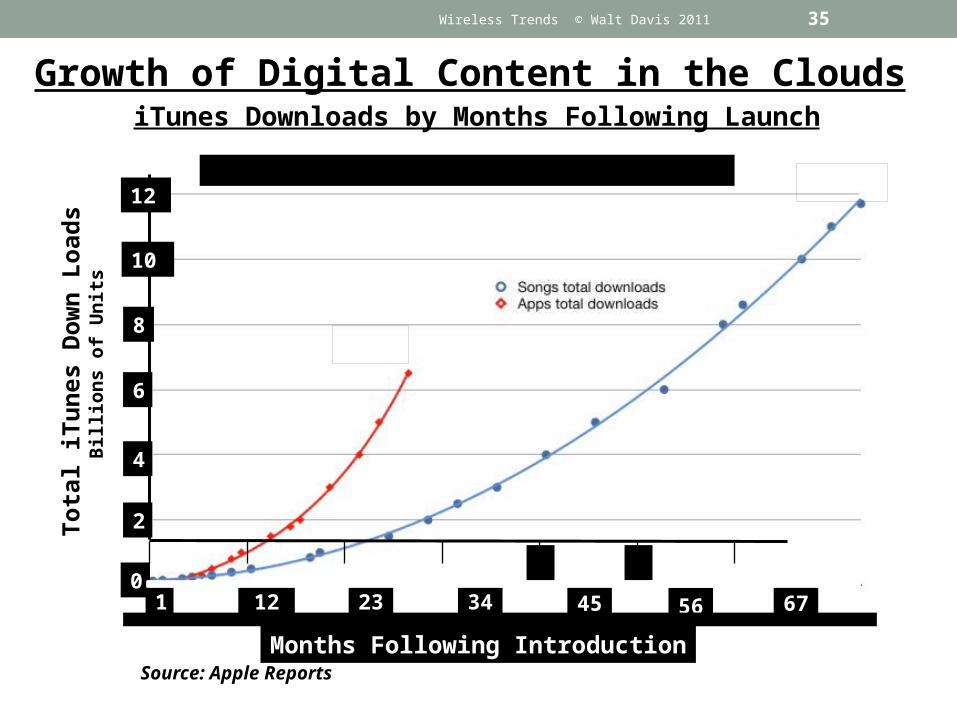
1 12 23 34 45 56 67
Months Following Introduction
0
2
4
6
8
10
12
Tota
l iT
un
es D
ow
n L
oad
s B
illi
on
s o
f U
nit
siTunes Downloads by Months Following Launch
Songs
Apps
Source: Apple Reports
Growth of Digital Content in the Clouds
Wireless Trends © Walt Davis 2011
36
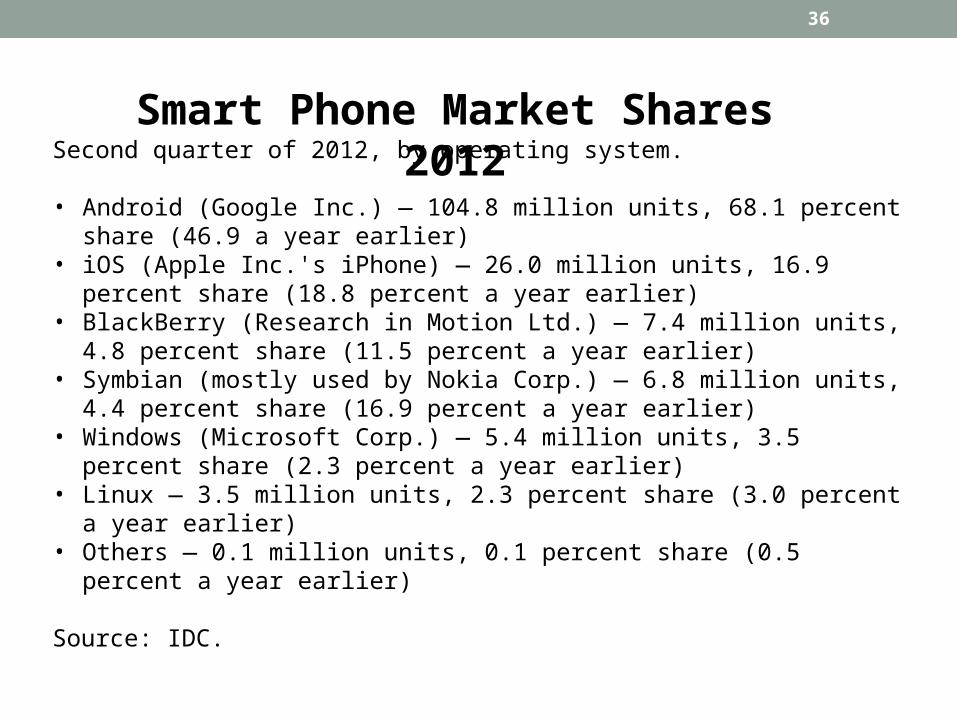
Second quarter of 2012, by operating system.
• Android (Google Inc.) — 104.8 million units, 68.1 percent share (46.9 a year earlier)
• iOS (Apple Inc.'s iPhone) — 26.0 million units, 16.9 percent share (18.8 percent a year earlier)
• BlackBerry (Research in Motion Ltd.) — 7.4 million units, 4.8 percent share (11.5 percent a year earlier)
• Symbian (mostly used by Nokia Corp.) — 6.8 million units, 4.4 percent share (16.9 percent a year earlier)
• Windows (Microsoft Corp.) — 5.4 million units, 3.5 percent share (2.3 percent a year earlier)
• Linux — 3.5 million units, 2.3 percent share (3.0 percent a year earlier)• Others — 0.1 million units, 0.1 percent share (0.5 percent a year earlier)
Source: IDC.
Smart Phone Market Shares 2012

37
Total Global Revenue: $906 billion (2010)
410M
457M
467M
552M
530M
530M2.6B
Mobile Connections By Region
Source: Mobile Voice and Data Forecast Pack: 2010–15 © OVUM 2010
38Wireless Trends © Walt Davis 2011
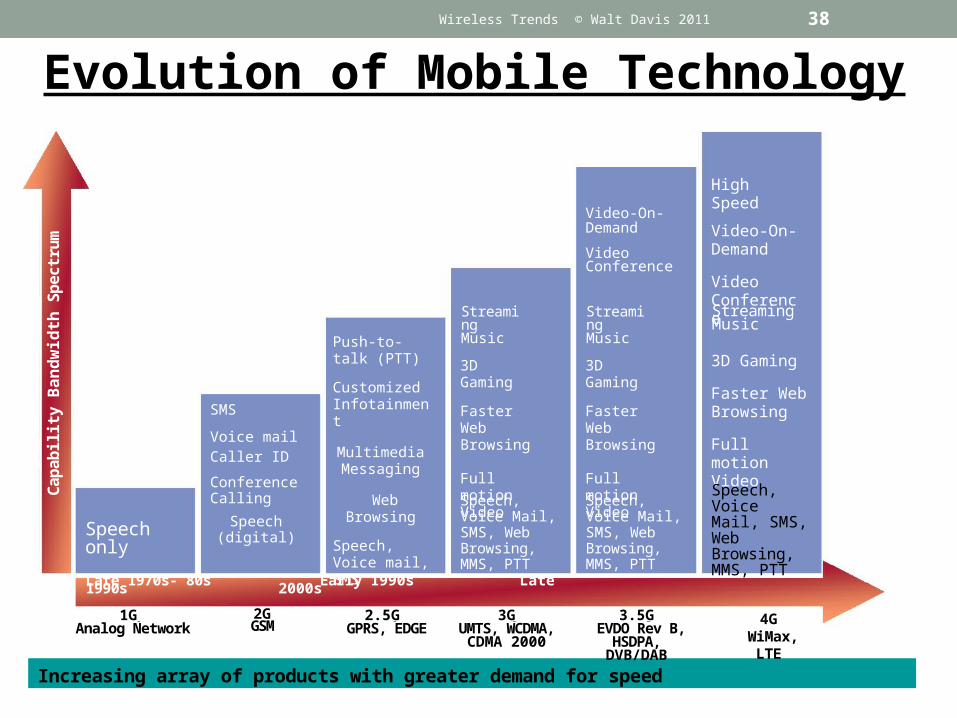
Increasing array of products with greater demand for speed
Cap
abili
ty B
an
dw
idth
Sp
ectr
um
1G Analog Network
Speech only
Late 1970s- 80s Early 1990s Late 1990s 2000s
SMS
Voice mail Caller ID
Conference Calling
Speech (digital)
2G GSM
Push-to-talk (PTT)
Customized Infotainment
Multimedia Messaging
Web Browsing
Speech, Voice mail, SMS
2.5G GPRS, EDGE
3G UMTS, WCDMA,
CDMA 2000
3D Gaming
Faster Web Browsing
Full motion Video
Speech, Voice Mail, SMS, Web Browsing, MMS, PTT
Streaming Music
3.5G EVDO Rev B, HSDPA,
DVB/DAB
Video-On-Demand
Video Conference
3D Gaming
Faster Web Browsing
Full motion Video
Speech, Voice Mail, SMS, Web Browsing, MMS, PTT
Streaming Music
High Speed
Video-On-Demand
Video Conference
3D Gaming
Faster Web Browsing
Full motion Video
Speech, Voice Mail, SMS, Web Browsing, MMS, PTT
Streaming Music
4G WiMax, LTE
Evolution of Mobile Technology

39Wireless Trends © Walt Davis 2011
Improvement in Bits per Hertz Spectral Efficiency

40
Wireless Trends © Walt Davis 2011
Postpaid Subscribers with Integrated Devices
Wireless Data Growth at AT&T 5000% growth over 12 quarters!
268% CAGR
Source:” Leveraging Standards to ServeGrowing Customer Needs” presentation byHank Kafka,Vice President, Architecture, AT&T
?

41
Wireless Data Growth at AT&T
2007 2008 2009 20100
20
40
60
80
100
120
70.177.0
85.195.5
AT&T Cellular Customers
Cu
sto
mer
s in
Mill
ion
s
• From 1Q2008 until 4Q2009, there was a 30.3% shift in the number of AT&T customers with Integrated Devices – primarily iPhones
• During this same period, 18.5 million new customers were added, and the data traffic increased by a factor of 13.5 iPhone users generated ~36X more
traffic than non-integrated devices
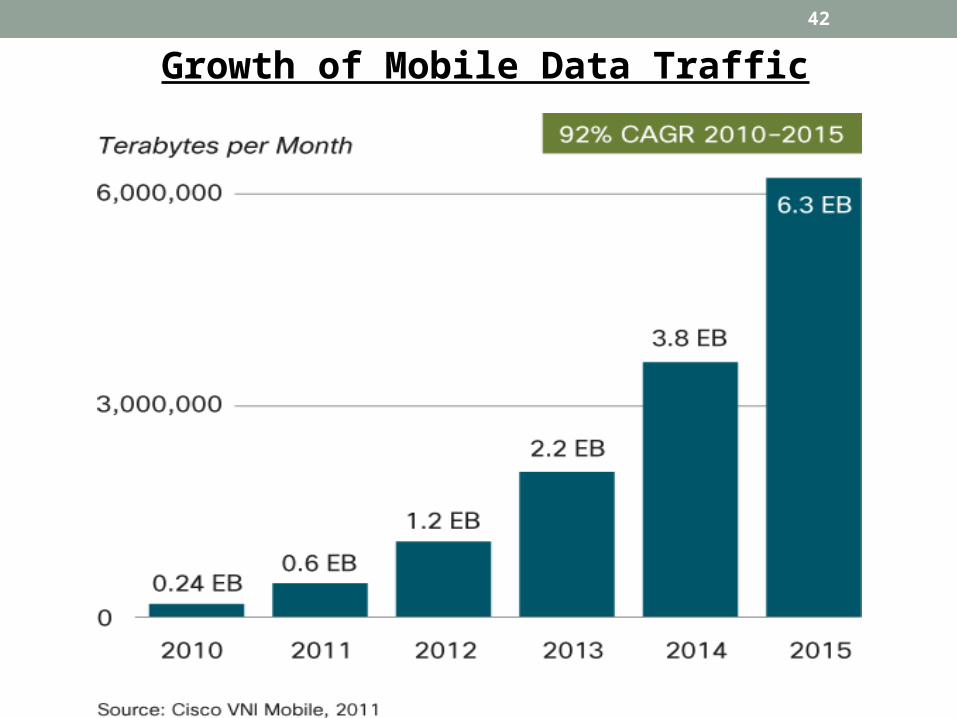
42
Growth of Mobile Data Traffic

43
FCC conclusions from “Mobile Broadband: the Benefits of Additional Spectrum”, October 2010:
·It is likely that mobile data demand will exhaust spectrum resources in the next five years;
·A spectrum deficit approaching 300 MHz is likely by 2014
·A narrowly circumscribed estimation of the economic benefit from releasing additional spectrum … is likely to exceed $100 billion
Source: Rysavy Research, February 2010
Future Bandwidth Requirements

44
Wireless Broadband Network Trends
• Internet and Applications Growth
• Wire-line and Wireless Traffic Growth
• Wireless Growth – Smart Phones and Beyond
• So What?
45
• Facebook and Twitter are rapidly replacing email and texting as the primary means of electronic communications.
• From a business opportunity perspective, Social Network focused software built to run with an Android end-user device for the Asian market seems like an obvious winner!
• Similarly, investments in companies with Internet / Smart Phone based Social Networking applications should be (or at least were) great investments and job opportunities.
Obvious

46
• Smart Phones and Tablets are rapidly replacing Laptops and Deskside Computers as the primary means of access to the Internet. Need to focus on these platforms.
• The world is becoming more transparent. You can run, but not hide.
•Mobile devices must rely on the web that must rely on the cloud for sustainable operations.
Less Obvious

47
Even Less Obvious• The vast amount of saved information offers enormous opportunities to better understand the dynamics of political, economic and technological trends.
•Big data applications are a really important opportunity given the data that is being generated and shared
• Unintended consequence (information security) is a huge issue. Need for Computer Scientists to work with other disciplines to meet the new opportunities.

48
Computer Science Challenges
• Wireless mobile devices are less reliable. How can we program them to provide reliable services?
• Mobile programming platforms evolve very fast. How to teach new technologies in Universities?
• Cloud devices are cheaper. Auction-based cloud devices are the cheapest. How can we program using auction-based resources for reliable service delivery?
• Supercomputers are awesome but too expensive. Can we build supercomputer in the cloud?
• What about auction-based supercomputers?

49
Are you ready for the challenges?
50
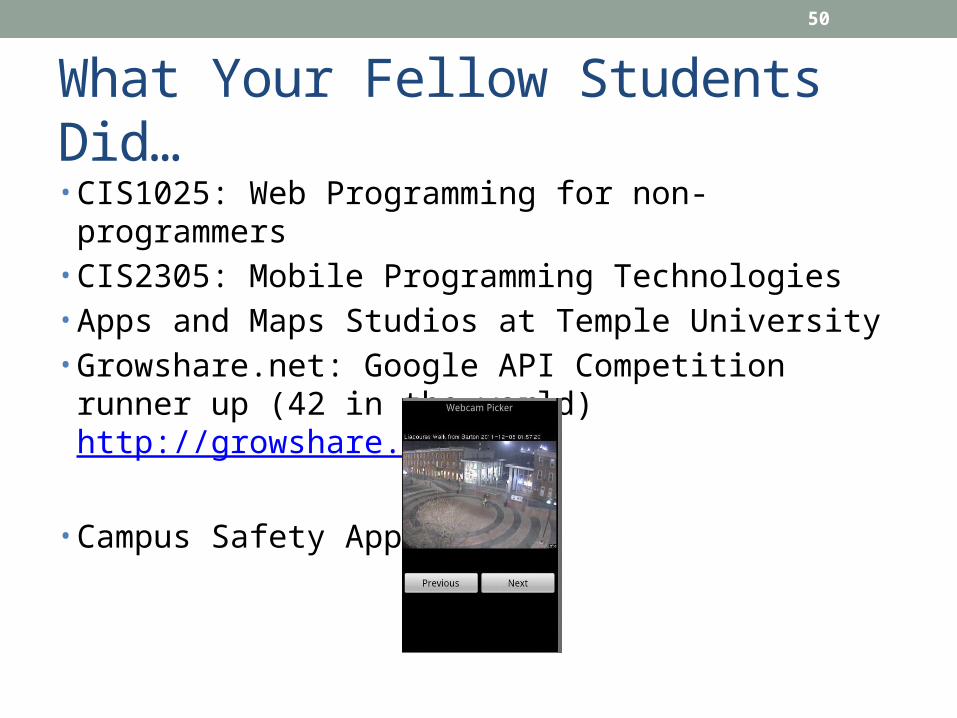
What Your Fellow Students Did…• CIS1025: Web Programming for non-programmers• CIS2305: Mobile Programming Technologies• Apps and Maps Studios at Temple University• Growshare.net: Google API Competition runner up (42 in
the world) http://growshare.net
• Campus Safety App:

51
Questions?


53Wireless Trends © Walt Davis 2011
Backup Slides

54Wireless Trends © Walt Davis 2011
Wireless Communications Trends
• Wireless Growth – SmartPhones and Beyond
• Wire-line and Wireless Traffic Growth
• 3G and 4G Technology – Approaching the Limits on Spectral Efficiency
• Capacity – the BIG Issue
55Wireless Trends © Walt Davis 2011
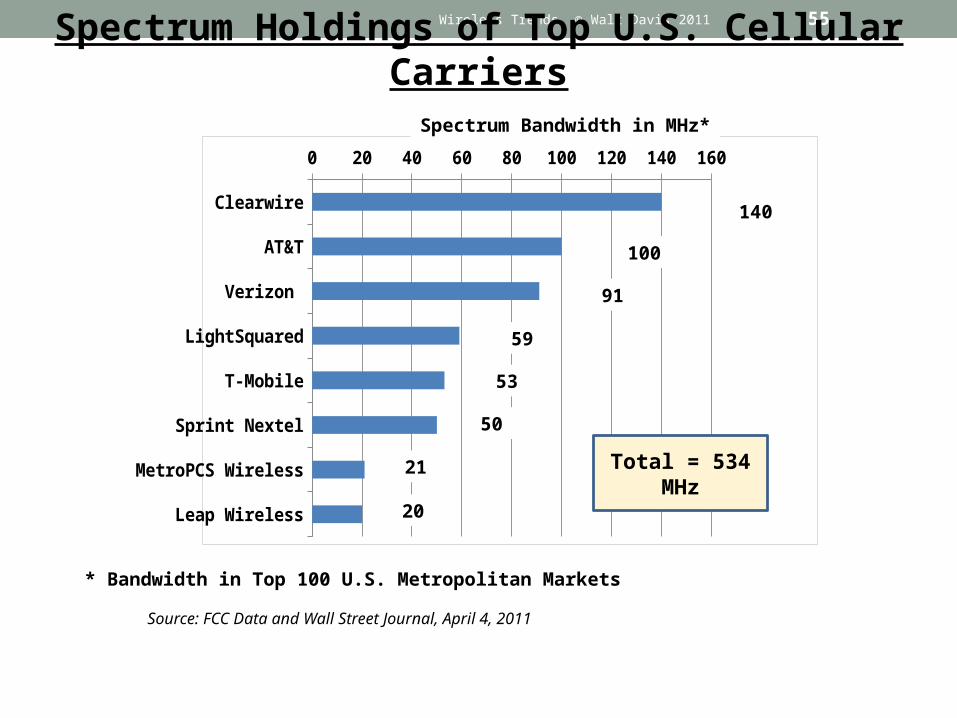
Clearwire
AT&T
Verizon
LightSquared
T-Mobile
Sprint Nextel
MetroPCS Wireless
Leap Wireless
0 20 40 60 80 100 120 140 160
140
100
91
59
53
50
21
20
Spectrum Bandwidth in MHz*
Spectrum Holdings of Top U.S. Cellular Carriers
Source: FCC Data and Wall Street Journal, April 4, 2011
* Bandwidth in Top 100 U.S. Metropolitan Markets
Total = 534 MHz
56Wireless Trends © Walt Davis 2011
Future Traffic?
• AT&T’s experience has shown that Cisco’s forecast for Cellular Data growth may be too conservative!
• Gartner has projected a 38% GAGR for Smartphones through 2015. Taken together with Cisco’s projection for 92% GAGR for cellular data traffic, increased usage by customers will drive a 54% increase.
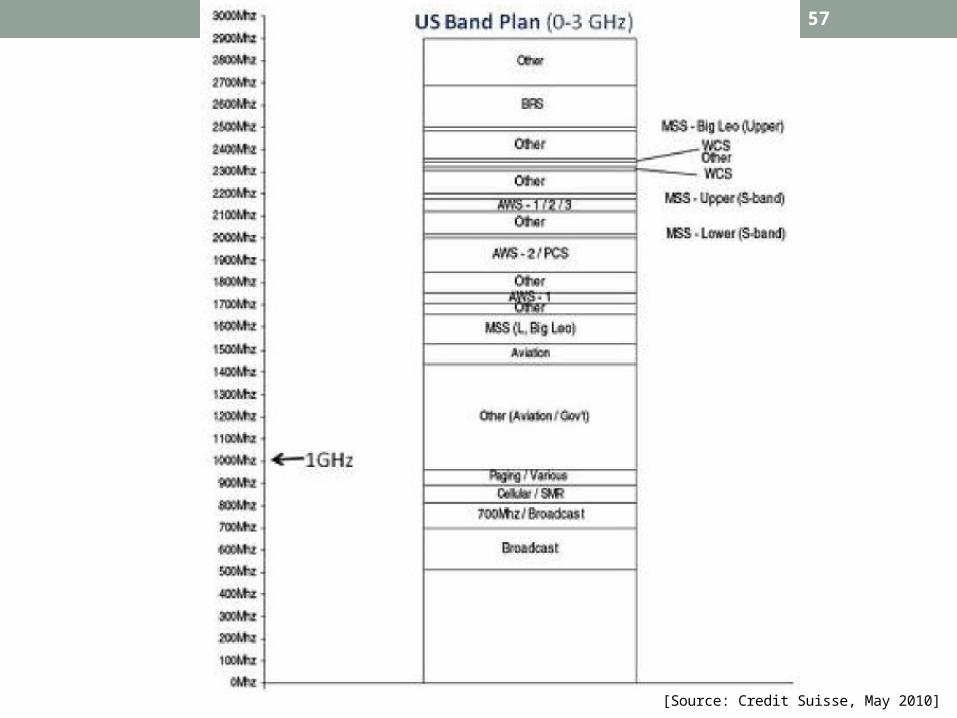
57Wireless Trends © Walt Davis 2011
[Source: Credit Suisse, May 2010]

58
Traffic Multiplying Effect of High-end Devices
Wireless Trends © Walt Davis 2011

59Wireless Trends © Walt Davis 2011
Source: “Digital Dividend: Potentials and Limitations of Mobile Broadband Access”, Helge Iliders and Peter Vary, Institute of Communication Systems and Data Processing , RWTH Aachen University, Germany, Published in Breitbandversorgung in Deutschland • 17. — 18. Marz 2010 in Berlin Paper 24
Shannon’s LimitLimits with MIMO
Spectral Efficiency is Close to Shannon’s Limit

60Wireless Trends © Walt Davis 2011
Source: “Digital Dividend: Potentials and Limitations of Mobile Broadband Access”, Helge Iliders and Peter Vary, Institute of Communication Systems and Data Processing , RWTH Aachen University, Germany, Published in Breitbandversorgung in Deutschland • 17. — 18. Marz 2010 in Berlin Paper 24
Shannon’s LimitLimits with MIMO
Spectral Efficiency is Close to Shannon’s Limit
Significant increases in Cellular Capacity will have to come from additional spectrum, and from spectrum
re-use - i.e., pico-cells.

61
Micro-Cellular Evolution
1GAnalog
AMPS
GSM
UMTS/HSPA
LTE/WiMAX
Cap
acity
Lim
ited
Cov
erag
e Li
mite
d
cover only Small # large macro cells outdoor
Larger # macro cells; Indoor coverage w/ more power;
Some micro in dense urban
Thin macro cell overlays Dense micro cell under lays
DAS for large buildings
Microcells for outdoor; DAS & Pico for enterprise; femto
for residential
Car phones Cell phones Smartphones Universal Personal Communicator
Technology requires large # of low cost
sites
Capacity is key
Economics favors small # of macro sites
Capacity is not an issue
Traffic/User
User Density
2GDigital TDM
3GDigital CDMA
4GDigital OFDM
Wireless Trends © Walt Davis 2011
62
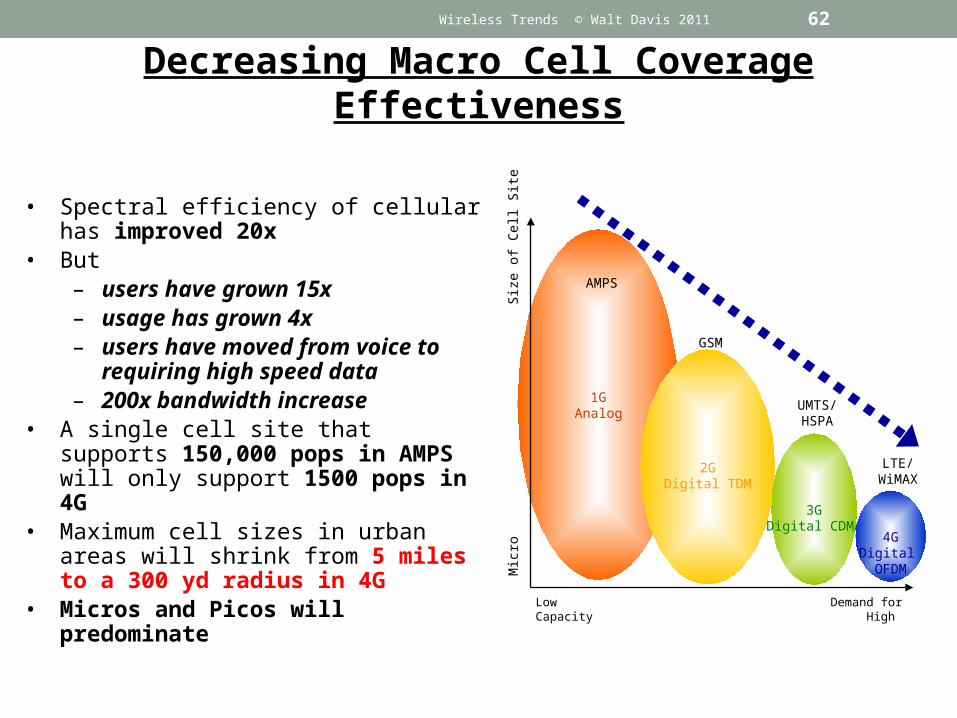
• Spectral efficiency of cellular has improved 20x
• But– users have grown 15x– usage has grown 4x– users have moved from voice to
requiring high speed data– 200x bandwidth increase
• A single cell site that supports 150,000 pops in AMPS will only support 1500 pops in 4G
• Maximum cell sizes in urban areas will shrink from 5 miles to a 300 yd radius in 4G
• Micros and Picos will predominate
1GAnalog
AMPS
Low Demand for Capacity High
2GDigital TDM
3GDigital CDMA
4GDigital OFDM
GSM
UMTS/HSPA
LTE/WiMAX
Mic
ro
Siz
e of
Cel
l Site
M
acro
Decreasing Macro Cell Coverage EffectivenessWireless Trends © Walt Davis 2011

63Wireless Trends © Walt Davis 2011
63
Long Term 3G Evolution
Fix
ed
Walk
Veh
icle
Mobility / Range
Indoor
Pedestrian
High Speed
VehicularRural
Personal Area
VehicularUrban
Fixed urban
User data rate
10 Mbps0.1
IEEE802.16a,d
1 100
HSDPA
IEEE802.16e
Nomadic
WLAN(IEEE 802.11x)
GSMGPRS
DECT
bluetooth
3G/WCDMA
EDGE
FlashOFDM (802.20)
Wireless Technology Positioning
Source: Stand und zukünftige attraktive Arbeitsgebiete für den Lehrstuhl für Kommunikationsnetze - Prof. Dr.-Ing. Bernhard Walke

64Wireless Trends © Walt Davis 2011
Source: Cisco VNI Mobile, 2011
Mobile Data Growth is Similar to Fixed Internet Growth
65Wireless Trends © Walt Davis 2011
Wireless Communications Trends
• Wireless Growth – SmartPhones and Beyond
• Wire-line and Wireless Traffic Growth
• 3G and 4G Technology – Approaching the Limits on Spectral Efficiency
• Capacity – the BIG Issue
66Wireless Trends © Walt Davis 2011
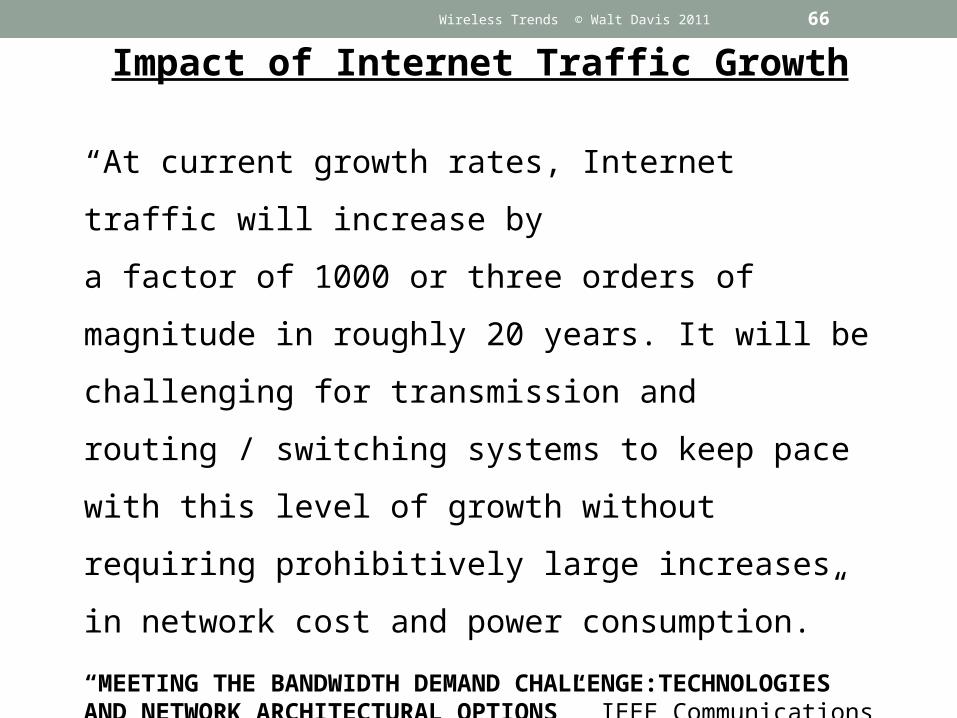
“At current growth rates, Internet traffic will increase by
a factor of 1000 or three orders of magnitude in roughly
20 years. It will be challenging for transmission and
routing / switching systems to keep pace with this level
of growth without requiring prohibitively large increases
in network cost and power consumption.”
“MEETING THE BANDWIDTH DEMAND CHALLENGE:TECHNOLOGIES AND NETWORK ARCHITECTURAL OPTIONS” IEEE Communications Magazine • January 2010 Editorial
Impact of Internet Traffic Growth
67Wireless Trends © Walt Davis 2011
Wireless Communications Trends
• Wireless Growth – SmartPhones and Beyond
• Wire-line and Wireless Traffic Growth
• 3G and 4G Technology – Approaching the Limits on Spectral Efficiency
• Capacity – the BIG Issue

68
Total Global Revenue: $906 billion (2010)
$203B
$59B
$68B
$54B
$203B
$52B$267B
Mobile Revenue By Region
Source: Mobile Voice and Data Forecast Pack: 2010–15 © OVUM 2010
Wireless Trends © Walt Davis 2011
69
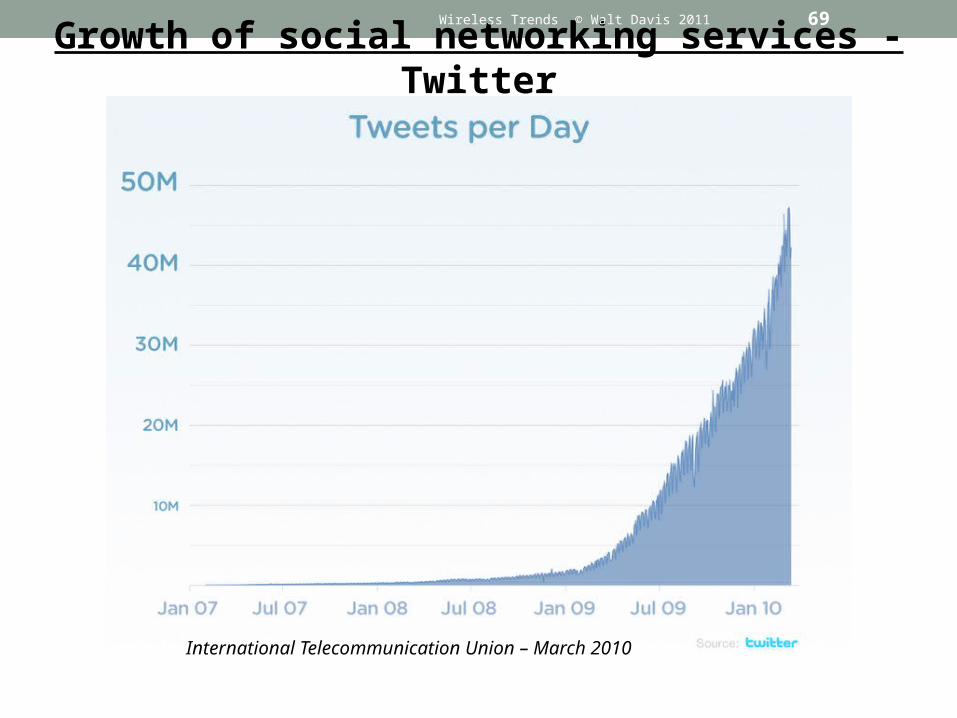
Growth of social networking services - TwitterWireless Trends © Walt Davis 2011
International Telecommunication Union – March 2010
70
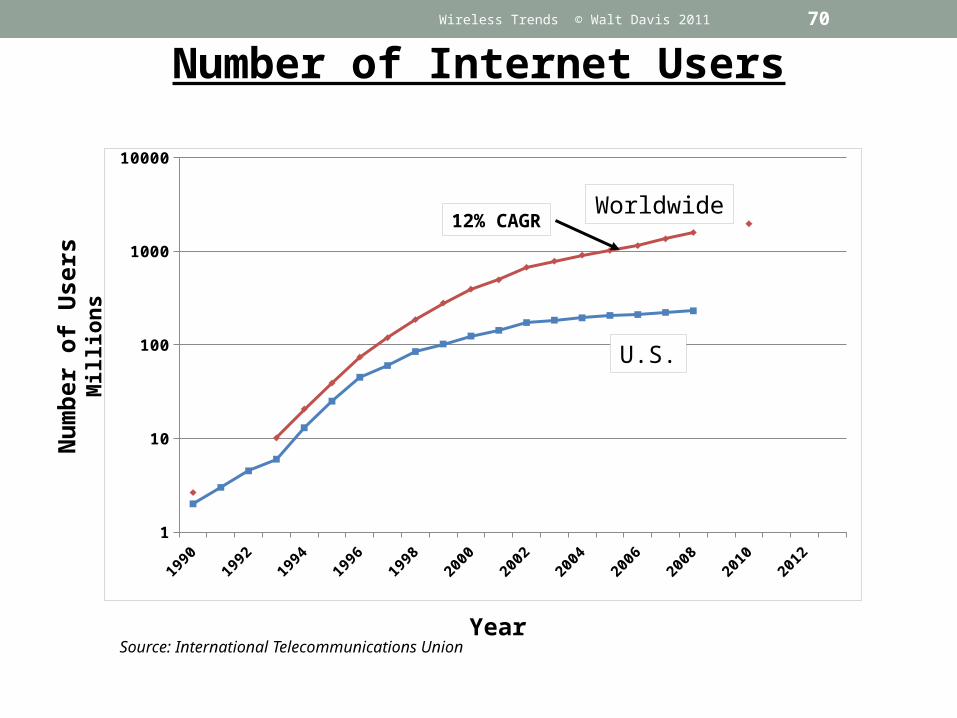
Number of Internet Users
1990
1991
1992
1993
1994
1995
1996
1997
1998
1999
2000
2001
2002
2003
2004
2005
2006
2007
2008
2009
2010
2011
2012
2013
1
10
100
1000
10000
Worldwide
U.S.
Year
Nu
mb
er o
f U
sers
Mill
ion
s
Source: International Telecommunications Union
Wireless Trends © Walt Davis 2011
12% CAGR

71
Growth of Mobile-only Internet Users
2010 2011 2012 2013 2014 201510
100
1,000
Nu
mb
er o
f U
sers
, Mill
ion
s
Year
Slope = 35X in 10 Years 143% per Year
GlobalUsers
Wireless Trends © Walt Davis 2011

72Wireless Trends © Walt Davis 2011
Strong growth in 3G telephony
5 bn total cellular subscribers, 1 bn mobile broadband subscribers in 2010.
6.5 bn total cellular mobile subscribers, of which 43% 3G in 2014.
Source: ITU (left); Morgan Stanley
Mobile subscribers (total & 3G) 2007-2014
3'4133'909
4'5875'024
5'567 5'8426'179 6'456
0
1'000
2'000
3'000
4'000
5'000
6'000
7'000
2007 2008 2009 2010 2011 2012 2013 2014
3G OtherGlobal Mobile BB Subscribers
15
11
8
5.6
0.51.7
3.2
-
100200
300
400
500600
700
800
2003 2004 2005 2006 2007 2008 2009
Mill
ion
s
0
24
6
8
1012
14
16
Mobile BB subscribers 3G % mobile
International Telecommunication Union – March 2010
73Wireless Trends © Walt Davis 2011
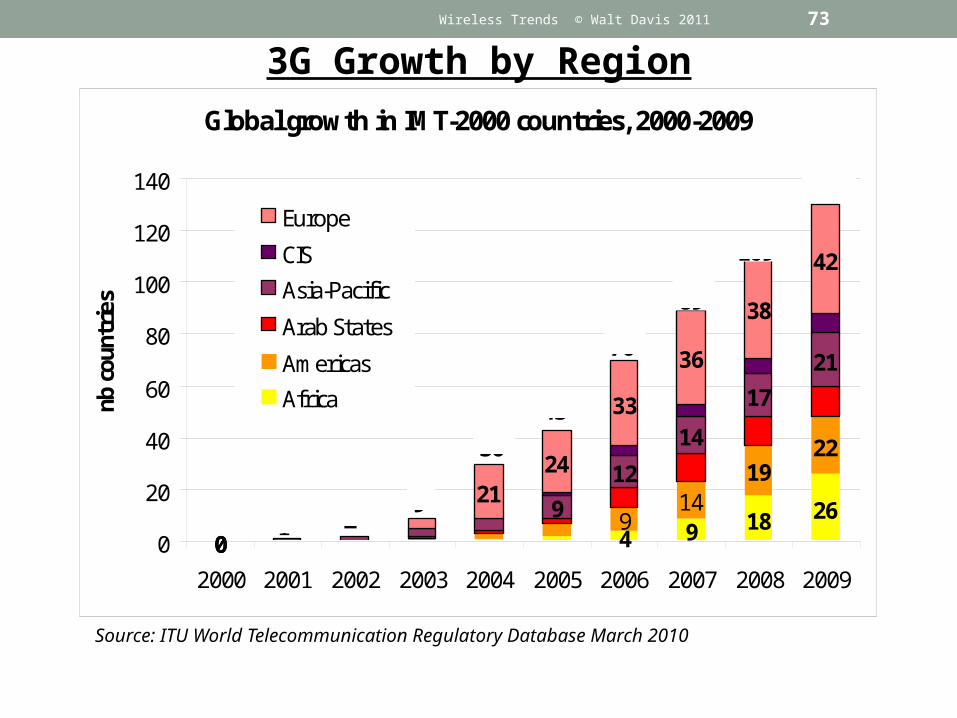
3G Growth by RegionGlobal growth in IMT-2000 countries, 2000-2009
4 9 18 26
1922
0
9
12
14
17
21
0
2124
33
36
38
42
149
00
20
40
60
80
100
120
140
2000 2001 2002 2003 2004 2005 2006 2007 2008 2009
nb c
ount
ries
Europe
CIS
Asia-Pacific
Arab States
Americas
Africa
219
3043
70
89
109
130
Source: ITU World Telecommunication Regulatory Database March 2010