1 measuring trafc on the wireless medium: experience and pitfalls
TRANSCRIPT

1
Measuring Traffic on the Wireless Medium: Experience and Pitfalls
Jihwang Yeo, Suman Banerjee, Ashok AgrawalaDepartment of Computer Science
University of MarylandCollege Park, MD 20742�
jyeo, suman, agrawala � @cs.umd.edu
CS-TR-4421 and UMIACS-TR-2002-101December 17, 2002
Abstract
A number of measurement studies have examined traffic characteristics in wireless networks. Most of thesemeasurements [1], [6], [7] have been conducted from the wired portion of the network. In this paper we arguethat such measurements are not sufficient to expose either the characteristics of the wireless medium or how suchcharacteristics impact traffic patterns. While it is easier to make consistent measurements in the wired part of anetwork, such measurements can not observe the significant vagaries present in the wireless medium itself. As aconsequence constructing an efficient and accurate measurement system from a wireless vantage point is importantbut usually quite difficult. In our work we have explored the various issues in implementing such a system to monitortraffic in an 802.11 based wireless network. We identify different challenges in making such measurements andprovide detailed experimental evidence in their supports.
Our work shows that the wireless measurement allows us to infer much richer information about the mediumcharacteristics than is possible with a measurements made on the wired part of the network. We apply our measurementtechnique to study the end-to-end wireless network delay. We show that wireless monitoring can effectively identifythe causes of end-to-end delays.
I. INTRODUCTION
With the popularity of 802.11 based wireless networks, it becomes increasingly important to understandthe characteristics of the wireless traffic and wireless medium itself. Such wireless networks use a wiredconnection also, which is typically used to connect the access points of the 802.11 network to the Internet,for example. A number of measurement studies [1], [6], [7], [3], [5] have examined traffic characteristicsin wireless networks. In these studies, the measurements have been conducted on the wired portion of thenetwork.
Measurements with a wired connection can provide accurate traffic statistics as seen in that portion ofthe network. However they are mostly unable to expose the wireless medium characteristics because theycannot see the actual frames on the air. In this paper we argue that traffic measurements from a wiredvantage point in the network are not sufficient to expose either the wireless medium characteristics or howsuch characteristics impact the traffic patterns.
In our study we examine the following two questions: Is it possible to make meaningful measurements ofthe wireless medium using a wireless measurement infrastructure? If this is possible, what are the pitfallsthat a wireless measurement system needs to be aware of so that the observations are consistent with the realworld wireless experience?
We have performed a detailed study over a period of three months in which we have observed the wirelesscharacteristics in the A.V. Williams building on the campus of the University of Maryland, which houses the
This work was supported in part by the Maryland Information and Network Dynamics (MIND) Laboratory, its Founding Partner Fujitsu Lab-oratories of America, and by the Department of Defense through a University of Maryland Institute for Advanced Computer Studies (UMIACS)contract.

2
Department of Computer Science. The network there is known to have a high load of wireless traffic. Ourobservations indicate that indeed such a wireless measurement based inference is possible. However, themeasurement process is significantly more challenging than when performed from a wired vantage point.At the same time, we notice that wireless measurements provide much richer information about the mediumcharacteristics than is possible with measurements on the wired connection. We discuss some of applicationsthat can exploit the information.
A. Advantages of Wireless Traffic MonitoringWireless monitoring (which we refer to in this paper as, “sniffing”) is useful to understand the traffic
characteristics in wireless network for the following reasons.A sniffing system can be easily set up and put into operation without any interference to existing infras-
tructure, including end-hosts or network routers. In fact sniffing can be performed without any interactionwith the existing network, and hence is completely independent of the operational network.
Another reason is that we can have more control over the geographical coverage of the measurement. Thesniffing devices theoretically can listen to any frames on the air within the range. Therefore we can tailorthe measurement coverage for our purpose by placing the sniffers over the proper area.
Most importantly, sniffing can provide the rich information on the wireless medium itself so that we caninfer the wireless medium characteristics. Such information consists of physical and link layer informationof each packet, which are not available if traffic monitoring is performed in the wired part of the network.Thus wireless sniffing allows the measurement system to examine physical layer header information includ-ing signal strength, noise level and data rate for individual packets. Similarly the link layer headers carryinformation which include 802.11 type and control fields [4].
Those physical and link layer data, collected by sniffers, can reveal more than overall traffic statistics inseveral ways.
First, 802.11 control and management frames, (for example beacons, RTS, CTS and ACKs) provide thelocal information of each network node as well as the global network status. Beacon frames are used forglobal clock synchronization by an AP. RTS/CTS and ACKs are exchanged for medium reservation andtransfer notification respectively [4].
Second, combined with timestamps the collected data can be used as good traces of 802.11 link-leveloperations. Such traces are useful when we want to emulate the protocol or diagnose problems of wirelessnetworks.
Third, sniffer traces can be used to detect the misbehaviors of some network nodes. With such traces, wecan check how well each node conforms to 802.11 protocol. If any misbehaving nodes are found, based onthe traces we can infer the clue to how to handle the problematic nodes.
B. Challenges of Wireless MonitoringThe advantages we mentioned above would not be meaningful, unless our sniffer can capture nearly all
the frames on the air. Unfortunately it is very difficult to guarantee that the sniffers can see 100% of wirelessframes. In fact it is even difficult to correctly estimate the number of packets different sniffers lose dueto differences in various wireless cards, drivers, and antennae characteristics. We go over this problem inSection III.
Losses in the sniffers poses the most challenging problem in wireless monitoring. There are severalcategories of losses, frame loss, type loss and AP loss. By frame loss we mean existence of such frames thatare present on the air at the time of a measurement, but are not detected by the sniffers. If we say a snifferhas type loss, we mean the sniffer is unable to capture specific types of packets inherently. Similarly AP lossof a sniffer means that the sniffer loses nearly all the frames originating from specific APs.
We have observed that typically most of these losses are due to signal strength variability, card variabilityor a combination of both. For example as signal condition becomes worse, a wireless sniffing device is moresusceptible to frame losses. Some specific card implementations do not allow ACK frames to be passed up

3
to user applications, and hence type loss results. AP loss sometimes occurs due to incompatibility betweenAP firmware and user card firmware.
In this work, we present the details on the observations of sniffer loss and its loss variability in Section III.We observe various kinds of losses and their variability in the sniffers during our experiments. While most ofour experiments perform passive measurements, we present some active experiment results to explain howsignal strength and card variability cause packet loss and end-to-end delay variability between the AP and awireless station in Section IV.
C. Key ContributionsIn this work we have extensively studied passive measurements of the wireless medium. We have used
a number of different measurement equipments which provide some interesting insights. We have repeatedthe same experiments with various setups and obtain the observations on sniffer loss and loss variability.Our findings can be summarized as follows:� Percentage of valid 802.11 frames that are not detected by the sniffing devices (which we call lost
frames) can increase up to 100% (Figure 1).� The frame losses on the traffic from stations towards APs have higher variability than those on the trafficfrom APs to stations (Figure 1).� Some cards with Intersil firmware show AP loss. The card is set to a specific channel, but cannot seethe frames from some APs on the same channel (Table II).� The cards with Lucent firmware, in the monitoring mode, have type loss on ACK/RTS/CTS frames(Table III).� Some sniffer cards and some APs show incompatibility, which leads to significant frame losses (Ta-ble IV).
We apply our passive measurement technique to infer the causes of end-to-end delays. We show twocases of abnormally high end-to-end wireless delays. Using our wireless measurement system we are ableto identify the causes to be signal strength and card variability.
II. METHODOLOGY
We perform our experiments in the A.V. Williams building, at the University of Maryland (where theDepartment of Computer Science is located). The building has 58 access points installed which belong tothree different networks, umd, cswireless and nist. umd network consists of 29 Cisco Aironet A-340 APs,which are set up by the Office of Information Technology of the University of Maryland. The umd networkis most frequently used by the wireless users. cswireless (12 Lucent AP’s) and nist (17 Prism2-based AP’s)are built by individual research groups in the Computer Science department.
We set up several sniffer machines to capture wireless frames on the air. All sniffing devices used Linuxoperating systems with kernel version 2.4.19. We used Ethereal (version 0.9.6) and libpcap library (version0.7) with the orinoco cs driver (version 0.11b) as sniffing software. We made use of the ’monitor mode’ ofthe card to capture the 802.11 header as well as physical layer header, called Prism2 monitor header.
A. Captured DataPrism monitor header is not a part of 802.11 frame header, but is generated by the firmware of the receiving
card. The header includes RSSI(Received Signal Strength Indication), SQ (Signal Quality), Signal strengthand Noise (in dBm) and Data rate (in Mbps).
IEEE 802.11 frame structure incorporates the following fields: protocol version, frame type (manage-ment, data and control), Duration for Network Allocation Vector (NAV) calculation, BSS Id, Source andDestination addresses, fragment, sequence number etc [4].
In this study we consider a frame to be ”From-AP”, if the frame is being transmitted by an AP to somewireless station. Sequence numbers in From-AP frames are generated by the source AP. Likewise ”To-AP”frames are being transmitted by a wireless station to some AP. To-AP sequence numbers are generated bythe source wireless station.

4
From-AP Loss To-AP Loss TotalCard # Distinct # Retrans # Loss % Loss # Distinct # Retrans # Loss % LossLinksys 26404 448 4098 13.44% 3176 269 66% 2.04% 12.34%Lucent 20211 412 2614 11.45% 3055 271 121% 3.81% 10.52%
TABLE IFRAME LOSS IS CALCULATED BY SEQUENCE NUMBERS. THE TRAFFIC USED IN CALCULATION ASSOCIATES WITH ONE AP.
III. PASSIVE OBSERVATIONS
A. Frame loss, AP loss and type lossIn order to estimate the frame losses we need to have an idea about the whole traffic. As we can not
guarantee that at any point we have such complete information about the traffic, we use the approach ofinferring the missed frames from the information we gather from the sequence numbers. Frame loss Number(# Loss) is the sum of all the gaps between any two adjacent sequence numbers.
In Table I, we calculate number of distinct frames (# Distinct), number of retransmissions (# Retrans) andframe loss number (# Loss) for two different wireless cards. As the maximum sequence number is 4095, weconsider the wrap-around to calculate a gap. Frame loss rate (% Loss) is calculated by
% Loss � # Loss ������# Distinct # Loss
(1)
In Table I From-AP loss rate is based on AP-generated sequence numbers, while To-AP loss rate iscalculated by summing up all the loss from all the wireless stations.
If the card cannot detect some packets from specific remote stations, this method of determining lossescan lead to incorrect result. For example, suppose a wireless card can correctly detect 100 frames from node1, without any loss, but cannot correctly detect any of the existent 100 frames from another node 2. Theframe loss rate is calculated to be 0% incorrectly by considering only node 1 frames. However the correctloss is 50% (100 frames are lost out of 200).
In this study we use basically sequence number technique in loss calculation. Therefore when compariar-ing two cards we confirm that the two cards have corectly detected the same set of wireless stations.
In Table II ”# Frames” indicates the number of captured frames that associate with a specific AP. ”Pct.”indicates its percentage among all the captured frames. Table II shows that Linksys card on channel 11 losesthe frames of AP4 and AP5, which are on the same channel as the card (an example of AP Loss. Note thatLinksys card also sees other channel AP (AP2 on 6).
In Table III, Lucent has Type Loss. Lucent loses the control frames of types ACK, RTS, CTS and Power-save. Actually, the receiving Lucent device captures the frames of such types but its firmware does not passthem up to sniffing software.
Both Table II and Table III are obtained from the same two day long experiment.
B. Loss variabilityIn Figure 1 frame loss rate varies between 0% and 100% during 4 day passive measurement experiment.
In this plot we observe that the To-AP traffic has more loss variability.In Table IV we group the traffic by the associated APs. Clearly frame losses vary depending on the card
used in sniffing device as well as the AP which is being monitored. As before, we see significant variabilitybetween the traffic observed by the the two wireless cards.

5
AP Linksys Lucent(essid,channel) # Frames Pct. # Frames Pct.AP1 (umd,11) 2583659 84.5% 2550568 41.3%AP2 (nist,6) 454630 14.9% 6391 0.1%AP3 (nist,11) 18579 0.6% 1172182 19.0%AP4 (umd,11) 0 0.0% 1320012 21.4%AP5 (nist,11) 11 0.0% 895638 14.5%
Other rows are omittedTotal 3058516 100.0% 6182077 100.0%
TABLE IINUMBER OF FRAMES ASSOCIATED WITH EACH AP: LINKSYS SNIFFER HAS AP LOSS ON AP4 AND AP5, WHICH ARE ON THE SAME
CHANNEL AS THE LINKSYS.
802.11 Linksys LucentFrame type # Frames Pct. # Frames Pct.Data 888082 25.9% 1318942 21.3%Beacon 2117923 61.9% 4712323 76.2%ACK 323674 9.5% 0 0.0%RTS 34729 1.0% 0 0.0%CTS 6734 0.2% 0 0.0%Probe 52447 1.5% 150796 2.4%Power-save 44 0.0% 0 0.0%
TABLE IIINUMBER OF FRAMES WITH EACH 802.11 TYPE: LUCENT SNIFFER HAS TYPE LOSS ON ACK/RTS/CTS/POWER-SAVE.
20
40
60
80
100
Saturday Sunday Monday Tuesday
Loss
rate
(%) o
f fra
mes
Time
Time vs. Loss rate(%) of frames Sep. 20 - Sep. 24
From-APTo-AP
Fig. 1. Loss varies up to 100% over time: To-AP traffic is more variable than From-AP traffic. All the traffic associates with one AP.

6
From-AP Loss To-AP LossAP(essid, Ch.) Card # Distinct # Retrans # Loss % Loss # Distinct # Retrans # Loss % LossAP1(umd,6) Linksys 4675 41 2 0.04% 210 9 16 7.08%
Lucent 4656 41 17 0.36% 223 13 4 1.76%AP2(nist,1) Linksys 3085 17 78 2.47% 0 0 0 0.00%
Lucent 1 0 0 0.00% 0 0 0 0.00%AP3(cs,6) Linksys 694 3 2414 77.67% 0 0 0 0.00%
Lucent 2840 14 300 9.55% 0 0 0 0.00%AP4(umd,6) Linksys 4737 37 110 2.27% 249 9 114 31.40%
Lucent 4701 38 144 2.97% 381 14 79 17.17%
TABLE IVFRAME LOSS VARIES OVER THE CARD AND THE ASSOCIATED AP: ALL THE TRAFFICS ARE MEASURED IN THE SAME EXPERIMENT.
CARD VARIABILITY AFFECTS FRAME LOSS.
IV. APPLICATION: DIAGNOSIS ON END-TO-END DELAY
A. Active Experiment SetupFor diagnosis of wireless network delay, we conduct two-way UDP packet exchange experiments using
NetDyn tool [2]. Source wireless station sends 20000 packets with the full payloads (1472 bytes for UDP)to a wired server (called echo). Source also acts as a sink machine to receive the packets back from echo.The Source node puts a sequence number and a time stamp in the payload. Echo node also puts a sequencenumber and a time stamp before forwarding the packet to the Sink node which puts a receive time stamp.Our sniffing devices capture the wireless frames between the source/sink wireless station and the accesspoint.
Therefore, using NetDyn tool and the sniffers we have three NetDyn-generated timestamps (by source,echo and sink) and two sniffer-captured wireless traces (From-AP and To-AP) of all the successfully return-ing packets.
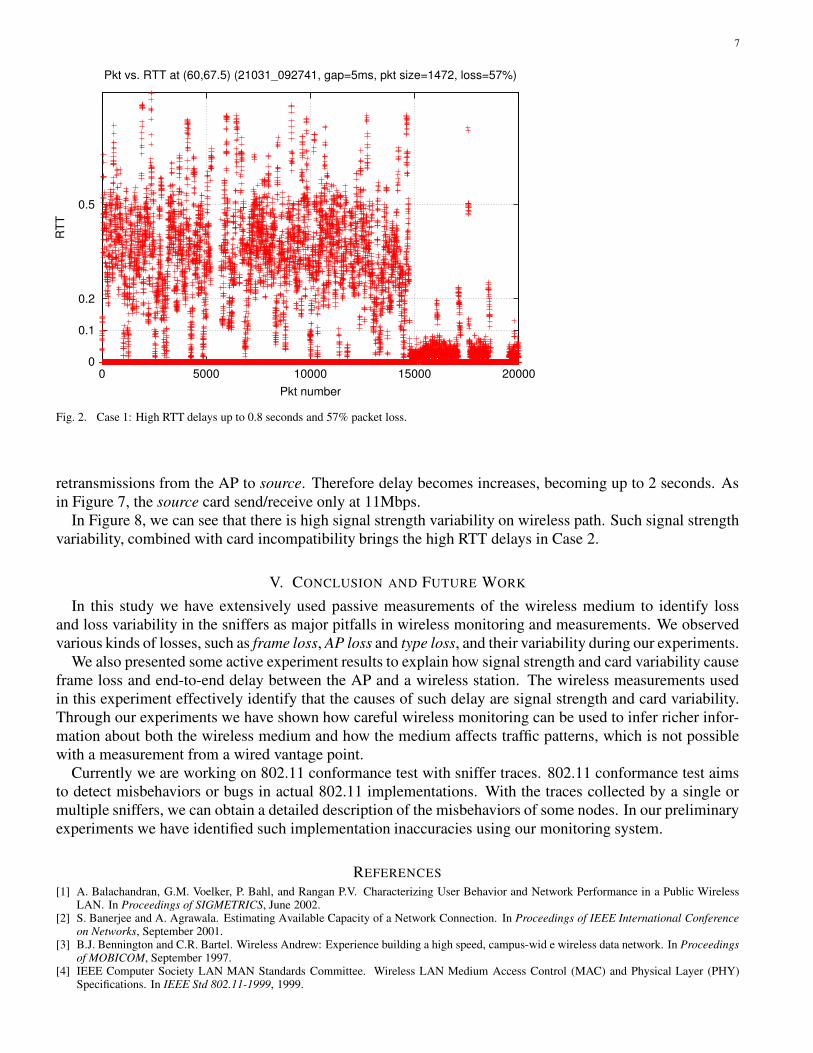
B. Delay AnalysisWe present two high RTT (Roundtrip Time) delay cases where we place the source machine at different
locations. We then analyze the two cases using our sniffer traces. Figure 2 and Figure 3 show RTT graphs ofCase 1 and Case 2 respectively, which are measured by subtracting source timestamp from sink timestamp.
In Case 1, there exist high RTT delays up to 0.8 seconds and 57% packet loss. Case 2 is the case in whichRTT delays are as high as 2.3 seconds and 75% of packets are lost. Note that in this section by packet losswe mean the loss experienced by the application in wireless station, while we mentioned the frame loss inthe sniffers in the previous section.
To infer the causes of Case 1 delay we depict source, echo and sink timestamps and From-AP, To-APtimestamps in Figure 4. We can see that most delays occur between source and echo periodically. There areno such high delays on returning path, between echo, sniffers and sink. In the sniffer trace we find manyretransmissions from source to the AP. We can conclude that weak signal strength causes many retransmis-sions, which leads to losses and delays in source machine’s sending buffer.
In Case 2 the situation is more complex. From the timestamps and traces (as in Figure 5 and Figure 6)we see that most delays reside on wireless From-AP (returning) path. To infer the causes of the wirelessdelay we use physical layer information available in the sniffer trace. We find that From-AP data rate wasconsistently varied with the changing signal conditions as [8] proposes. If the AP does not receive ACKfrom the source at 11 Mbps, then the AP retries to send the packets at lower data rate (5.5 or 2 Mbps). But,due to the card incompatibility, the source card fails to receive the packets at the lower data rate, and incurs
7
0
0.1
0.2
0.5
0 5000 10000 15000 20000
RTT
Pkt number
Pkt vs. RTT at (60,67.5) (21031_092741, gap=5ms, pkt size=1472, loss=57%)
Fig. 2. Case 1: High RTT delays up to 0.8 seconds and 57% packet loss.
retransmissions from the AP to source. Therefore delay becomes increases, becoming up to 2 seconds. Asin Figure 7, the source card send/receive only at 11Mbps.
In Figure 8, we can see that there is high signal strength variability on wireless path. Such signal strengthvariability, combined with card incompatibility brings the high RTT delays in Case 2.
V. CONCLUSION AND FUTURE WORK
In this study we have extensively used passive measurements of the wireless medium to identify lossand loss variability in the sniffers as major pitfalls in wireless monitoring and measurements. We observedvarious kinds of losses, such as frame loss, AP loss and type loss, and their variability during our experiments.
We also presented some active experiment results to explain how signal strength and card variability causeframe loss and end-to-end delay between the AP and a wireless station. The wireless measurements usedin this experiment effectively identify that the causes of such delay are signal strength and card variability.Through our experiments we have shown how careful wireless monitoring can be used to infer richer infor-mation about both the wireless medium and how the medium affects traffic patterns, which is not possiblewith a measurement from a wired vantage point.
Currently we are working on 802.11 conformance test with sniffer traces. 802.11 conformance test aimsto detect misbehaviors or bugs in actual 802.11 implementations. With the traces collected by a single ormultiple sniffers, we can obtain a detailed description of the misbehaviors of some nodes. In our preliminaryexperiments we have identified such implementation inaccuracies using our monitoring system.
REFERENCES[1] A. Balachandran, G.M. Voelker, P. Bahl, and Rangan P.V. Characterizing User Behavior and Network Performance in a Public Wireless
LAN. In Proceedings of SIGMETRICS, June 2002.[2] S. Banerjee and A. Agrawala. Estimating Available Capacity of a Network Connection. In Proceedings of IEEE International Conference
on Networks, September 2001.[3] B.J. Bennington and C.R. Bartel. Wireless Andrew: Experience building a high speed, campus-wid e wireless data network. In Proceedings
of MOBICOM, September 1997.[4] IEEE Computer Society LAN MAN Standards Committee. Wireless LAN Medium Access Control (MAC) and Physical Layer (PHY)
Specifications. In IEEE Std 802.11-1999, 1999.

8
00.10.2
0.5
1
2
0 5000 10000 15000 20000
RTT
Pkt number
Pkt vs. RTT at (60, 0) (021031_011754, gap=5ms, pkt size=1472, loss=75%)
Fig. 3. Case 2: High RTT delays up to 2.3 seconds and 75% packet loss.
0
100
200
300
400
500
600
700
800
900
1000
0 2 4 6 8 10
Pkt
num
ber
Time
Time vs. Pkt number at (60, 67.5) (021031_092741, gap=5ms, pkt size=1472, loss=57%)
sourceechosink
TO_APFROM_AP
Fig. 4. Case 1: Source, echo, sink timestamps (by NetDyn), From-AP, To-AP timestamps (by sniffers). Delays exist between source and echoevery 0.5 second periodically. No high delays exist on wireless path.

9
0
100
200
300
400
500
600
700
800
900
1000
1100
1200
1300
1400
0 2 4 6 8 10
Pkt
num
ber
Time
Time vs. Pkt number at (60, 0) (021031_011754, gap=5ms, pkt size=1472, loss=75%)
sourceechosink
Fig. 5. Case 2: Source, echo, sink timestamps. Delays exist between echo and sink.
0
100
200
300
400
500
600
700
800
900
1000
1100
1200
1300
1400
0 2 4 6 8 10
Pkt
num
ber
Time
Time vs. Pkt number at (60, 0) (021031_011754, all_sniffers, gap=5ms, pkt size=1472, loss=75%)
TO_APFROM_AP
Fig. 6. Case 2: To-AP/From-AP traffic is captured by the sniffers. Delays reside on wired echo-AP path or wireless AP-sink path.

10
12
5.5
11
12
5.5
11
4
Dat
a ra
te
Time
Time vs. Data rate at (60, 0) (021031_011754, zapp_prism2, gap=5ms, pkt size=1472, loss=75%)
TO_APFROM_AP
Fig. 7. Case 2: AP varies data rates at 11, 5.5 and 2 Mbps (From-AP data rate, graph on top). Source cannot synchronize with the AP,send/receive packets only at 11Mbps (To-AP data rate, graph at bottom).
0
20
40
60
80
100
0 20 40 60 80 100 120 140
Sig
nal s
treng
th
Time
Time vs. Signal strength at (60, 0) (021031_011754, gap=5ms, pkt size=1472, loss=75%)
sniffer
Fig. 8. Case 2: High variability in signal strength is observed by sniffers, which causes AP to shift data rate adaptively.

11
[5] D. Eckardt and P. Steenkiste. Measurement and Analysis of the Error Characteristics of an In-Building Wireless Network. In Proceedingsof SIGCOMM, August 1996.
[6] D. Kotz and K. Essien. Analysis of a Campus-wide Wireless Network. In Proceedings of MOBICOM, September 2002.[7] D. Tang and M. Baker. Analysis of a Local-Area Wireless Network. In Proceedings of MOBICOM, August 2000.[8] J.C. Wu, H. Liu, and Y. Lung. An Adaptive Multirate IEEE 802.11 Wireless LAN. In Proceedings of the � ����� International Conference on
Information Networking, January 2001.