1 it industry performance: mid-year review 2002-03 press conference new delhi: january 10, 2003
TRANSCRIPT

1
IT Industry Performance: IT Industry Performance: Mid-Year Review 2002-03Mid-Year Review 2002-03
Press ConferenceNew Delhi: January 10, 2003

Eleventh in the Itops series of end-user surveys on IT hardware
since 1996-97
With this : Six year time series database
Annual trend for 6 consecutive years
Half-yearly trend for 9 consecutive periods
IItopstops 2002 pro28 2002 pro28

3
Uniform methodology since 96-97 to facilitate comparison
Nearly 14,000 face-to-face interviews conducted in this round
Study represents ‘All India Urban Market’
Sample allocation and universe projections extremely reliable
and robust
IItopstops 2002 pro 2002 pro CoverageCoverage

4
IItopstops 2002 pro 2002 pro Target groupTarget group
Establishment having at least one telephone line. 8000+ establishments covered Establishments classified as per ACE (Principal activity
performed at the establishment classified by number of employee) grid for representative sampling
Activities: • Manufacturing/ factory/ Warehouse• Office• Outlets• Government
Number of employees:• Less than 10 employees (Small establishments)• 10-50 (Medium establishments)• 50 + (Large establishments)
Most robust way to project establishment information to the universe

5
IItopstops 2002 pro 2002 pro Target groupTarget group
Household – SEC A/ B (refer shaded portion in the grid below Up market 6000+ households covered
ILLITE-RATE
SCHOOL SCHOOL SSC/ HSC SOME COLLEGE BUT NOT
GRAD
GRAD/ POST GRAD
GRAD/ POST GRAD
UPTO 4 YRS
5-9 YRS (GEN) (PROF)
UNSKILLED WORKER 8 8 7 6 6 6 6SKILLED WORKER 8 7 6 5 5 4 4PETTY TRADERS 8 6 6 5 5 4 4SHOP OWNERS 6 6 5 4 3 2 2BUSINESSMEN/ INDUSTRIALISTS EMPLOYING
0 EMPLOYEES 6 5 4 3 2 2 11- 10 EMPLOYEES 5 4 4 3 2 2 1
MORE THAN 10 EMPLOYEES 3 3 2 2 1 1 1SELF-EMPLOYEDPROFESSIONALSCLERICAL/SALESMEN 6 6 6 5 4 3 3SUPERVISOR LEVEL 6 6 5 5 4 3 2OFFICERS/ EXECUTIVES
- JUNIOR 5 5 5 4 3 2 2- MIDDLE/SENIOR 3 3 3 3 2 1 1
6 6 16 4 3 2

6
Data collected after ‘last mile’ - From location of installation No undercounting/over counting of goods in transit as in shipment data Includes direct imports by customers Validation of the estimates based on Vendor data
Accurate assessment of ‘who’ bought and ‘where’ used Not dependent on ‘perceptions’ of reseller/channel member/vendor
Emerging segments clearly identified as they ‘emerge’ Acceptance of technology products depends on customers
preparedness to accept them and innovative marketing by Vendors. Thus need to monitor customer end-user perspective and obtain cues
for innovative marketing ITOPS meets this need by providing “Proactive” Market tracking rather
than ‘reactive’ Estimates most reliable and accurate as no vested interest to distort
figures Inputs from demand and supply side considered for final estimates No vendor controversy
What is unique about the What is unique about the IItopstops study design?study design?

66½½ year time series database-how does it help? year time series database-how does it help?
Validating figures through past trends Forecasting accuracy
Identifying emerging trends
PC Sales projections vs. achieved AccuracyH2 99-00 99%Annual 99-00 97%H1 00-01 98%Annual 00-01 108%H2 01-00 102%Annual 01-02 101%

8
IItopstops: Comprehensive coverage: Comprehensive coverage
Product coverage:
Computers - Desktop PC, notebooks, servers
Printers - DMP, IJP, LJP
Peripherals - Monitors, keyboard, scanner,
zip drive, CD writer, Print server
UPS - UPS, battery
Networking - Incidence, size of networking (no. of nodes)
Networking prod - NIC, hubs
Internet - Active internet subscribers, modems

9
And the findings are …And the findings are …

10
PC Shipments: Half-yearly ComparisonPC Shipments: Half-yearly Comparison
834,650
1,046,995
803,055867,820
950,855
0
200,000
400,000
600,000
800,000
1,000,000
1,200,000
April-Sept00
Oct.00-Mar01
April-Sept.01
Oct.01-Mar02
April-Sept.02
• 18% growth over H1/2001-02
• 10% growth in sales over H2/2001-02
Uni
ts

11
PC Shipments: 1997-2003PC Shipments: 1997-2003
799,058
1,027,190
1,405,290
1,881,640
1,670,880
2,010,000
0
400,000
800,000
1,200,000
1,600,000
2,000,000
2,400,000
1997-98 1998-99 1999-00 2000-01 2001-02 2002-03*
• Expected Annual Growth over 2001-02: 20%
Uni
ts
*Estimated

12
PC Shipments Half-yearly Trend:PC Shipments Half-yearly Trend: Businesses Vs. Households Businesses Vs. Households
628,565 671,654777,995
196,167172,860
827,950
219,040
174,490
0
400000
800000
1200000
Oct.00-Mar.01
April-Sept.01 Oct.01-Mar02 April-Sept.02
Businesses Households
• Business Sector accounted for major proportion - 82% of the market
• Consumption in Businesses increased by 24% and households declined by 1% over H1/2001-02
• Consumption in Businesses improved by 16% and in households decreased by 11% over H2/2001-02
Uni
ts

13
Half-yearly PC Shipments : EnterprisesHalf-yearly PC Shipments : Enterprises
20 25 20 26
2727
2327
53 4857
47
0%
20%
40%
60%
80%
100%
Oct.00-March01
April-Sept.01 Oct.01-March02
April-Sept.02
Small Medium Large
• Larger Businesses continued to contribute maximum sales: 47% but proportion dropped from 48% in H1/2001-02 and from 57% in H2/2001-02
• Sales to Small enterprises registered the maximum growth; 29% over H1/2001-02 and 51% over H2/2001-02
• Sales to Larger Businesses improved by 21% while in Medium it improved by 24% over H1/2001-02
% U
nits

14
PC Shipments by Configuration PC Shipments by Configuration
• P-4 dominated the market with 51% market share followed by P III with 36%
• AMD/Cyrix etc. making their presence felt; Market share: 10%
Oct 01-Mar 02
Apr 02- Sep 02
Total PCs bought 803,057 867,821 950,885
Pentium 4 1.5 – 2 GHz
Pentium 4 upto 1.5 Ghz 30%
Pentium III 550 MHz and above 47% 45% 24%
Pentium III upto 450/ 500 MHz 7% 11% 12%
Pentium II 300/350 MHz and above 5% 4% 2%
2% 1% 1%
Pentium /Pentium Pro - -
Cyrix / AMD/Others/ not specified 21% 11% 10%
Apr 01-Sep 01
Configuration:
Pentium II 200/233/266 MHz /MMX
10%
10% -
-
28%
21%

15
20%
36%
44%
Indian Brands MNC brands
Assembled
H1/2001-02
• Assembled PC market share increased to 48% from 44%
• Share of MNC Brands decreased from 36% to 30%
22%
30%
48%
Indian Brands MNC brands
Assembled
H1/2002-03
The PC Market: Indian, MNC & Assembled The PC Market: Indian, MNC & Assembled

16
Half-Yearly: Share of Indian, MNC & Assembled Half-Yearly: Share of Indian, MNC & Assembled
• Share of Indian Brands increased to 22% in H1/2002-03 from 18% in H2/2001-02
• MNC brands shared dipped 4% but remains significant over H2/2001-02
• Assembled PC market share remained constant, but sales grew by 11%
17 23 20 22
2429 36 30
5948 44 48
1819
3423
4858
0
20
40
60
80
100
Oct 99-Mar 00
Apr 00-Sep 00
Oct 00-Mar 01
Apr 01-Sep 01
Oct 01-Mar02
Apr 02-Sep 02
Indian MNC Assembled
Mar
ket
sha
re
(%)

17
PC Shipments: The City-spreadPC Shipments: The City-spread
61%53% 59% 53%
20%
13%16%
11%
19%35%
25%36%
0%
20%
40%
60%
80%
100%
Oct.00-Mar.01 April-Sept.01 Oct.01-Mar.02 April-Sept.02
Top 4 Next 4 Others
• Market concentrated in Top 4 cities but proportion dropped significantly over H2/2001-02, however sales dropped by only 1%
• Proportion of ‘Next Four’ fell sharply to 11% from 16% (H2/2001-02) with sales dropping 27%
• Robust consumption growth in smaller towns: 30% over H1/2001-02 and 56% over H2/2001-02

18
Enterprises PC Market: The City-spreadEnterprises PC Market: The City-spread
75%59% 61%
53%
18%
8% 12%9%
6%
33% 27%38%
0%
20%
40%
60%
80%
100%
Oct.00-Mar.01 April-Sept.01 Oct.01-Mar.02 April-Sept.02
Top 4 Next 4 Others
• Overall Establishment/Business market grew by 24% over H1/2001-02; and 16% over H2/2001-02
• Market concentrated in Top 4 cities; while proportion dropped over H2/2001-02, the consumption remained constant
• Proportion of ‘Next Four’ cities fell sharply from 12% in H2/2001-02 to 9%
• Proportion of Smaller towns increased significantly to 38% marking a 63% increase in consumption over H2/2001-02

19
Profile of PC buyers: First time Vs. Repeat Profile of PC buyers: First time Vs. Repeat
68% 61% 71% 67%
32% 39% 29% 33%
0%
20%
40%
60%
80%
100%
Oct.00-Mar.01
April-Sept.01
Oct.01-Mar.02
April-Sept.02
First Time buyer Repeat buyer
• First time buyers accounted for 51% of PC sales
• In the business segment, repeat buyers accounted for 59% of sales while in
households first time buyer accounted for 88% of sales
% B
uyer
s

20
Profile of Household PC buyers:Profile of Household PC buyers:Socio Economic ClassificationSocio Economic Classification
71% 62% 57% 48%
39%
28% 38%44%
10% 5% 8%
0%
20%
40%
60%
80%
100%
Oct.00-Mar.01
April-Sept.01
Oct.01-Mar.02
April-Sept.02
SEC C
SEC B
SEC A
% buyers
• Sales to SEC A declined by 23% over H1/2001-02 and by 26% over H2/2001-02
• Sales to SEC B increased by 56% over H1/2001-02 and by over 2% H2/2001-02
• Gradual penetration into SEC C: accounted for 8% of the total households

21
Half-yearly Note book ShipmentsHalf-yearly Note book Shipments
Uni
ts
• Growth declined by 5% over H1/2001-02 and by 14% over H2/2001-02
• Top 4 cities accounted for 70% of sales
• Share of smaller towns increased to 23% from 9% in H1/2001-2 and 8% in H2/2001-02 growing 139% and 137% respectively.
33,660
21,17023,570
20,199
0
5,000
10,000
15,000
20,000
25,000
30,000
35,000
Oct. 00-Mar.01 April-Sept.00 Oct. 01-Mar.02 April-Sept.02

22
Notebooks Enterprise Market: Half yearlyNotebooks Enterprise Market: Half yearly
18%27% 25% 26%
26%26% 33% 23%
56%47% 41% 51%
0%
20%
40%
60%
80%
100%
Oct00-Mar.01
April-Sept.01
Oct.01-Mar.02
April-Sept.02
Large
Medium
Small
% U
nits
• Notebook sales remained concentrated in Large businesses; sales grew by 5% over H1/2001-02 and by 8% over H2/2001-02
• Consumption in small and medium enterprises recorded negative growth: (-)10% in small and (-)15% in medium over H1/2001-02

23
Half-yearly Market: ServersHalf-yearly Market: Servers
35,470
27,00723,874
28,046
0
5,000
10,000
15,000
20,000
25,000
30,000
35,000
40,000
Oct.00-Mar.01 April-Sept.01 Oct.01-Mar.02 April-Sept.01
• Server sales grew by 4% over H1/2001-02 and by 17% over H2/2001-02
• Top 4 cities accounted for 89% of sales growing 64% over H2/2001-02
• Sales to smaller and medium businesses grew by 87% and 53% over H1/2001-02 respectively; however consumption in larger businesses dropped by 44%
• Small enterprises accounted for 35% of the sales while medium and large accounted for 34% and 31% respectively.
Uni
ts
24
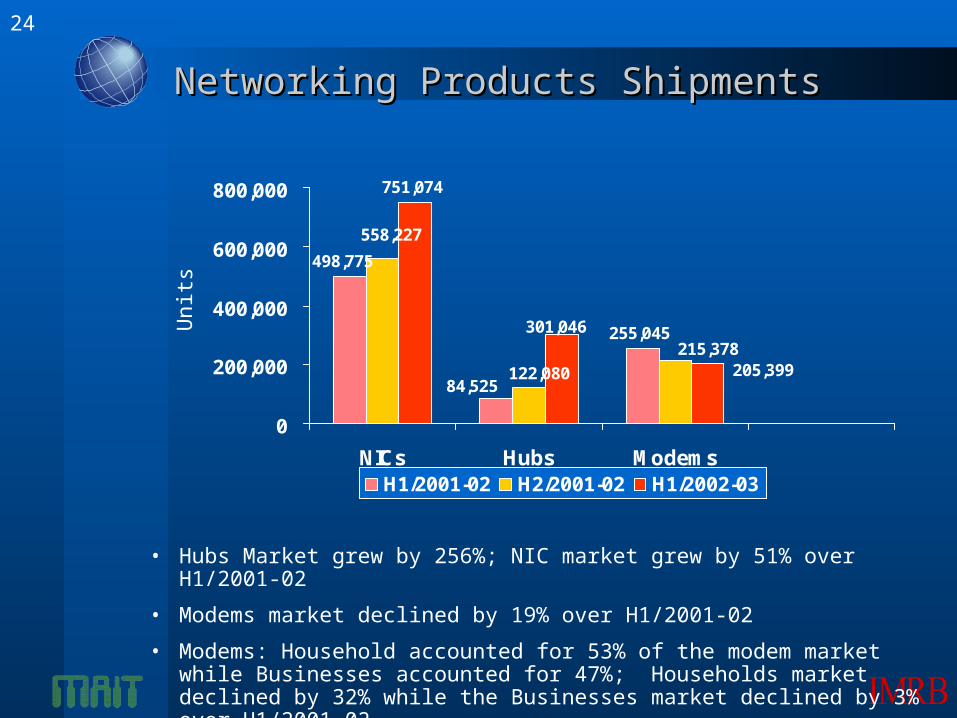
Networking Products ShipmentsNetworking Products Shipments
751,074
498,775
84,525
255,045
558,227
215,378
122,080 205,399
301,046
0
200,000
400,000
600,000
800,000
NICs Hubs Modems
H1/2001-02 H2/2001-02 H1/2002-03
• Hubs Market grew by 256%; NIC market grew by 51% over H1/2001-02
• Modems market declined by 19% over H1/2001-02
• Modems: Household accounted for 53% of the modem market while Businesses accounted for 47%; Households market declined by 32% while the Businesses market declined by 3% over H1/2001-02
Uni
ts

25
Printers - DMP Vs. Inkjet Vs. Laser Printers - DMP Vs. Inkjet Vs. Laser
163,300 157,206189,202
144,330
34,651
42,927
272,883
207,112
221,620
192,601
26,33038,020
0
100,000
200,000
300,000
400,000
500,000
Oct.00-Mar.01
April-Sept.01
Oct.01-Mar.02
April-Sept.02
Inkjet printer
Laser printer
Dot MatrixPrinter
• Total Printer sales declined by 3% over H1/2001-02 and by 15% over H2/2001-02
• Sales of Dot-Matrix declined by 8%; and Inkjet by 7% over H1/2001-02; Sales of Laser printers grew by 63%
• Sales of Inkjet printers grew 33% in the Business Segment but declined 42% in the Households sector as compared to H1/2001-02; while that of Dot-Matrix in Business segment declined by 4% and by 36% in Households
Uni
ts474,206
390,650
445,473
379,858

26
Printers - Where are we headed ?Printers - Where are we headed ?
46% 47% 39%51%
38%
9%
11%
43% 42%52%
40%51%
11% 11%9%
0%
20%
40%
60%
80%
100%
1998-99 1999-2000
2000-01 2001-02 2002-03
Inkjet Printer
Laser Printer
Dot MatrixPrinter
• 2002-03: Overall Printers sales expected to remain flat
* Estimated
477,305%
Uni
ts844,000590,335 827,820
*
836,122

27
UPS Shipments: Half-yearly trendUPS Shipments: Half-yearly trend
• Sales grew by 26% over H1/2001-02
• Businesses accounted for 66% and Households for the rest 34% of Market
• Top 4 cities accounted for 56% with consumption growing 65% over H1/2001-02
• Overall consumption in the Business segment grew by 132%; while in Large Businesses it grew by 276%
• Consumption in Households declined by 34%
Uni
ts202,208
176,098
199,359221,227
0
50,000
100,000
150,000
200,000
250,000
Oct.00-Mar.01 April-Sept.01 Oct.01-Mar.02 April-Sept.02

28
Other peripherals SalesOther peripherals Sales
837,431 834,031
870,450869,073
977145975310
600,000
800,000
1,000,000
Keyboards Monitors
April - Sept.01 Oct.01-Mar.02 April - Sept.02U
nits
• Keyboards and Monitors have grown by 16% and 17% respectively over H1/2001-02

29
58%31%
10%0%
1%
14" 15" 17" 20" 21"
Monitor Market by Size Monitor Market by Size
• 14” & 15” continued to dominate the market
• Market share of 17” increased marginally, but sales grew by 32%
Units: 834,031
April -Sept.2001
46%
41%
11%
2%
0%
14" 15" 17" 20" 21"
Units: 977,154
April -Sept.2002

30
Active Internet entities: 1998 - 2002Active Internet entities: 1998 - 2002
92%83%
64%51% 45% 48%
8%17%
36%49% 55% 52%
0%
25%
50%
75%
100%
1997 1998 1999 2000 2001 2002
Home
Business
March 98 March 99 March2000 March 2001 March 2002 Sept.
2002
150,000 350,000 651,000 1,127,125 1,29,3806 1,306,356
CAGR:
- Business: 93%
- Home: 220%
• CAGR: 120%
(Definition: Entities are establishments/individual with internet connection; an entity may house/be multiple user/s)

31
74%
10%
1%
8%
1% 6%
Dial-up ISDN
Leased Line DSL
Cable VSAT
Mode of Internet Access in BusinessesMode of Internet Access in Businesses
72%
10%
1%
6%
3% 9%
Dial-up ISDN
Leased Line DSL
Cable VSAT
March 2002 September 2002

32
Internet owning House-holds by location and by SECInternet owning House-holds by location and by SEC
Town Class March 2001 Sept. 2001 March 2002 Sept.
2002
Top 4 72% 68% 63% 68%
Next 4 18% 23% 25% 19%
Other 8 10% 9% 12% 14%
SEC March 2001 Sept. 2001 March 2002 Sept.
2002
SEC A 73% 79% 71% 77%
SEC B 17% 21% 29% 23%
• Break up by Town-Class:
• Break up by Socio-Economic Profile:

33
Internet Penetration September 2002Internet Penetration September 2002
Business Segment Home
Overall 40% 11%
Top 4 Metros 42% 13%
Next 4 Metros 41% 9%
Other 8 Metros 29% 9%
SEC A - 20%
SEC B - 4%
• Internet Penetration by Town class and Socio-Economic Classification
• Break-up of Internet Connection in Business Entities:
Indian Pvt. 91%
MNC 2%
Govt./PSU 7%

SummarySummary
Product Units Value (Rs. Crs.)
H1/02-03 H1/01-02 % H1/02-03 H1/01-02 %ComputersDesktops 950,855 803,055 18 2,355 2,210 7Notebooks 20,199 21,170 -5 145 169 -14Servers 28,046 27,005 4 404 432 -7PrintersDot-matrix 144,330 157,205 -8 124 147 -16 Laserjet 42,927 26,330 63 108 74 46Inkjet 192,601 207,112 -7 80 83 - 4Line 1,754 1,840 -5 24 28 -14OthersKeyboards 975,310 837,430 16 ** ** **Monitors 977,145 834,030 17 597 490 22UPS 221,227 176,100 26 ** ** **NetworkingNIC 751,074 498,775 51 - - -Hub 301046 84,525 256 - - -Modem 178,271 255,045 -30 - - - Internet 1,306,356* 1,293,806** 10%* September 2002; ** March 2002

35
Forecast for second-half of 2002-03Forecast for second-half of 2002-03
Product Total Market Market forecast for Forecast for 2002-03 Oct. 02-March.03
PCs 2,010,000 1,060,000
Dot-matrix 325,000 180,000Inkjet 432,000 240,000Laserjet 87,000 45,000
UPS 480,000 260,000

36
Thank you!Thank you!