1 iso confidential material1 predictive modeling & marketing
TRANSCRIPT

1
ISO Confidential Material 1
Predictive Modeling & Marketing

2
– A quick peek at what Marketing says it does– “wallet share”– Risk scoring– Aligning marketing and UW
– A quick peek at what Marketing says it does– “wallet share”– Risk scoring– Aligning marketing and UW
OverviewOverview

3
Sales and Distribution
Producer SegmentationMarket PlanningRevenue ForecastingCross sell and Up sellRetention and Profitability
Underwriting
Risk Selection and PricingPortfolio ManagementPremium AdequacyBilling and Collections Management
Claims
Payment AccuracyClaim Collaboration > Fraud Detection > Subrogation > Risk Transfer > 3rd Party Deductible > Reinsurance Recoverable
General Organizational OverviewAn information business focused on risk taking.Make. Sell. Serve.
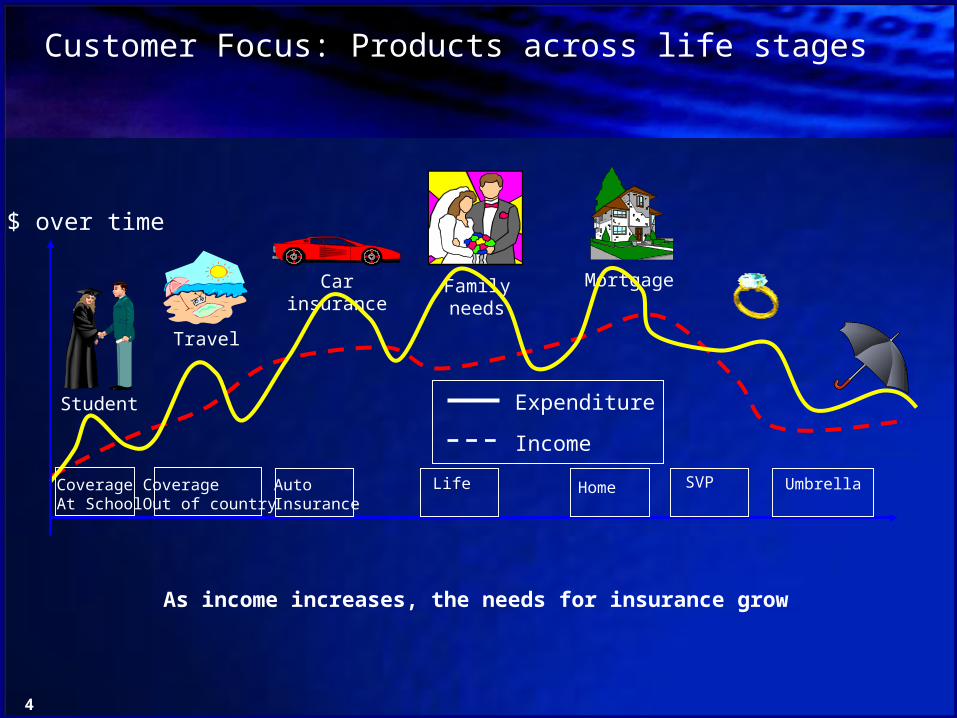
4
Student
Travel
Car insurance Family needs Mortgage
Expenditure
Income
$ over time
CoverageAt School
Coverage Out of country
AutoInsurance
Life Home SVP Umbrella
Customer Focus: Products across life stages
As income increases, the needs for insurance grow

5
Personal Auto Policy Homeowners
$250 $250 $250
Personal Umbrella
$100K
$300K
$50K
$300K
$1.3 million
$1 million
Stackable Coverage can show ‘wallet share’ of customers and point out opportunities for cross-sell and up-sell

6
Most Profitable
Responder New Customer
NOT Profitable
Forced Churn
VoluntarilyLeft YouNext Most
ProfitableTargetMarket
Prospect Responder Current Customers Former
•Acquisition Campaigns
•Cross-sell Campaigns •Upsell Campaigns
•Attrition Prediction•Forced Cancellation•Winback Campaigns
•Segmentation•Risk Selection•Pricing•Yield Management
Customer Life Cycle ManagementBest Practice use of CLTV is to incorporate it into all stages during a customer’s lifecycle

7
Case Study: Database MarketingImplementation ApproachCase Study: Database MarketingImplementation Approach
SERVICE DIFFERENTIATION BASED ON “PORTFOLIO POSITION”SERVICE DIFFERENTIATION BASED ON “PORTFOLIO POSITION”
Most Profitable
NOT Profitable
Next Most Profitable
Retention Programs
Cross-sell / Up-sell
Loss Control Services
Agency Contact
Re-underwriting
Cross-sell / Up-sellForced Churn (where legally appropriate)
Price to Risk

8
Portfolio View for Underwriting AnalysisPortfolio View for Underwriting Analysis

9
Grow Your Book in the Right Direction

10
A vast array of CRM applications demand a common glue -- Analytics
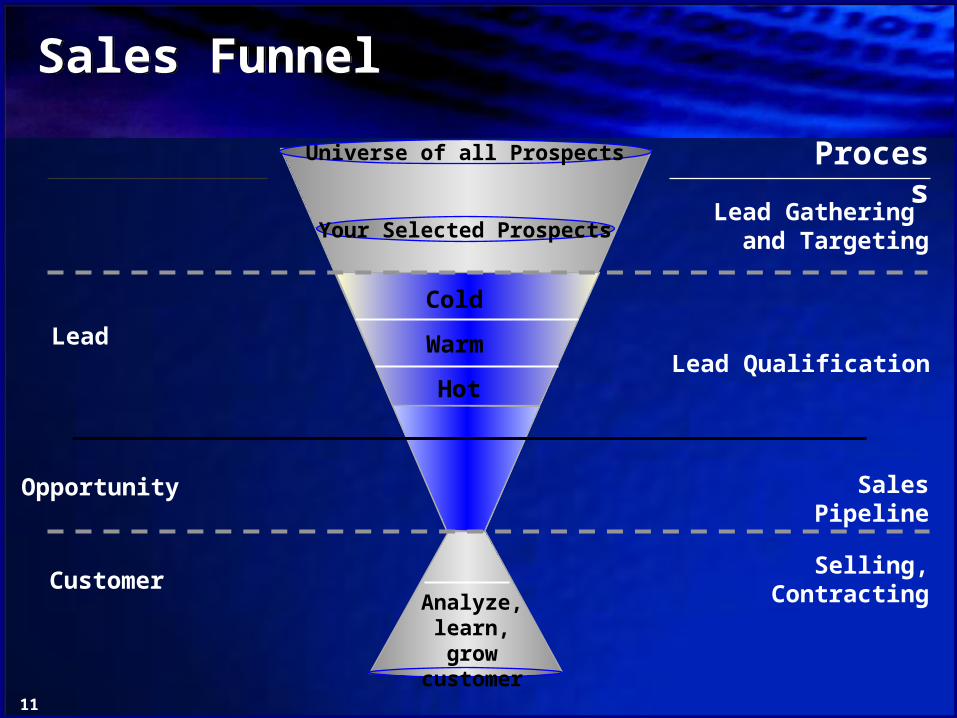
11
Universe of all Prospects
Sales Pipeline
Lead Qualification
Lead Gathering and Targeting
Selling, Contracting
Hot
Cold
Customer
Process
Lead
Opportunity
Warm
Sales FunnelSales Funnel
Analyze, learn, grow customer
Your Selected Prospects

12
Mass Targeted
Competitive Attention Selective Attention
Breadth Depth
Remember Respond
Impression Decision
Pay for Everyone Pay for Targets
General Advertising and Direct Mail – A Simple ComparisonGeneral Advertising and Direct Mail – A Simple Comparison
Advertising Direct Marketing

13
Selection FactorsSelection Factors
• Consumer Lists– Age– Income– Gender– Marital Status– Homeowner– Dwelling Type (home
or apartment)– Mail order buying (by
product type)– Interests– Presence of children– Geographical (zip,
SCF, county, state, carrier route)
• Consumer Lists– Age– Income– Gender– Marital Status– Homeowner– Dwelling Type (home
or apartment)– Mail order buying (by
product type)– Interests– Presence of children– Geographical (zip,
SCF, county, state, carrier route)
• Business Lists– SIC (Standard
Industrial Classification)
– Employee Size– Annual Sales/Revenue– Title– Any other information
captured on subscription form (publications)
– Corporate linkage information
– # of years in business– Geographical (zip,
SCF, county, state)– Credit information

14
B2B Marketing Profile – Banking, Finance & InsuranceB2B Marketing Profile – Banking, Finance & Insurance
Base: N= 47 Source: Forrester Consulting Survey for ABM
2005 Budget Allocation
General business magazines 6.2%
Custom publications10.7%
Industry-specific/trade magazines 6.2%
Direct mail10.5%
Online marketing 7.3%
In-person events5.4%
Other10.4%
Radio3.8%
Printed newsletters6.9%
Public relations3.0%
TV11.1%
Printed directories1.8%
Newspapers16.7%

15
Data Driven Campaign ManagementData Driven Campaign Management
Targeted Marketing
Crosssell
Retention&
Loyality
Credit Risk
NewProduct
NewChannels
NewServices
Data Analysis
ReportingOLAP Data Market
Research
Analysis Mining
Data Warehouse
Data Driven Campaign
management
Segmentation & Scoring
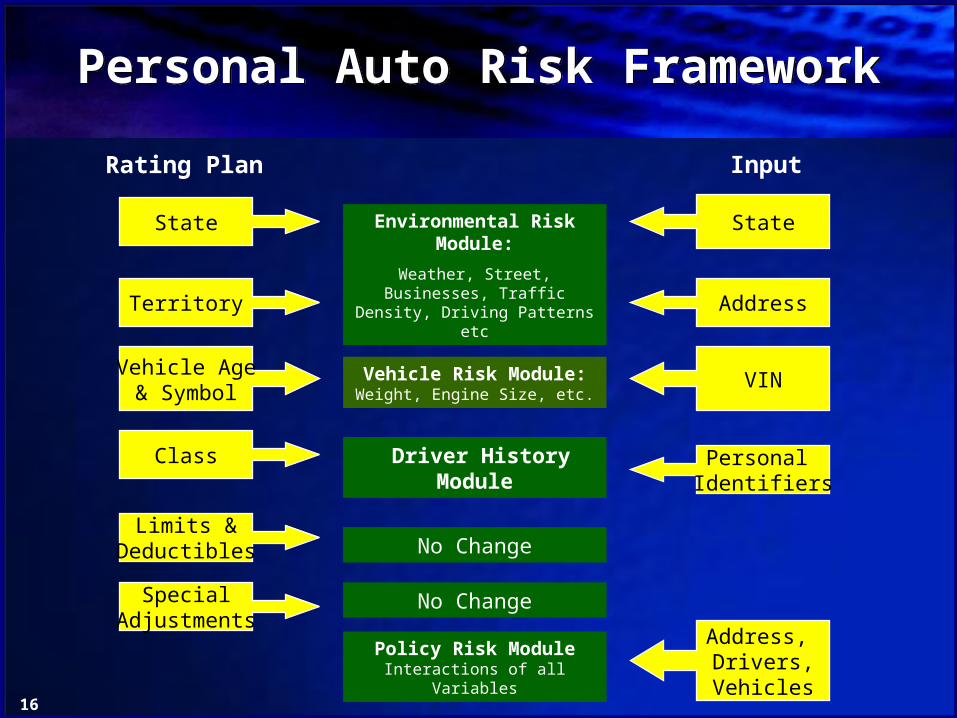
16
Personal Auto Risk FrameworkPersonal Auto Risk Framework
State
Territory
Vehicle Age& Symbol
Limits &Deductibles
SpecialAdjustments
Environmental Risk Module:
Weather, Street, Businesses, Traffic Density, Driving Patterns
etc
Vehicle Risk Module:Weight, Engine Size, etc.
Class Driver History Module
No Change
No Change
Policy Risk ModuleInteractions of all Variables
State
VIN
Address
Personal Identifiers
Address, Drivers,Vehicles
Rating Plan Input

17
ZIP Code 94109: A TourZIP Code 94109: A Tour
The Tenderloin: "...the haunt of the low and vile of every kind. ….Licentiousness, debauchery, pollution, loathsome disease, insanity from dissipation, misery, poverty, blasphemy and death are there. And Hell, yawning to receive the putrid mass, is there also. “
Robert Louis Stevenson declared "Nob Hill, the Hill of Palaces, must certainly be counted the best part of San Francisco."
Japantown
Fishermen’s Wharf

18
Small-Area Geography OverviewSmall-Area Geography Overview

19
Newark NJ AreaCombined RelativityNewark NJ AreaCombined Relativity
"8
"8
"8
"8
"8
"8
"8
"8
"8
"8
"8
"8"8
"8
"8
"8
"8
"8
"8"8
"8
"8
"8
"8
"8
"8 "8
"8
"8
"8
"8
"8
"8
"8
"8
"8
"8
"8"8
"8
"8"8
Clark
Union
Kearny
Linden
Newark
Nutley
Orange
Summit
Verona
Bayonne
Hoboken
Passaic
RoselleCranford
Fairview
Harrison
Hillside
Millburn
Secaucus
Elizabeth
Irvington
Lyndhurst
Maplewood
Montclair
Westfield
Belleville
Bloomfield
GuttenbergLivingston
RidgefieldRutherford
Union City
WallingtonCedar Grove
East Orange
Jersey City
Springfield
West Orange
Little Ferry
Roselle Park
South Orange
Scotch Plains
West Caldwell
West New York
Palisades Park
North Arlington
Ridgefield Park

20
Combining Risk Scores for MarketingCombining Risk Scores for Marketing

21
Competitive AdvantageCompetitive Advantage L
oss
$
Risk
• Carriers establish a base rate for each rating territory that represents the average expected loss cost.
Base Rate

22
Competitive AdvantageCompetitive Advantage
Risk
• Carriers establish a base rate for each rating territory that represents the average expected loss cost.
• In reality there is a distribution of risk and expected loss costs, even within a territory.
Base Rate
ActualCosts
Lo
ss $

23
Competitive AdvantageCompetitive Advantage
Risk
• Carriers establish a base rate for each rating territory that represents the average expected loss cost.
• In reality there is a distribution of risk and expected loss costs, even within a territory.
• The Prescreen Score more closely follows the actual distribution of risk.
Base Rate
ActualCosts
PrescreenScore
Lo
ss $
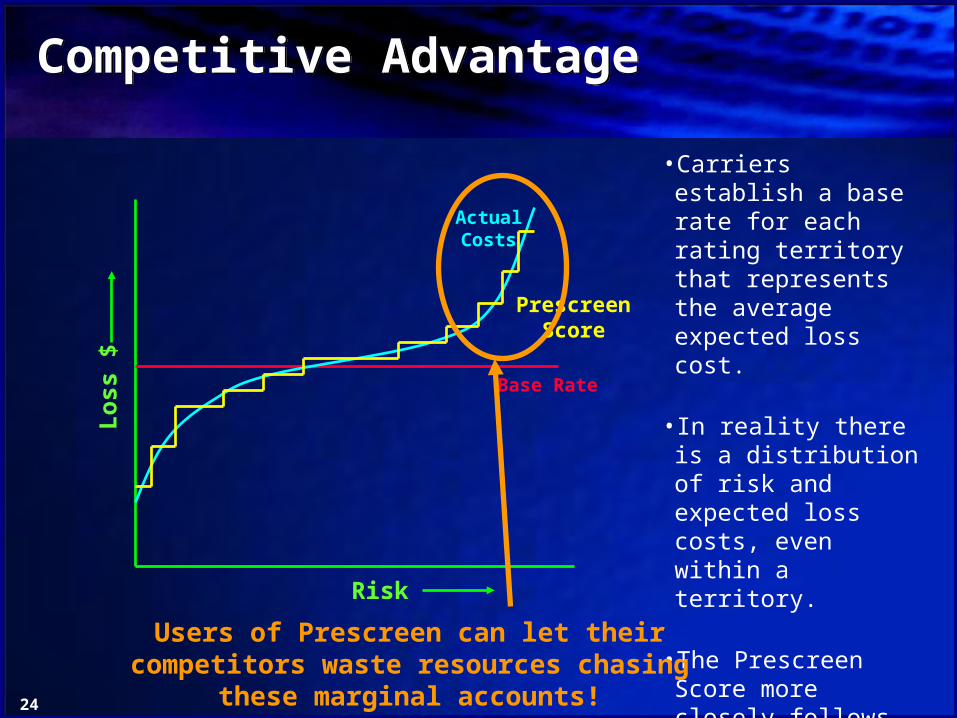
24
Competitive AdvantageCompetitive Advantage
Risk
• Carriers establish a base rate for each rating territory that represents the average expected loss cost.
• In reality there is a distribution of risk and expected loss costs, even within a territory.
• The Prescreen Score more closely follows the actual distribution of risk.
Base Rate
ActualCosts
PrescreenScore
Users of Prescreen can let their competitors waste resources chasing these marginal accounts!
Lo
ss $
25
– Marketers can use sophisticated models– Portfolio Management is a key to success – Risk-based pricing helps a lot– It is not a competitive advantage if you don’t use it
– Marketers can use sophisticated models– Portfolio Management is a key to success – Risk-based pricing helps a lot– It is not a competitive advantage if you don’t use it
SummarySummary