1 integrated nutrient management in various agroecosystems in tropics
TRANSCRIPT

Integrated Nutrient Management (INM) in various
Agroecosystems in the tropics
1
Speaker
Mr. Vikas Kumar Admission No.: 2013-27-102
Dept. of Silvi. & Agroforestry
College of Forestry, Vellanikkara,
Kerala Agricultural University, Thrissur
Email ID: [email protected]

• Continuous use of chemical fertilization leads
– the deterioration of soil characteristics and fertility ;
– Accumulation of heavy metals in plant tissues;
– Affect the fruit nutritional value and edibility (Shimbo et al., 2001)
– Decline of crop productivity.
• Increasing population is causing pressure on land
INTRODUCTION
2

http://www.newgeography.com
Increasing population
3

National food security
Nutritional security
Maintenance of soil health
Enhancement of soil productivity
Leaving a good heritage for
future generation
CHALLANGES
CHONPKSCaMgFeZnMnCuBMoI
4

Chemical (inorganic)
Fertilizers with
Efficient used
Livestock & Human
Wastes
Crop residues &
Tree wastes
Uraban & Rural
wastes
Agro-Industries
by product
Biological fixation
Integrated
Nutrient
Management
Maintaining soil
fertility
Improved soil
physical condition
Reduced soil
and water erosion
Control the soil-
water-air pollution
Efficient use
of natural resources
Increased crop production
Resources of integrated nutrient management and their role in soil productivity
6

Source
Rate
Time
Place
Cropping system
Environmental
4R Nutrient Stewardship Framework
7 Bruulsema et. al., 2008

Plant Nutrient Application
I. Balanced application of appropriate fertilizers is a
major component of INM.
II. Fertilizers need to be applied at the level required for optimal
crop growth based on crop requirements and agroclimatic
considerations.
III. Over application of fertilizers induces neither substantially
greater crop nutrient uptake nor significantly higher yields.
(Smaling and Braun, 1996)
8

Figure 2: Low pH levels cause excessive availability of iron and manganese, which can lead to toxicities.
Conversely, high pH levels lead to deficiencies of P, Fe, B, Cu, Zn and Mo
(www.planetpermaculture.wordpress.com) 9

Sources of organic manure for INM
Compost / vermicompost
Poultry / Piggery
Manure
Urban and rural solid and liquid Wastes from agro
based industries Crop wastes
Farm Yard Manure (FYM) INM
10

Bio-fertilizers
N- Fixing Phosphate Mobilizing OM Decomposer
1.For Legumes e.g.
Rhizobium
2.For Cereals e.g.
Azotobacter
Azospirillum,BGA,
Azolla
1.Phosphate
Solubilizing e.g.
Bacillus, Pseudomonas
2. Phosphate Absorbing
e. g. VAM, Glomus
1.Cellulolytic e.g.
Trichoderma
2.Lignolytic e.g.
Agaricus,
Arthrobacter
Rhizobium Azospirillum PSB Azotobacter 11

Table 1: Commonly produced Bio-fertilizers in India
Name Benefits
Rhizobium 10-35% yield increase, 50-
200 kg N/ha.
Azotobacter 10-15% yield increase adds
20-25 kg N/ha
Azospirillum 10-20% yield increase
Mycorrhiza
30-50% yield increase
enhances uptake of P, Zn,
S and H2o
PSB 5-30% yield increase
BGA and Azolla
20 -30 kg N/ha, Azolla can
give biomass up to 40-50
tonnes and fix 30-100 kg N/ha
12 www.agricoop.nic.in
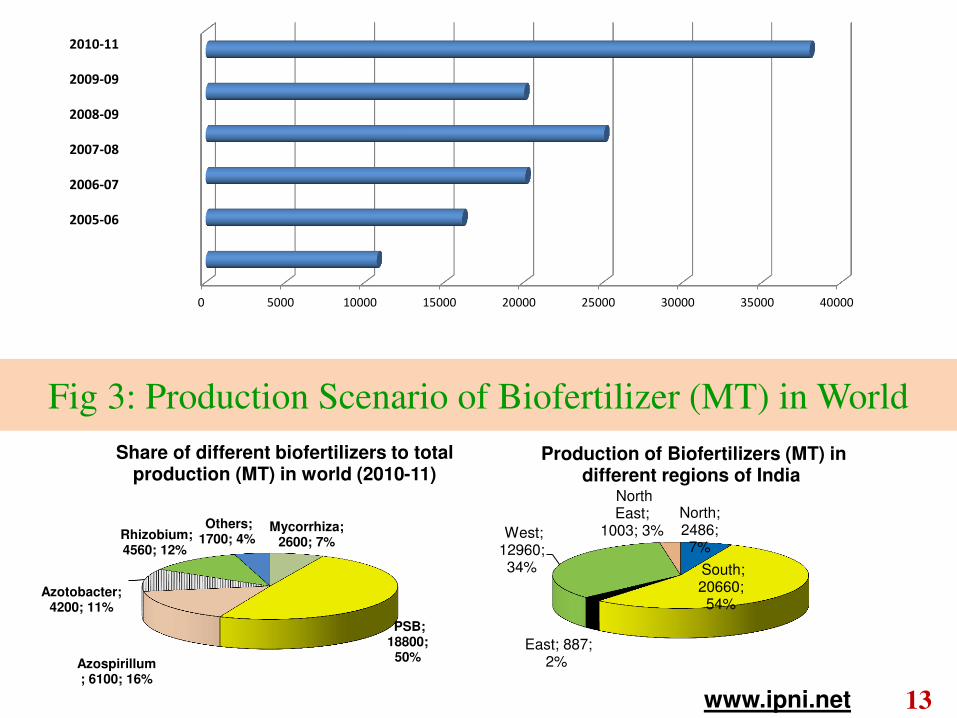
Fig 3: Production Scenario of Biofertilizer (MT) in World
13
0 5000 10000 15000 20000 25000 30000 35000 40000
2010-11
2009-09
2008-09
2007-08
2006-07
2005-06
Mycorrhiza; 2600; 7%
PSB; 18800;
50%
Azospirillum; 6100; 16%
Azotobacter;
4200; 11%
Rhizobium; 4560; 12%
Others; 1700; 4%
Share of different biofertilizers to total production (MT) in world (2010-11)
North; 2486; 7%
South; 20660; 54%
East; 887; 2%
West; 12960; 34%
North East;
1003; 3%
Production of Biofertilizers (MT) in different regions of India
www.ipni.net

Table 2: Economics of Bio-fertilizer use
14
Biofertilizers Quantity required
lit/ha
Cost of application
(Rs/ha)
Amount of nutrient
mobilized kg/ha
Rhizobium in
legumes 0.2-1.0 lit 40-200 25 -35 kg N
Azotobacter/
Azospirillum in non-
legumes
0.5 -2.0 lit 80 -400 20 -25 kg N
Azoto+Azosp+PSB 0.5 -2.0 lit 80 -400 20 kg N + 12 kg P
Mixed inoculants 0.5 -2.0 lit 80 -400 25 kg N +15 kg P
Mycorrhiza 2.00 -5.00 kg 200-500
20-25 kg P +
micronutrients+
moisture
www.agricoop.nic.in
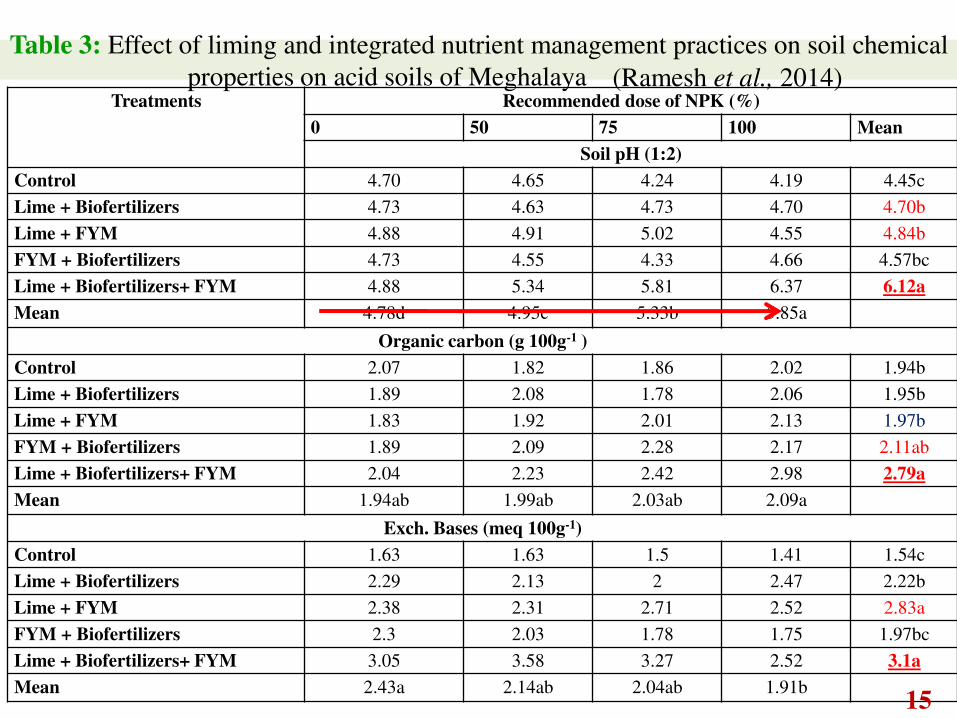
Treatments Recommended dose of NPK (%)
0 50 75 100 Mean
Soil pH (1:2)
Control 4.70 4.65 4.24 4.19 4.45c
Lime + Biofertilizers 4.73 4.63 4.73 4.70 4.70b
Lime + FYM 4.88 4.91 5.02 4.55 4.84b
FYM + Biofertilizers 4.73 4.55 4.33 4.66 4.57bc
Lime + Biofertilizers+ FYM 4.88 5.34 5.81 6.37 6.12a
Mean 4.78d 4.95c 5.33b 5.85a
Organic carbon (g 100g-1 )
Control 2.07 1.82 1.86 2.02 1.94b
Lime + Biofertilizers 1.89 2.08 1.78 2.06 1.95b
Lime + FYM 1.83 1.92 2.01 2.13 1.97b
FYM + Biofertilizers 1.89 2.09 2.28 2.17 2.11ab
Lime + Biofertilizers+ FYM 2.04 2.23 2.42 2.98 2.79a
Mean 1.94ab 1.99ab 2.03ab 2.09a
Exch. Bases (meq 100g-1)
Control 1.63 1.63 1.5 1.41 1.54c
Lime + Biofertilizers 2.29 2.13 2 2.47 2.22b
Lime + FYM 2.38 2.31 2.71 2.52 2.83a
FYM + Biofertilizers 2.3 2.03 1.78 1.75 1.97bc
Lime + Biofertilizers+ FYM 3.05 3.58 3.27 2.52 3.1a
Mean 2.43a 2.14ab 2.04ab 1.91b
Table 3: Effect of liming and integrated nutrient management practices on soil chemical
properties on acid soils of Meghalaya
15
(Ramesh et al., 2014)
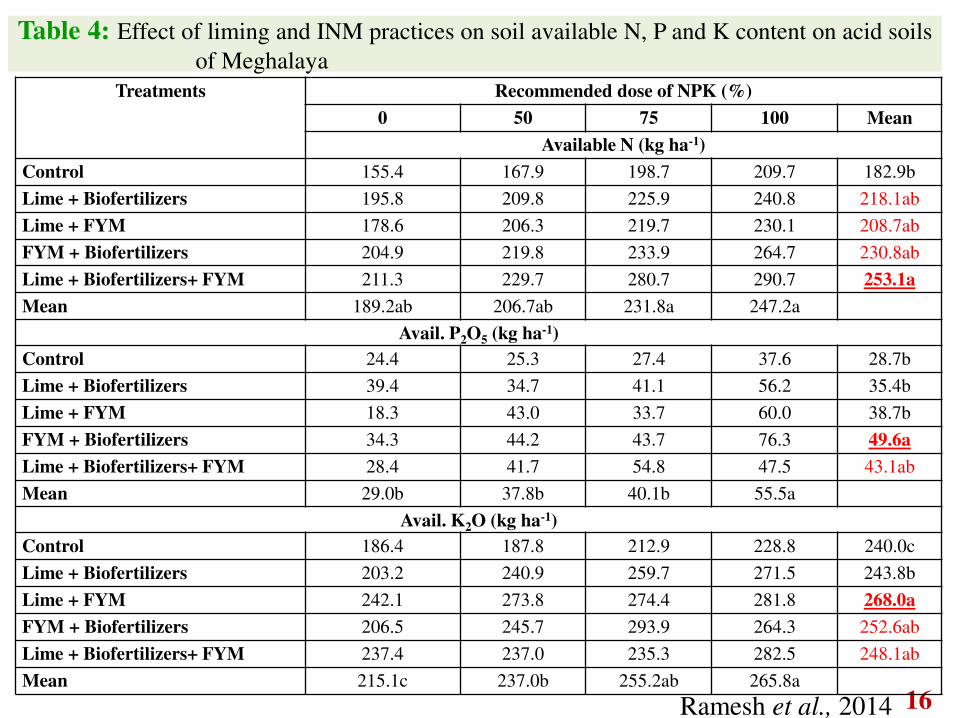
Table 4: Effect of liming and INM practices on soil available N, P and K content on acid soils
of Meghalaya
16 Ramesh et al., 2014
Treatments Recommended dose of NPK (%)
0 50 75 100 Mean
Available N (kg ha-1)
Control 155.4 167.9 198.7 209.7 182.9b
Lime + Biofertilizers 195.8 209.8 225.9 240.8 218.1ab
Lime + FYM 178.6 206.3 219.7 230.1 208.7ab
FYM + Biofertilizers 204.9 219.8 233.9 264.7 230.8ab
Lime + Biofertilizers+ FYM 211.3 229.7 280.7 290.7 253.1a
Mean 189.2ab 206.7ab 231.8a 247.2a
Avail. P2O5 (kg ha-1)
Control 24.4 25.3 27.4 37.6 28.7b
Lime + Biofertilizers 39.4 34.7 41.1 56.2 35.4b
Lime + FYM 18.3 43.0 33.7 60.0 38.7b
FYM + Biofertilizers 34.3 44.2 43.7 76.3 49.6a
Lime + Biofertilizers+ FYM 28.4 41.7 54.8 47.5 43.1ab
Mean 29.0b 37.8b 40.1b 55.5a
Avail. K2O (kg ha-1)
Control 186.4 187.8 212.9 228.8 240.0c
Lime + Biofertilizers 203.2 240.9 259.7 271.5 243.8b
Lime + FYM 242.1 273.8 274.4 281.8 268.0a
FYM + Biofertilizers 206.5 245.7 293.9 264.3 252.6ab
Lime + Biofertilizers+ FYM 237.4 237.0 235.3 282.5 248.1ab
Mean 215.1c 237.0b 255.2ab 265.8a

C/N Ratio of major organic additives
Materials high in nitrogen
C:N
Vegetable scraps 10-20:1
Fruit wastes 20-50:1
Coffee grounds 20:1
Grass clippings 10-25:1
Cottonseed meal 10:1
Dried blood 3:1
Horse manure 20-50:1
Materials high in carbon C:N
Autumn leaves 40-80:1
Sawdust 200-750:1
Wood chips or shavings - hardwood 450-800:1
Wood chips or shavings - softwood 200-1300:1
Bark - hardwood 100-400:1
Bark - softwood 100-1200:1
Newspaper 400-900:1
Source: www.urbangardencenter.com 17
C/N < 20 Mineralization
C/N > 20 Immobilization

Table 5: Nutrient status of the soil as influenced by different treatments in papaya, Karnataka
18 Ravishankar et al., 2010
Treatment Organic
carbon
(%)
Organic
matter
(%)
pH Av. N
(kg ha-1)
Av.
P2O5
(kg ha-1)
Av. K2O
(kg ha-1)
T1- NPK fertilizers (250:250:500 g NPK
plant-1 year-1 as check
1.01c 1.32ab 5.50 373.00b 92.00 426.80
T2- FYM 20 kg/plant 1.22ab 2.43a 5.79 375.00b 94.67 365.33
T3- Urban compost 13.5 kg/plant 1.14ab 2.37ab 5.65 343.67c 87.67 390.80
T4- Sun hemp (Crotalaria juncea) 25
kg/plant
1.27a 2.07c 5.65 371.00b 98.33 373.37
T5- Sun hemp 40 kg/plant + rock
phosphate 300 g/plant
1.08b 2.11c 5.58 362.33bc 103.67 393.50
T6- Neem cake 4 kg + wood ash 2.5
kg/plant
1.15ab 2.15b 5.98 394.67a 100.33 421.8
T7- Rural compost 35 kg/plant 1.21ab 1.96d 5.51 315.33d 96.33 3.74.13
S.Ed. 0.070 0.227 NS 10.842 NS NS
CD (0.05) 0.154 0.493 23.623
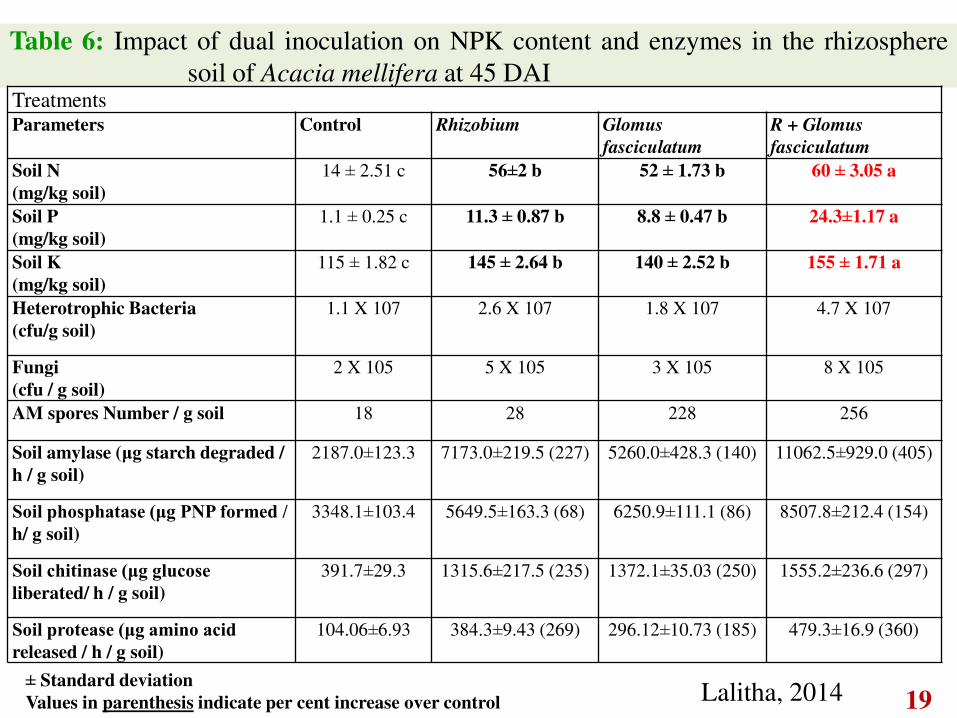
Table 6: Impact of dual inoculation on NPK content and enzymes in the rhizosphere
soil of Acacia mellifera at 45 DAI
19 Lalitha, 2014 ± Standard deviation
Values in parenthesis indicate per cent increase over control
Treatments Parameters Control Rhizobium Glomus
fasciculatum
R + Glomus
fasciculatum
Soil N
(mg/kg soil)
14 ± 2.51 c 56±2 b 52 ± 1.73 b 60 ± 3.05 a
Soil P
(mg/kg soil)
1.1 ± 0.25 c 11.3 ± 0.87 b 8.8 ± 0.47 b 24.3±1.17 a
Soil K
(mg/kg soil)
115 ± 1.82 c 145 ± 2.64 b 140 ± 2.52 b 155 ± 1.71 a
Heterotrophic Bacteria
(cfu/g soil)
1.1 X 10⁷ 2.6 X 10⁷ 1.8 X 10⁷ 4.7 X 10⁷
Fungi
(cfu / g soil)
2 X 10⁵ 5 X 10⁵ 3 X 10⁵ 8 X 10⁵
AM spores Number / g soil 18 28 228 256
Soil amylase (μg starch degraded /
h / g soil)
2187.0±123.3 7173.0±219.5 (227) 5260.0±428.3 (140) 11062.5±929.0 (405)
Soil phosphatase (μg PNP formed / h/ g soil)
3348.1±103.4 5649.5±163.3 (68) 6250.9±111.1 (86) 8507.8±212.4 (154)
Soil chitinase (μg glucose liberated/ h / g soil)
391.7±29.3 1315.6±217.5 (235) 1372.1±35.03 (250) 1555.2±236.6 (297)
Soil protease (μg amino acid released / h / g soil)
104.06±6.93 384.3±9.43 (269) 296.12±10.73 (185) 479.3±16.9 (360)
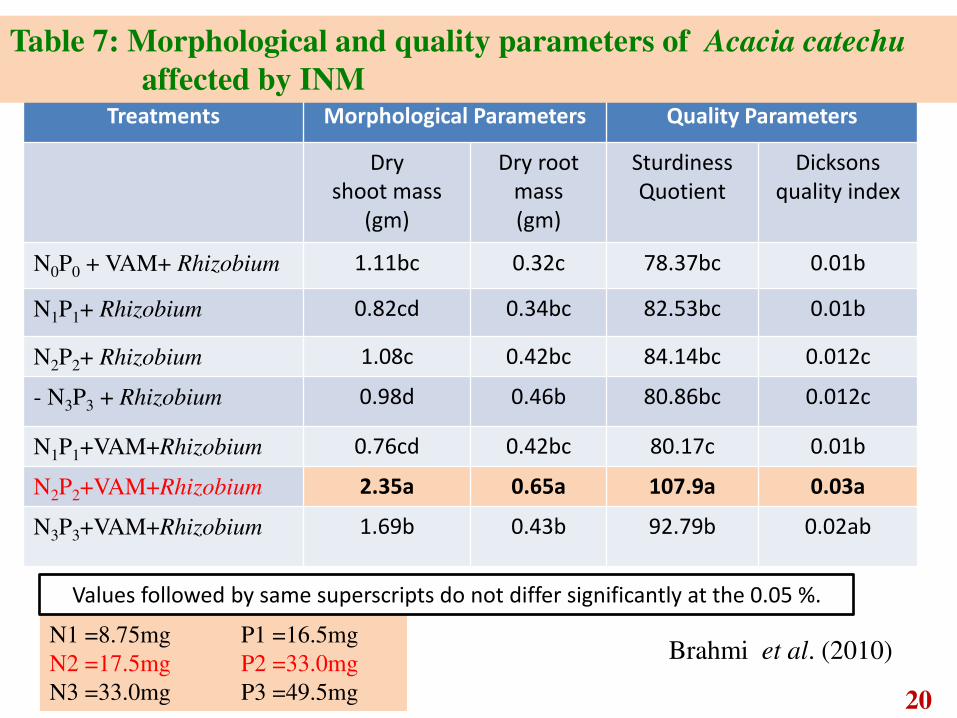
Treatments Morphological Parameters Quality Parameters
Dry
shoot mass
(gm)
Dry root
mass
(gm)
Sturdiness
Quotient
Dicksons
quality index
N0P0 + VAM+ Rhizobium 1.11bc 0.32c 78.37bc 0.01b
N1P1+ Rhizobium 0.82cd 0.34bc 82.53bc 0.01b
N2P2+ Rhizobium 1.08c 0.42bc 84.14bc 0.012c
- N3P3 + Rhizobium 0.98d 0.46b 80.86bc 0.012c
N1P1+VAM+Rhizobium 0.76cd 0.42bc 80.17c 0.01b
N2P2+VAM+Rhizobium 2.35a 0.65a 107.9a 0.03a
N3P3+VAM+Rhizobium 1.69b 0.43b 92.79b 0.02ab
Table 7: Morphological and quality parameters of Acacia catechu
affected by INM
Brahmi et al. (2010)
20
N1 =8.75mg P1 =16.5mg
N2 =17.5mg P2 =33.0mg
N3 =33.0mg P3 =49.5mg
Values followed by same superscripts do not differ significantly at the 0.05 %.
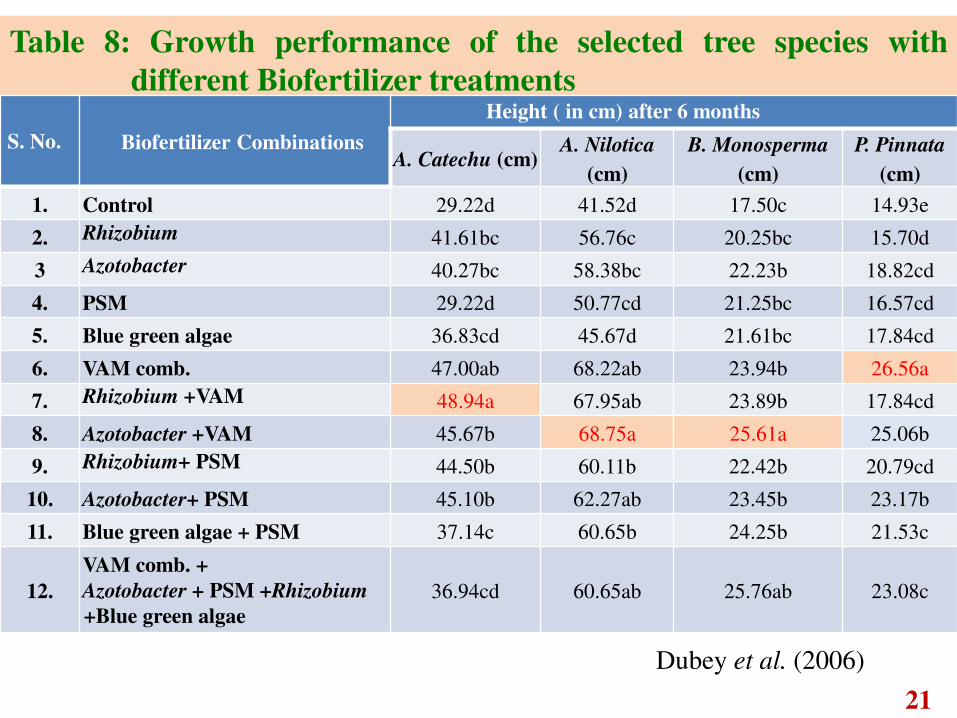
Table 8: Growth performance of the selected tree species with
different Biofertilizer treatments
21
Dubey et al. (2006)
S. No. Biofertilizer Combinations
Height ( in cm) after 6 months
A. Catechu (cm) A. Nilotica
(cm)
B. Monosperma
(cm)
P. Pinnata
(cm)
1. Control 29.22d 41.52d 17.50c 14.93e
2. Rhizobium 41.61bc 56.76c 20.25bc 15.70d
3 Azotobacter 40.27bc 58.38bc 22.23b 18.82cd
4. PSM 29.22d 50.77cd 21.25bc 16.57cd
5. Blue green algae 36.83cd 45.67d 21.61bc 17.84cd
6. VAM comb. 47.00ab 68.22ab 23.94b 26.56a
7. Rhizobium +VAM 48.94a 67.95ab 23.89b 17.84cd
8. Azotobacter +VAM 45.67b 68.75a 25.61a 25.06b
9. Rhizobium+ PSM 44.50b 60.11b 22.42b 20.79cd
10. Azotobacter+ PSM 45.10b 62.27ab 23.45b 23.17b
11. Blue green algae + PSM 37.14c 60.65b 24.25b 21.53c
12.
VAM comb. +
Azotobacter + PSM +Rhizobium
+Blue green algae
36.94cd 60.65ab 25.76ab 23.08c

Treatment
180 DAP
Height (cm) Basal Dia. (mm) Branches Leaf Area
(cm2/plant)
T1 178.33c 19.94c 23.67c 113.12b
T2 202.33b 21.82b 25.33c 126.36b
T3 201.00b 21.87 b 24.67c 121.61b
T4 202.67b 21.16 b 27.67b 120.65b
T5 211.67b 22.86 b 34.67a 134.05a
T6 229.33a 24.66a 36.33a 141.90a
CD(P=0.05) 7.40 1.63 4.85 5.69
Table 9: Effect of Nutrient Management Practices on growth parameters of
Dalbergia sissoo in agri-silviculture system, Karnataka
Jaisankar et al. (2014) T1 –Control
T2 - Recommended dose of fertilizer (RDF) alone - 110:65:65 NPK kg ha-1
T3 - Soil Test Value (STV) alone - 110:78:52 NPK kg ha-1
T4 - 75 % of STV - 83:59:39 NPK kg ha-1 + VAM (100g plant-1) + Azospirillum (50g plant-1) +
Phosphobacteria (50g plant-1) + FYM (500g plant-1)
T5 - 100 % of STV- 110:78:52 NPK kg ha-1 + VAM (100g plant-1) + Azospirillum (50g plant-1) +
Phosphobacteria (50g plant-1) + FYM (500g plant-1)
T6 - 125% of STV 138:98:65 NPK kg ha-1 + VAM (100g plant-1) + Azospirillum (50g plant-1) +
Phosphobacteria (50g plant-1) + FYM (500g plant-1). 22

Table 10: Effect of some biofertilizers and compost on vegetative
growth of Jatropha curcas seedlings in sandy soil, Egypt
Treatment Plant height
(cm)
Root length
(cm)
Stem diameter
(cm)
No. of
leaves/plant
Leaf area
(cm2)
Control 110.30 17.80 2.10 23.70 37.33
Microbien 135.80 (23.11) 25.70 (56.8) 2.83 (34.76) 38.60 (62.86) 49.67 (33.05)
Phosphorien 126.30 (17.82) 32.10 (79.5) 2.75 (32.65) 33.70 (49.93) 59.31 (42.6)
Algae 153.60 (39.25) 39.60 (129.7) 3.51 (67.14) 62.30 (162.86) 80.43 (115.4)
Nile compost 115.60 (12.81) 34.70 (94.9) 3.11 (48.0) 49.60 (76.88) 71.67 (109.2)
Peanut Compost 119.90 (15.74) 37.10 (112.9) 3.30 (57.14) 53.30 (85.71) 75.53 (126.5)
L.S.D at 5% 4.02 2.00 0.09 1.50 3.41
El-Quesni et al. (2013) 23
Values in parenthesis indicate per cent increase over control

Treatment N
(%)
P
(%)
K
(%)
Ca
(%)
Mg
(%)
T1=Recommended dose of NPK + FYM(750g :375 g: 750g +100kg) 2.77ab 0.25c 1.42 2.58ab 0.53c
T2=Three fourths of the recommended NPK +137.5kg FYM 2.68ab 0.28b 1.34 2.46bc 0.54bc
T3= Half of the recommended NPK + 175 kg FYM 2.69ab 0.27b 1.38 2.46bc 0.54bc
T4= Recommended dose of NPK+10kg neem cake 2.63ab 0.25c 1.35 2.58ab 0.52c
T5= Three fourths of the recommended NPK+ 13.75 kg neem cake 2.67ab 0.26b 1.39 2.49b 0.59b
T6= Half of the recommended NPK + 17.5kg neem cake 2.69 0.24c 1.40 2.50b 0.62a
T7= Recommended dose of NPK +50kg vermicompost 2.78a 0.31a 1.38 2.57ab 0.61ab
T8=3/4 of the recommended NPK+68.75kg vermicompost 2.76ab 0.28 1.44 2.37c 0.60ab
T9= Half of the recommended NPK + 87.50kg vermicompost 2.71ab 0.31a 1.41 2.60a 0.53c
T10=15 kg neem cake 2.53b 0.24c 1.29 2.36c 0.56bc
T11= 75 kg vermicompost 2.48b 0.26b 1.29 2.33c 0.60ab
T12= 150kg FYM 2.27c 0.27b 1.27 2.39bc 0.57b
T13= Recommended dose of NPK 2.67ab 0.25c 1.31 2.22d 0.53c
CD 0.05 0.24 0.04 NS 0.10 0.03
Table 11: Effect of INM on the macro-nutrient status of walnut leaves, HP
Bhattaria and Tomar (2009) 24
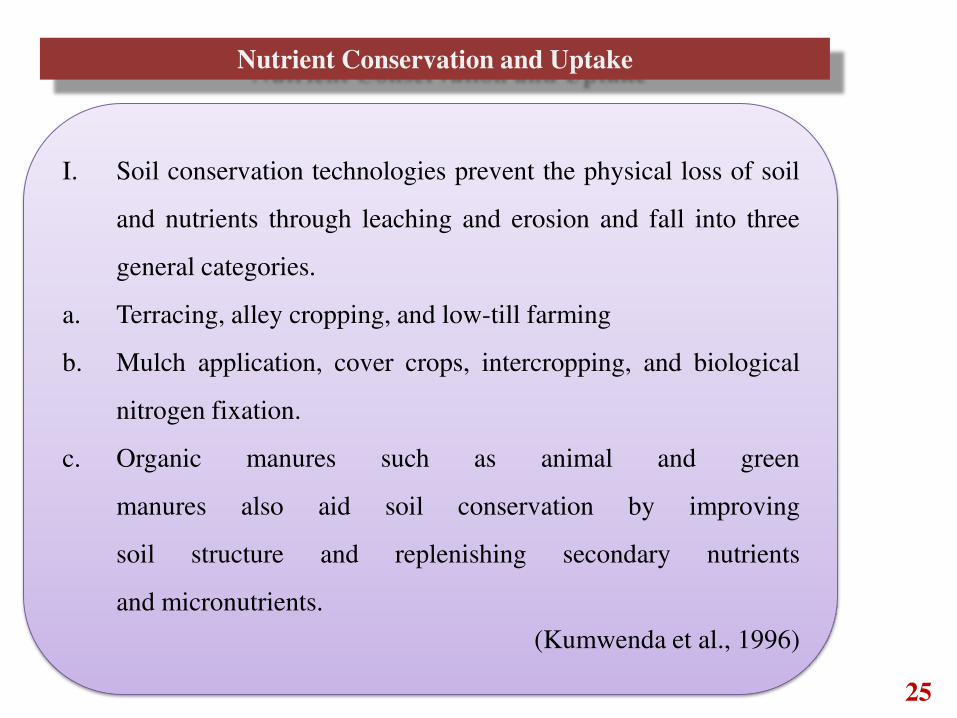
Nutrient Conservation and Uptake
I. Soil conservation technologies prevent the physical loss of soil
and nutrients through leaching and erosion and fall into three
general categories.
a. Terracing, alley cropping, and low-till farming
b. Mulch application, cover crops, intercropping, and biological
nitrogen fixation.
c. Organic manures such as animal and green
manures also aid soil conservation by improving
soil structure and replenishing secondary nutrients
and micronutrients.
(Kumwenda et al., 1996)
25
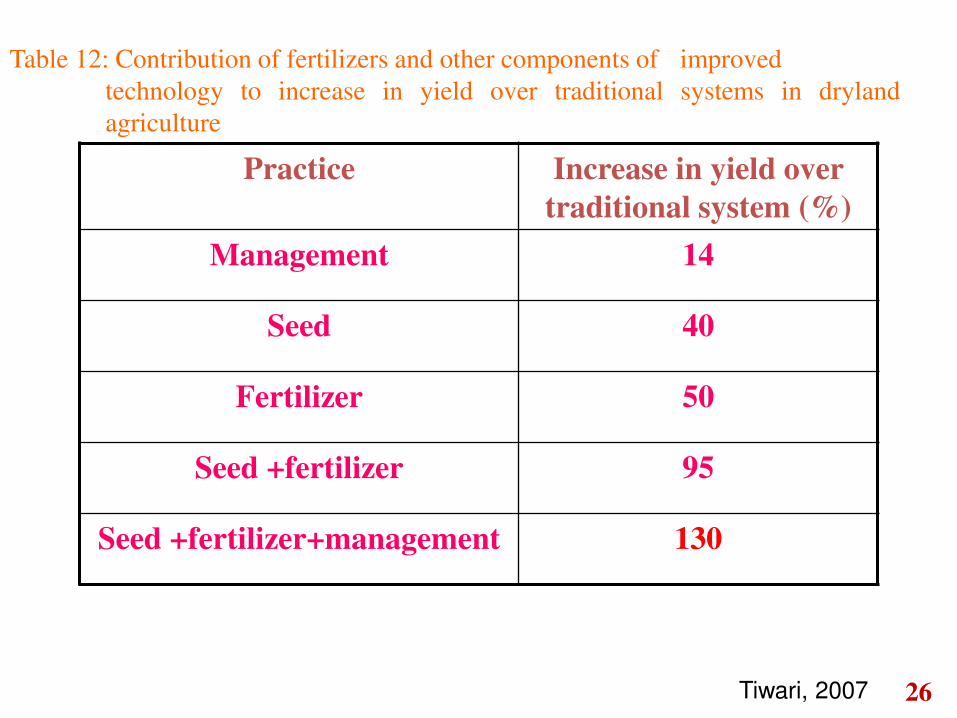
Table 12: Contribution of fertilizers and other components of improved
technology to increase in yield over traditional systems in dryland
agriculture
Practice Increase in yield over
traditional system (%)
Management 14
Seed 40
Fertilizer 50
Seed +fertilizer 95
Seed +fertilizer+management 130
Tiwari, 2007 26

SOIL BIOTA
Fragmentation and intermixing of organic residues
Soil turnover
Increase in water
holding capacity
Soil aeration (poracity)
Water infiltration
Mineralization and
humification
Organic matter decomposition
Soil Texture
Modification
Decreasing in nutrient erosion loss
Nutrient Cycling (N&P)
Increase in CO2
production
Integrated Activity of Soil Biota
Rajagopal, 1996 27
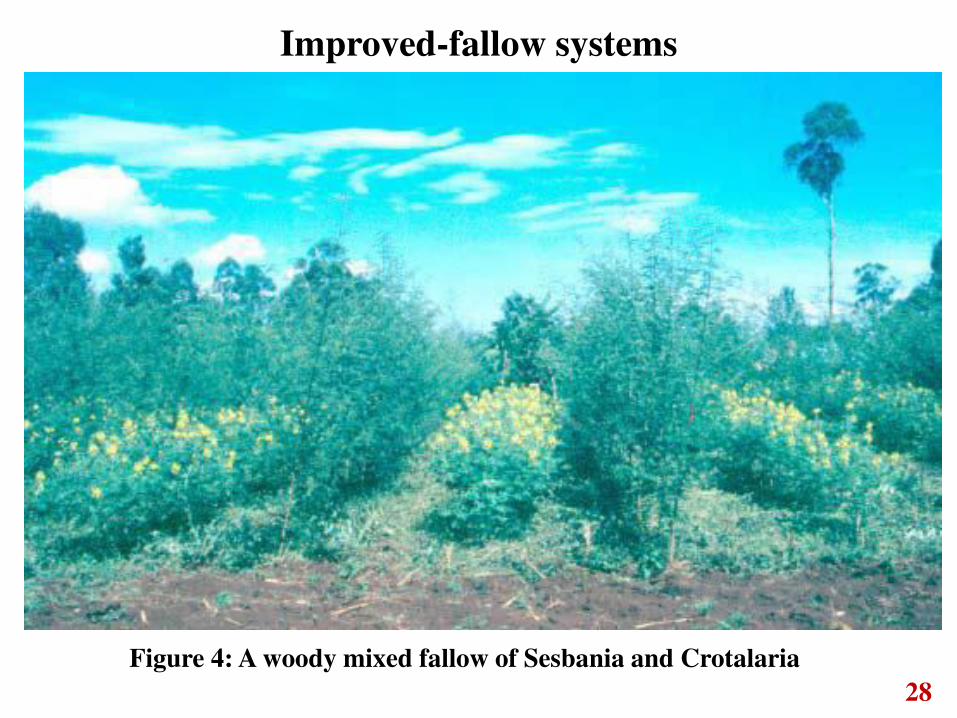
Improved-fallow systems
Figure 4: A woody mixed fallow of Sesbania and Crotalaria
28

Suitable species for Improved-fallow systems
Woody species
• Gliricidia sepium
• Sesbania sesban
• Tephrosia candida
• Tephrosia vogelii
Herbaceous species
Cajanus cajan (pigeon pea)
Calliandra calothyrsus
(calliandra)
Crotalaria grahamiana
(crotalaria)
Canavalia ensiformis
Colopogonium mucunoides
Dolichos lablab
Macroptilium atropurpureum
29

Table 13: Soil fertility and crop yields under improved-fallow systems in
southern Mali
Kaya and Nair, 2001
Para-
meter
Depth
(cm)
Treatment
1 2 3 4 5 6
C (g/kg) 0-20 2.90** 0.23ns 0.67ns 0.03ns 1.30ns 0.80ns
20-40 -0.37 ns -0.33ns 0.77ns 0.53ns 1.77ns 0.57ns
40-60 -0.67ns -0.53ns 0.03ns -1.50ns -1.30ns -0.13ns
N (g/kg) 0-20 0.13** -0.00ns -0.00ns 0.07ns -0.03ns 0.03ns
20-40 0.10** 0.03ns 0.03ns 0.07ns 0.10* -0.00ns
40-60 0.03ns -0.00ns -0.00ns 0.07ns 0.07ns 0.07ns
P (mg/kg) 0-20 -13.97ns -0.15ns -0.64ns 7.22* 3.37ns -0.43ns
20-40 5.87ns 0.61ns 0.62ns 1.65ns 1.01ns 0.11ns
40-60 0.59ns 0.37ns 1.27ns 3.45ns 0.63ns -0.02ns
Difference: ns=not significant, *significant at p<0.005, ** significant at p<0.001
Treatment: 1= Gliricidia sepium, 2= Gliricidia sepium + Stylosanthes hamata, 3= Pterocarpus erinaceus,
4= Pterocarpus erinaceus + Stylosanthes hamata, 5 = Stylosanthes hamata, 6= Natural grass fallow 30
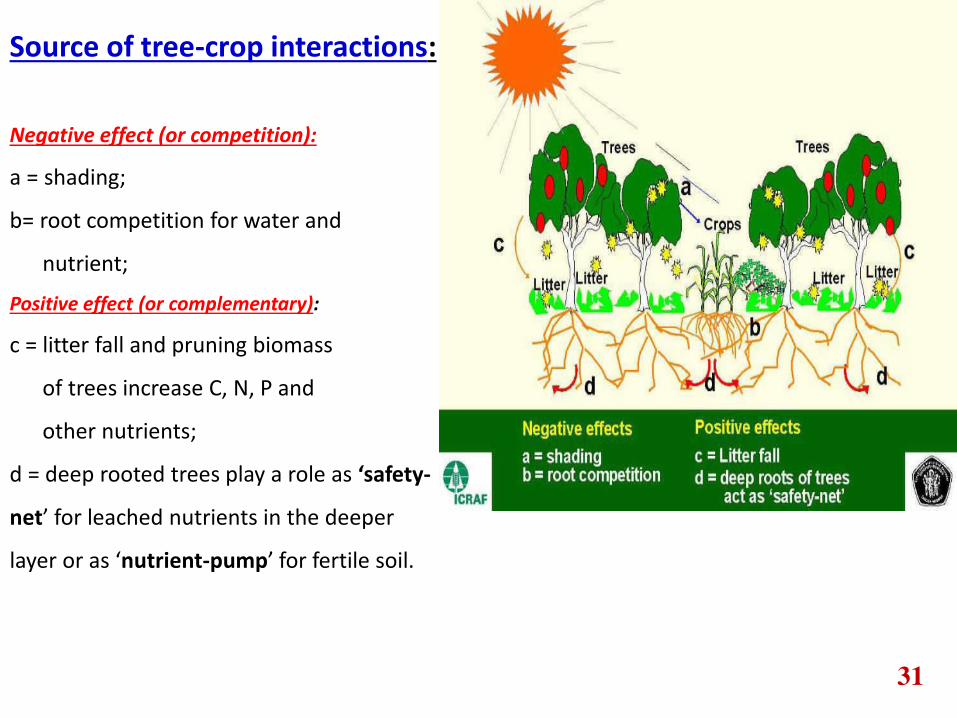
Source of tree-crop interactions:
Negative effect (or competition):
a = shading;
b= root competition for water and
nutrient;
Positive effect (or complementary):
c = litter fall and pruning biomass
of trees increase C, N, P and
other nutrients;
d = deep rooted trees play a role as ‘safety-
net for leached nutrients in the deeper
layer or as nutrient-pump for fertile soil.
31

Nutrient cycling in agroforestry
Agroforestry systems promote more
closed nutrient cycling than
agricultural systems by:
Uptake and recycling: taking up soil
nutrients by tree root systems and
recycling them as litter, including
root residues
Synchronization: helping to
synchronize nutrient release with
crop requirements by controlling the
quality, timing and manner of
addition of plant residues.
32

Figure 5:
33
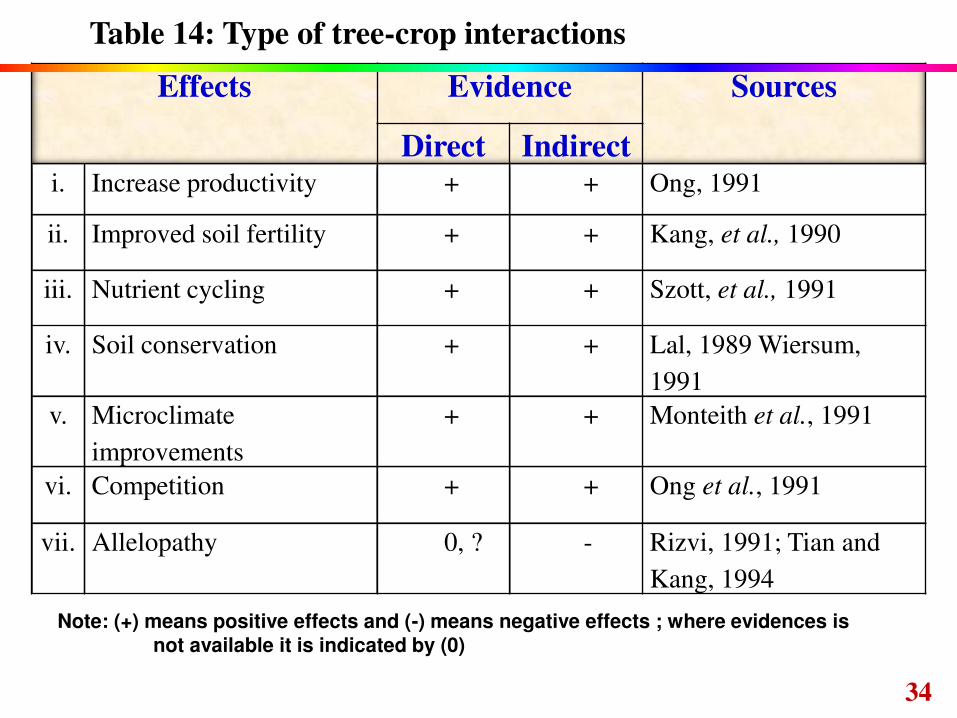
Effects Evidence Sources
Direct Indirect i. Increase productivity + + Ong, 1991
ii. Improved soil fertility + + Kang, et al., 1990
iii. Nutrient cycling + + Szott, et al., 1991
iv. Soil conservation + + Lal, 1989 Wiersum,
1991
v. Microclimate
improvements
+ + Monteith et al., 1991
vi. Competition + + Ong et al., 1991
vii. Allelopathy 0, ? - Rizvi, 1991; Tian and
Kang, 1994
Table 14: Type of tree-crop interactions
Note: (+) means positive effects and (-) means negative effects ; where evidences is
not available it is indicated by (0)
34

Table 15: Weighted means of chemical soil quality parameters used for
computing chemical soil quality index (CSQI)
Sharma, 2010
Physico chemical
properties
Exchangeable
nutrients
Total nutrients Total
micronutrients
CS
QI
pH EC OC CE
C
Ca Mg Na K N P K Ca Mg Cu Mn Zn Fe
Agri-
horticultur
al system
5.4
a
0.0
4b
8.0b 12.7
b
5.3
6b
3.8
4ab
0.1
8b
0.18
b
531.
3c
673.
6c
4.5
7ab
13.
4c
4.6
4ab
16.
0b
136
b
37.
2ab
13.
6ab
0.86
ab
Agroforest
ry system
7.5
a
0.1
1a
9.6a 13.7
a
5.8
6ab
4.7
1a
0.1
8b
0.23
a
565.
0b
787.
3b
4.6
0ab
14.
0b
5.2
2a
17.
4a
160
a
40.
2a
13.
8a
0.92
a
Pastoral
system
6.8
b
0.0
7b
8.1b 9.2c 4.5
0b
2.8
3b
0.1
6b
0.16
b
607.
5a
880.
0a
4.3
8b
11.
5d
5.1
4ab
10.
5b
99c 36.
7ab
12.
3b
0.80
b
Arable
land
6.4
b
0.0
4b
3.7c 10.8
b
7.4
4a
2.4
6b
0.2
1a
0.15
b
483.
5c
473.
5d
4.6
4a
14.
4a
4.5
1b
9.7
c
104
c
35.
0b
11.
7c
0.76
c
35
Note: EC: dsm-1, OC: gkg-1, CEC: cmol kg-1, Exchang eable nutrients (Ca, Mg, Na, K): cmol
kg-1, Total nutrients (N,P,K,Ca,Mg): mg kg-1, Total micronutrients (Cu, Mn, Zn, Fe): mg kg-1
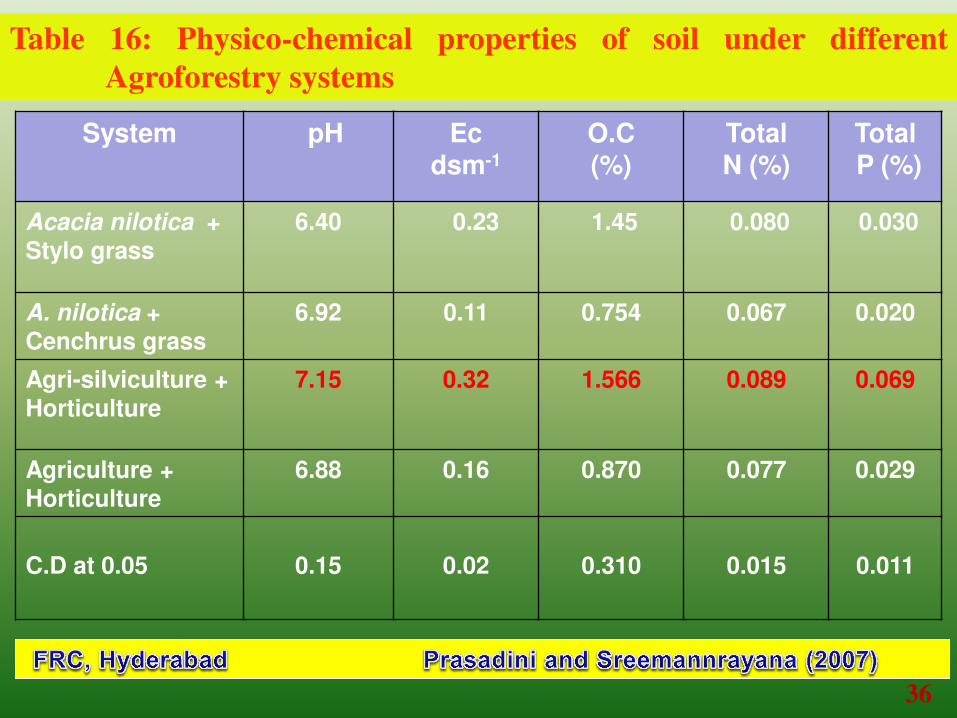
System pH Ec dsm-1
O.C (%)
Total N (%)
Total P (%)
Acacia nilotica +
Stylo grass
6.40 0.23 1.45 0.080 0.030
A. nilotica +
Cenchrus grass
6.92 0.11 0.754 0.067 0.020
Agri-silviculture + Horticulture
7.15 0.32 1.566 0.089 0.069
Agriculture +
Horticulture
6.88 0.16 0.870 0.077 0.029
C.D at 0.05
0.15
0.02
0.310
0.015
0.011
Table 16: Physico-chemical properties of soil under different
Agroforestry systems
36
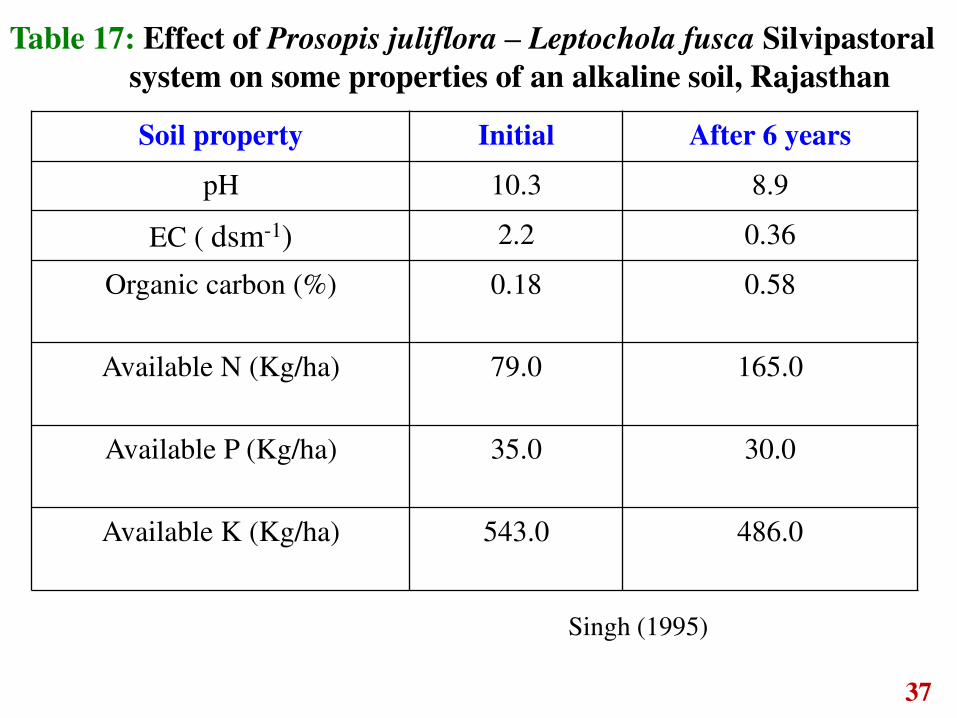
Table 17: Effect of Prosopis juliflora – Leptochola fusca Silvipastoral
system on some properties of an alkaline soil, Rajasthan
Soil property Initial After 6 years
pH 10.3 8.9
EC ( dsm-1) 2.2 0.36
Organic carbon (%) 0.18 0.58
Available N (Kg/ha) 79.0 165.0
Available P (Kg/ha) 35.0 30.0
Available K (Kg/ha) 543.0 486.0
Singh (1995)
37

Status of soil degradation in India.
Problem area classified
Mha
1. Area subjected to water and wind erosion
162.40
2. Area degradated through special problems
a. Water logged
11.60
b. Alkali soils
4.50
c. Saline soils
5.50
d. Acid soils (pH 5.5) 25.00
e. Riverine and gullies
3.97
f. Shifting cultivation
4.91
g. Riverine and torrents
2.37
3. Flood affected
40.00
4. Total drought prone
260.00
5. Annual loss of nutrients (in mt.)
5.37 to 8.40
38

Consequences of soil erosion Soil loss per annum
6000 Mt
Nutrient loss per annum
5.6-8.4 Mt.
Food production loss
30 to 40 Mt.
Soil Loss per unit area
16.3 t ha-1 year-1
Permissible soil loss
12.5 t ha-1 year-1
Global level soil loss
26 billion t year-1
Ramanathan, 2000 39

Land use Run off Soil loss (tonnes/ha)
Maize 18.3 17.7
Maize + Subabul 8.9 5.00
Maize + Eucalyptus 3.6 0.91
Crysopogon fulvus 1.6 0.33
Grass + Subabul 0.6 0.13
Subabul 0.4 0.04
Grass + Eucalyptus 0.1 0.02
Table 18: Run off and soil loss under different agroforestry systems
Narain et al. (1994)
40

Table 19: Soil losses after six years under hedgerow intercropping
using Leucaena varieties
Treatments
Soil loss (tons/ha)
1986 1987 1988 1989 1990 1991 Total
Peru + Maize 3.0 1.6 0.8 0.8 1.7 1.7 9.6
Hawaiian giant +
Maize
3.1 2.1 1.2 3.0 1.6 1.3 12.3
Cunningham +
Maize
5.3 2.4 1.3 2.0 2.3 1.6 14.9
Control 78.0 81.3 30.4 23.2 32.0 21.6 266.5
Banda et al. (1994)
41
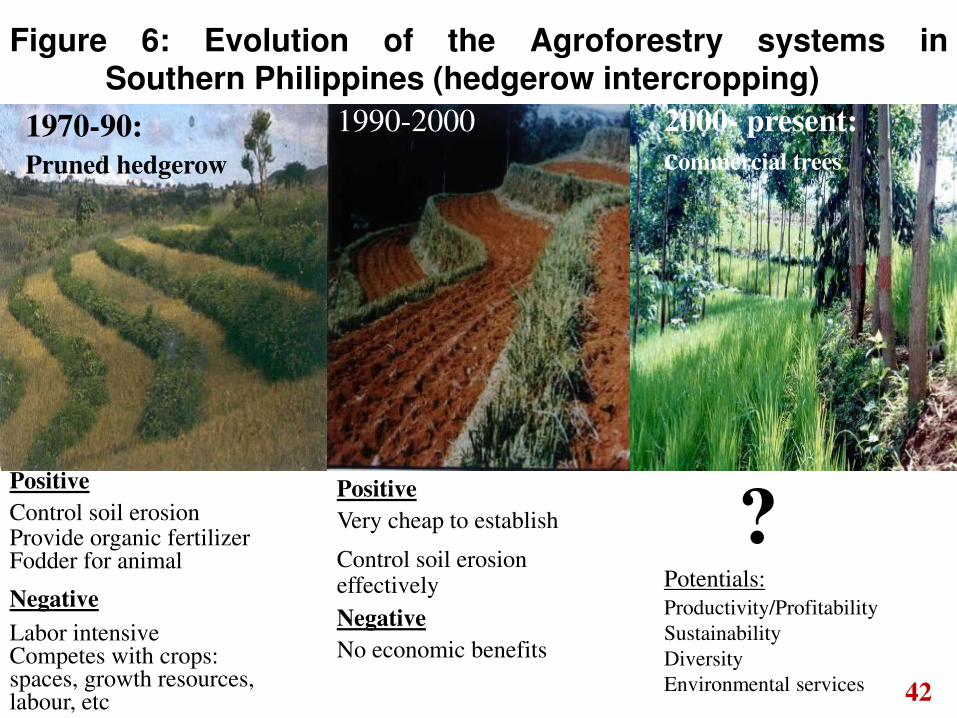
Figure 6: Evolution of the Agroforestry systems in Southern Philippines (hedgerow intercropping)
1970-90: Pruned hedgerow
1990-2000 2000- present:
commercial trees
Positive
Control soil erosion Provide organic fertilizer Fodder for animal
Negative
Labor intensive Competes with crops: spaces, growth resources, labour, etc
Positive
Very cheap to establish
Control soil erosion effectively
Negative
No economic benefits
? Potentials:
Productivity/Profitability
Sustainability
Diversity
Environmental services 42

Table 20: Effect of integrated management of Azolla, Vermicompost and Urea
on yield of Rice
Treatment Grain yield (t ha-1) Straw yield (t ha-1)
T1 Control 4.11e 4.51d
T2 60 kg N + Azolla 5.51a 6.02ab
T3 60 kg N 5.29b 5.93b
T4 Azolla 4.59bc 5.01c
T5 40 kg N + 20 kg N ha-1 VC 5.13b 5.52b
T6 20 kg N + 40 kg N ha-1 VC 4.90c 5.44bc
T7 60 kg N ha-1 VC + Azolla 4.75d 5.18c
T8 40 kg N + 20 kg N ha-1 VC + Azolla 5.07b 5.55b
T9 20 kg N + 40 kg N ha-1 VC + Azolla 5.52a 6.08a
T10 60 VC 4.53e 4.98c
C.D. (P = 0.05) 0.47 0.38
Singh et al. (2005) 43

Table 21: Effect of vermicompost enriched with Rock phosphate on
growth and yield of cowpea (Vigna unguiculata L.) in
Thiruvannanthapuram, Kerala
Sailaja and Usha, (2002)
Treatment No. of pods
plant-1
No of seeds
pod-1
100 seed
weight (g)
Grain yield
(kg ha-1)
T1 Control 7.5c 6.9e 10.66b 585e
T2 30 kg P2O5 ha-1 8.0b 7.1e 11.53b 690e
T3 FYM alone 8.6bc 8.3d 11.91b 817d
T4 Vermicompost alone 9.5b 9.8c 12.03ab 877c
T5 Enriched vermicompost alone 12.4a 12.1a 12.56a 1072a
T6 FYM + 30 kg P2O5 ha-1 9.0b 8.5d 12.06ab 837d
T7 FYM + 15 kg P2O5 ha-1 9.2b 8.8 12.00ab 831d
T8Vermicompost + 30 kg P2O5 ha-1 9.5b 10.2c 12.13ab 882bc
T9 Vermicompost + 15 kg P2O5 ha-1 9.1b 9.9c 12.10ab 879bc
T10 Vermicompost + 30 kg P2O5 ha-1 9.6b 11.1b 12.24ab 909b
T11 Vermicompost + 15 kg P2O5 ha-1 9.7b 11.1b 12.16ab 898bc
T12 FYM + 30 kg P2O5 ha-1 8.7b 9.2cd 11.44b 859c
FYM + 15 kg P2O5 ha-1 8.6bc 9.2cd 11.41b 833d
CD (p = 0.05) 0.7 0.4 0.25 54
Vermicompost and FYM 20 t ha-1 44

Below ground method
Tree roots can
compete with
annual crop
roots for
available water
and nutrients in
the top soil.
45
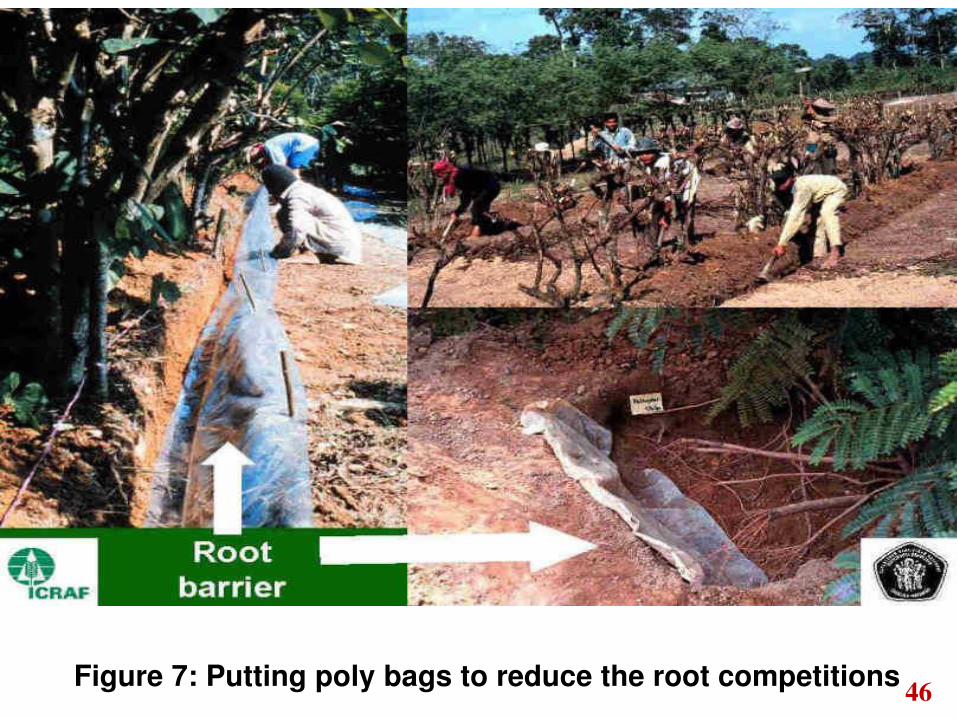
Figure 7: Putting poly bags to reduce the root competitions 46
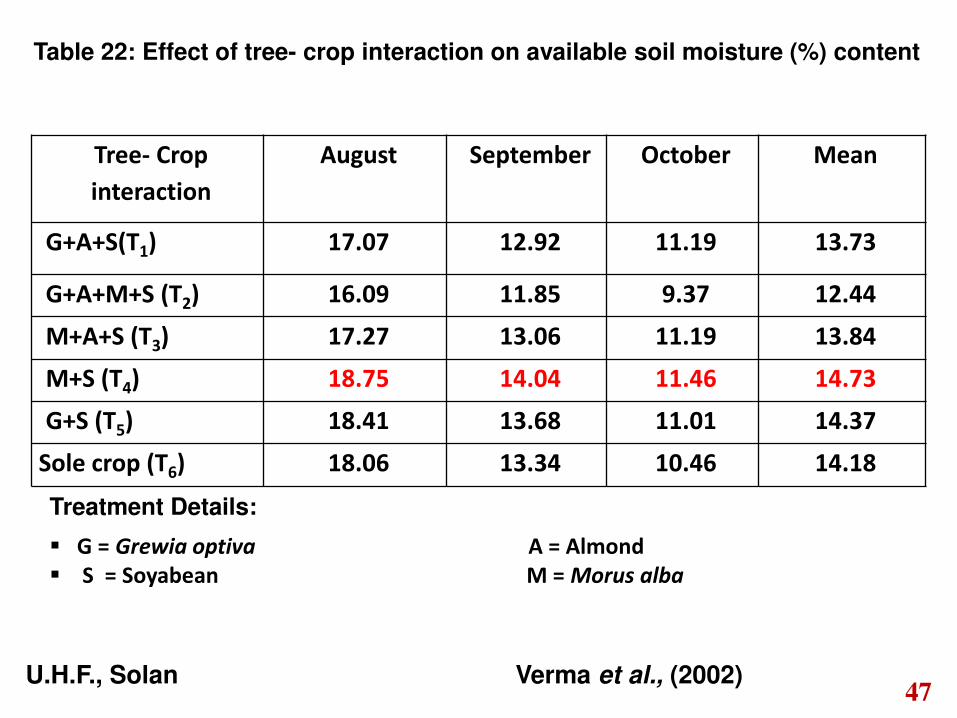
Tree- Crop
interaction
August September October Mean
G+A+S(T1) 17.07 12.92 11.19 13.73
G+A+M+S (T2) 16.09 11.85 9.37 12.44
M+A+S (T3) 17.27 13.06 11.19 13.84
M+S (T4) 18.75 14.04 11.46 14.73
G+S (T5) 18.41 13.68 11.01 14.37
Sole crop (T6) 18.06 13.34 10.46 14.18
Table 22: Effect of tree- crop interaction on available soil moisture (%) content
U.H.F., Solan Verma et al., (2002)
Treatment Details:
G = Grewia optiva A = Almond
S = Soyabean M = Morus alba
47

Manufacture of organic fertilizer because they are concentrated
organic manure.
Improves the soil properties i.e. Physical, chemical and
biological
Deoiled seed cakes are rich in NPK content than bulky
organic manures (Table: Yawalkar and Agrawal (1962)
Quick acting organic manures as C:N ratio is usually narrow
(5-15)
Improve the soil reaction
These are improved in soil structure, water holding capacity,
exchange capacity, seed germination and reduction of soil
erosion.
48

Deoiled cakes Nutrient content (%)
N P K
Non edible deoiled-cakes
Castor cake 4.3 1.8 1.3
Karanj cake 3.9 0.9 1.2
Mahua cake 2.5 0.8 1.2
Safflower cake 4.9 1.4 1.2
Neem cake 5.2 1.9 1.6
Edible deoiled-cakes
Cotton seed cake 6.4 1.5 1.3
Groundnut cake 7.3 2.9 2.2
Linseed cake 4.9 1.4 1.3
Niger cake 4.7 1.8 1.3
Rape seed cake 5.2 1.8 1.2
Sesamum cake 6.2 2.0 1.2
(Yawalkar and Agrawal, 1962) 49

b b
c
b
a
b
c
b
c c d
d d d e
c b c b
a b c c
c d d d
e e f
c
b
d
b
a
c c c
d d d d
e e f
0
50
100
150
200
250
300
350
400
450
T1M1 T1M2 T1M3 T2M1 T2M2 T2M3 T3M1 T3M2 T3M3 T4M1 T4M2 T4M3 T5M1 T5M2 T5M3
Nu
trie
nt
av
ail
ab
ilit
y (
kg
ha
-1)
Potting media
Nitrogen (N) Phosphorus (P) Potassium (K)
Note: T1- Castor seed cake - 4.25 g/polybag , T2- Neem cake-3.34 g/polybag, T3- Cotton seed
cake-3.90 g/polybag, T4- FYM -36.0 g/ polybag, T5- Without seed cake,
M1- Soil: Sand (1: 2), M2- Soil: Sand (2: 1) & M3-Soil: Sand (1: 1).
Vikas Kumar et al., 2014 50
Figure 8. The soil nutrient availability of D. latifoila as influenced by de-oiled cake and
soil media mixture
Conclusion
INM is a practice which optimizes the performance of plants
through augmentations of chemical and biological properties of
soil.
Adopting INM practices in trees can help in boosting the
biomass productivity per unit area.
Effective utilization of a combination of biofertilizers, organic
and inorganic fertilizers not only improves and maintains the soil
fertility but also increased germination parameters, growth and
quality parameters of seedlings in nursery and plantation.
51

Looking onto the future:
Assessment of INM technologies (with secondary/micro nutrients) should be
made only after a thorough inventory of the resources available in a region
including the components of production viz, water management, tillage practices,
moisture conservation practices, managing crop with site specific technology,
biotic & abioic stresses and cropping/farming system.
Agrotechnologies maximizing input use efficiency must form an integral
part of the INM package.
Adaptive research trials conducted on large scale to assess the INM technology
with respect to agronomic productivity, ecological compatibility, economic
profitability and social acceptability is necessary.
Developing awareness among the farmers by extension agencies about the
deteriorating soil health, unsustainable production and environmental pollution due
to non use of organics. 52

D.S.
Hirpara