1 highway engineering ) 401361) chapter 18/ soil text book: traffic & highway engineering...
TRANSCRIPT

1
Highway Engineering ) 401361)Chapter 18/ Soil
Text Book:
Traffic & Highway Engineering Nicholas Garber and Lester Hoel, Third Edition, Brooks/Cole.
Instructor:Dr. TALEB M. AL-ROUSAN

2
Highway Materials
Objective
Describe briefly some of the physical characteristics and quality control tests for soils, aggregates, and bituminous
materials
3
Soil
It has a broad definition. All earth materials (organic & inorganic) that blankets
the rock crust of the earth. Soils are products of disintegration of the rocks of
earth crust. Disintegration: Weathering caused by mechanical and
chemical forces. Mechanical weathering = wind + running water+
freezing and thawing. Chemical weathering = decomposition due to oxidation
+ carbonation + other chemical actions).

4
Soil Types by Formation
Two types = Residual + Transported Residual soils: Weathered in place and lies directly
above the parent material. Transported soils: Those that have been moved by
water, wind, glaciers, and are located far from their parent materials Aeolin soils: Formed by action of wind (Also called wind
blown) and typical fine grained (loes). Glacial soils: Deposit of lightly bonded materials. Sedimentary soils: formed by the action of water (setting of
soil particles from a suspension existing in a river, lake, or ocean) range from beach or river sand to marine clay.

5
Soils Types/ Amount of Organic Materials
Organic soils: Large amount of organic matter. Dark brown to black color and distinctive
odor.Inorganic soils:
Mineral portion predominates

6
Soil Heterogeneity
Soils are known for their normal lack of homogeneity.
This is due to the random process of their formation (vary greatly in their physical and chemical composition) at different locations over the surface of the earth.

7
Soil Types / Surface Texture
Texture of soil can be described by its appearance which depends on the size and shape of the soil particles and their distribution in the soil mass.
Fine-textured soils: Particle sizes < 0.05 mm Silt & clay (particle are invisible with naked eye). Water presence reduces its strength
Coarse-textured soils: Particle sizes > 0.05 mm (particles are visible with naked
eye). Sand & gravel Water presence doesn’t affect its strength.
8
Soil Types / Surface Texture
Distribution of particle sizes can be found using: Sieve analysis for coarse-textured Hydrometer test for fine-textured
Soil Particles shape Round, angular, and flat which are indication of strength Round Coarse textured are generally strong due to
extensive wear that it has been subjected to. Fine-textured soils have generally Flat and flaky particle
which are generally weak. Angular particles are more resistance to deformation as
they tend to lock together while round particle will roll over each other.

9
General Soil Types by Grain Size
I. Sand & Gravel (80 mm gravel to 0.08 mm fine sand). Can be identified visually. Have little or no cohesion. High permeability. Low shrinkage & expansion with change in moisture. Give stability under wheel load when confined. Gravel : used to name natural rounded river bank
aggregates. Crushed gravel or crushed stone: term applied to
products of crushing larger rocks into gravel sizes.

10
General Soil Types by Grain Size
II. Silt Fine grained (intermediate in size between
sand & clay). Low-medium plasticity. Has little cohesion. Considerable shrinkage and absorption. Variable stability under wheel loads. If contains high % of flakes, silt is likely to be
highly compressible and elastic.

11
General Soil Types by Grain Size
III. Clay Very fine grained (0.002 mm or finer). Medium- High plasticity. Extreme changes in volume with
moisture changes. Considerable strength when dry. Impervious to the flow of water

12
More Soil Types
Loam: Agricultural term used for well-graded soil that is productive for plant life (Sandy, silty, or clayey loam depending on predominant size).
Loes: Fine-grained Aeolin soils, uniform size, predominantly silt, low density.
Muck: Soft silt or clay, high organic content, swampy areas and lake bottoms.
Peat: Soil composed of partially decomposed vegetable matter. Has high water content, woody nature, high compressibility, undesirable foundation material
13
Basic Engineering Properties of Soil
Highway engineers must be familiar with those basic engineering properties of soils that influence their behavior when subjected to external loads.
The determination of how soil will behave when subjected to external forces is complicated because soil have heterogeneous properties.
Due to the heterogeneous character, it is recommended that the properties of any given soil depend not only on its general type but also on its condition at the time when it’s being examined.

14
Basic Engineering Properties of Soil Cont.
Phase relation: Soil mass consist of :
solid particles + void spaces (filled with air or/and water).
Soils are three-phase system = solid + water + air.
of different minerals with spaces between them
See Figure 18,2 in text for schematic of three-phases of a soil mass.

15
Basic Soil Properties Cont.
Porosity the ratio of the volume of voids to the total volume
of soil. n = [ Vv / V]
Void Ratio The ratio of the volume of voids to the volume of
solids. e = [ Vv / Vs]
Note that : n = [e / (1 + e)] e = [ n / (1- n)]

16
Basic Soil Properties Cont.
Moisture Content Weight of water contained in a given soil mass
compared with the oven dried weight of the soil, expressed as percentage.
ω(%) = [(Wet wt. – Dry wt.) / Dry wt.] 100%
ω = [Ww / Ws] x100%
In Lab: Representative sample….get wet wt.......oven dry sample…. Get dry wt.
Degree of Saturation The percentage of void spaces occupied by water.
S = [ Vw / Vv] x 100% When void spaces are completely filled with water, the soil is said
to be saturated (i.e. S = 100%)

17
Basic Soil Properties Cont.
Specific Gravity: Ratio of the weight of a unit volume of the
material to the weight of an equal volume of water at approximately 23°C (73.4°F)
Refer to ratio of the unit wt. of soil particles to the unit wt. of water at some known temp.
It ranges numerically between 2.6 & 2.8. Determined by pycnometer method.
18
Basic Soil Properties Cont.
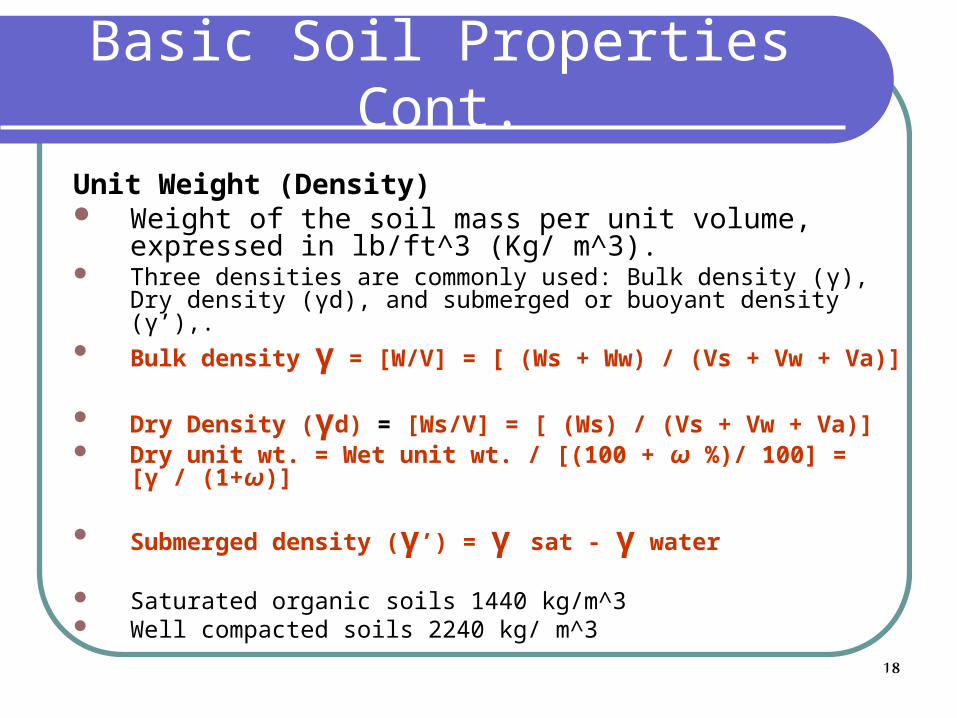
Unit Weight (Density) Weight of the soil mass per unit volume, expressed in
lb/ft^3 (Kg/ m^3). Three densities are commonly used: Bulk density (γ), Dry density
(γd), and submerged or buoyant density (γ’),. Bulk density γ = [W/V] = [ (Ws + Ww) / (Vs + Vw + Va)]
Dry Density (γd) = [Ws/V] = [ (Ws) / (Vs + Vw + Va)] Dry unit wt. = Wet unit wt. / [(100 + ω %)/ 100] = [γ / (1+ω)]
Submerged density (γ’) = γ sat - γ water
Saturated organic soils 1440 kg/m^3 Well compacted soils 2240 kg/ m^3

19
Basic Soil Properties Cont.
Shear Resistance Failure that occur in soil masses due to high loads are
principally shear failures. Shear forces existing in soils are attributed to Internal Friction
& Cohesion
Sr = σ tan Φ + C
Sr : Shear resistance (evaluated in Lab by Unconfined compression test, Direct shear, Triaxial compression, Plate bearing or cone penetration test (in field)).
σ : Normal forcesΦ : Angle of internal frictionC : Cohesion

20
Basic Soil Properties Cont.
Shear Resistance Examples1. Cohesionless Sand (i.e. C = 0)Φ : Includes factors of resistance to sliding and
rolling of soil particles over each other and any interlocking before slip can occur.
Φ Increase as : a) Void ratio decrease (i.e. density of soil mass
increase) b) Rough, angular particles c) well graded sand

21
Basic Soil Properties Cont.
Shear Resistance Examples2. High Cohesion Clay with negligible internal
friction (i.e. Sr = C)C : Resistance to sliding include intermolecular attraction
and cohesion due to surface tension Factors that affect the shear strength of cohesive
soils include: Geologic deposit Moisture content. Drainage conditions density

22
Other Soil Properties
Permeability: Property of soil mass that permits water to flow through it under the action of gravity or some other applied forces.
u = K i …… D’Arcy law u = velocity of water in soil K = coefficient of permeability i = hydraulic gradient = (h/l ) head loss per unit length_ Found by conducting constant head or falling head test and in the field by
pumping test.
Capillarity: Property that permits water to be drawn from a free water surface through the action of surface tension and independent of the forces of gravity. Or it is the movement of free moisture by capillary forces through small diameter openings in the soil mass into pores that are not full of water. Can result in frost heave
Shrinkage: Reduction of volume of soil mass that accompanies a reduction in moisture content when saturated or partially saturated.
23
Other Soil Properties Cont.
Swelling: Expansion in volume of a soil mass that accompanies an increase in moisture content.
Compressibility: Property of soil that permits it to consolidate under the action of applied compressive load.
Elasticity: Property of soil that permits it to return to its original dimensions after the removal of an applied load.
Mr (Resilient Modulus) represent the elasticity of soils

24
Soil Classification for Highway Purposes
Objective behind using any classification system for highway purposes is to predict the subgrade
performance of a given soil on the basis of a few simple tests performed on the soil in a disturbed
condition.
On the basis of these results and their correlation with field experience the soil may be correctly identified and
placed into a group of soils all of which have similar characteristics.
Two methods: AASHTO & Unified Soil Classification System (USCS)

25
Tests for Soil Classification
1. Mechanical Analysis : Sieve analysis, wet sieve analysis, hydrometer analysis.
2. Atterberg LimitsConducted on materials passing #40.Liquid Limit: Min. moisture content at which the soil will
flow under the application of a very small shear force (Soil assumed to behave like liquid).
Plastic Limit: Min. moisture content at which the soil remains in a plastic condition or
: The lowest moisture content at which the soil can be rolled into a thread of (1/8”) diameter without crumbling.

26
Atterberg Limits
Shrinkage Limit (SL): the moisture content at which further drying of soil will result in no additional shrinkage and the volume of soil will remain constant.
Liquid Limit (LL): Min. moisture content at which the soil will flow under the application of a very small shear force (Soil assumed to behave like liquid).
Plastic Limit (PL): Min. moisture content at which the soil remains in a plastic condition.
Plasticity Index (PI): Numerical difference between LL and PL . PI: Indicates the range of moisture content over which the soil is in a
plastic range.PI High……Soil is compressible, cohesion, highly plastic.Sand…….. Cohesion less……….Non Plastic (NP).
27
Atterberg Limits Cont.
Liquidity Index (LI): PL & LL can only be applied to disturbed soil
samples. Its highly possible that the undisturbed soil will not
have the same liquid state as disturbed, therefore the liquidity index is used to to reflect the properties of the natural soil.
LI = (ω – PL) / PI See next slide for LI values and soil states. Soils with LI > 1.0 are known as quick clays which
are relatively strong if undisturbed but become very unstable and can flow like liquid if they are sheared.

28
Consistency Limits

29
Casagrande Liquid Limit Apparatus

30

31
AASHTO Classification System
Classifies soils into 7-groups based on laboratory determination of particle size distribution, liquid limit (LL), and Plasticity Index (PI).
Evaluation of soils within each group is made by means of group index.
AASHTO classification in shown in Table 18.1(Text Book).

32
33
Group Index (G)
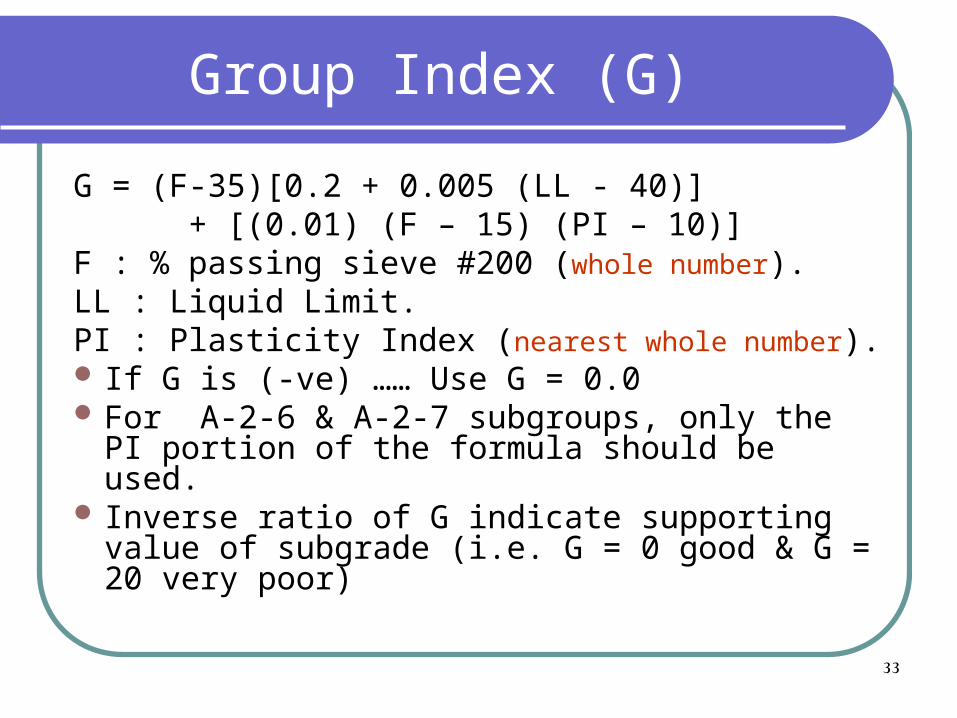
G = (F-35)[0.2 + 0.005 (LL - 40)] + [(0.01) (F – 15) (PI – 10)]F : % passing sieve #200 (whole number).LL : Liquid Limit.PI : Plasticity Index (nearest whole number). If G is (-ve) …… Use G = 0.0 For A-2-6 & A-2-7 subgroups, only the PI
portion of the formula should be used. Inverse ratio of G indicate supporting value of
subgrade (i.e. G = 0 good & G = 20 very poor)

34
Soil Classification Example1
% passing #10 = 100%
% passing # 40 = 85.2%
% passing # 200 = 52.1
LL = 29.2 & PI = 5.0
Solution: G = 1
A – 4 material

35
Soil Classification Example 2
% passing # 200 = 55 %
LL = 40 & PI = 25
Solution: G = 10
A – 6 material
36
Soil Compaction
Soil is used as embankment or subbase materials which should be placed in uniform layers and compacted to high densities.
Proper compaction of the soil will reduce settlement and volume change thus enhancing the strength of the soil layer.
Compaction in field is achieved by hand operated tampers, sheepsfoot rollers, rubber-tired rollers, or other types of rollers.
The strength of the compacted soil is directly related to the max. dry density achieved through compaction.
37
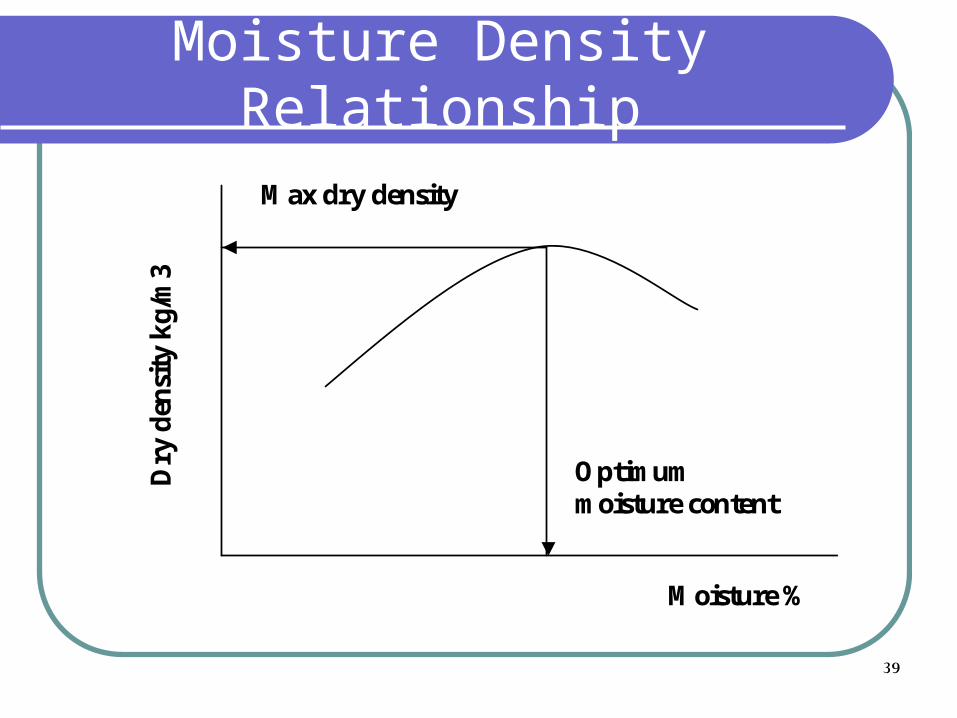
Moisture Density Relationship
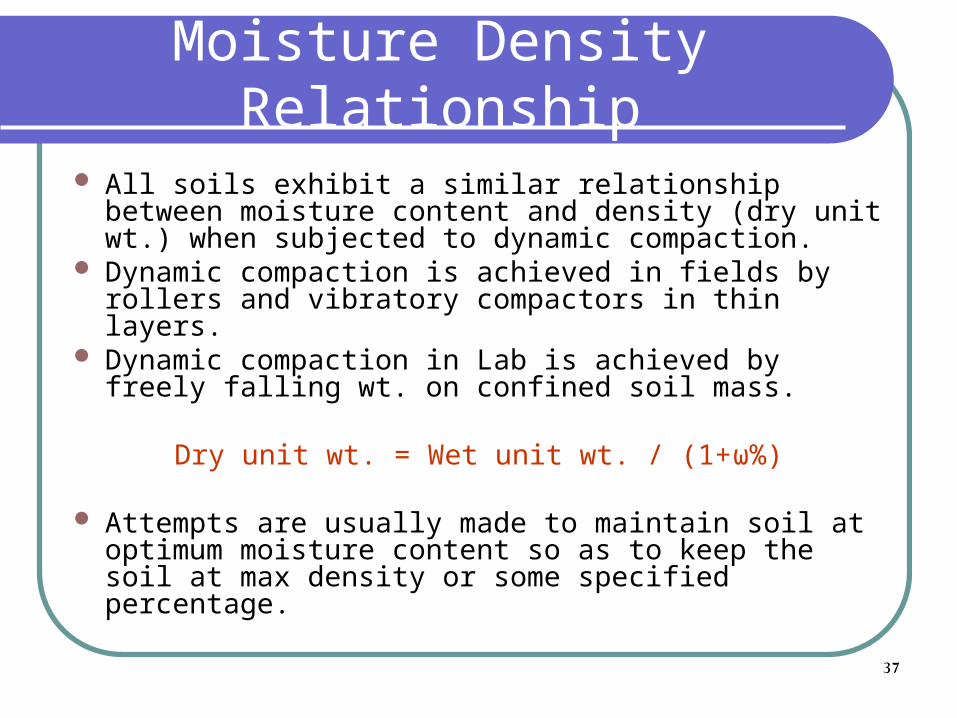
All soils exhibit a similar relationship between moisture content and density (dry unit wt.) when subjected to dynamic compaction.
Dynamic compaction is achieved in fields by rollers and vibratory compactors in thin layers.
Dynamic compaction in Lab is achieved by freely falling wt. on confined soil mass.
Dry unit wt. = Wet unit wt. / (1+ω%)
Attempts are usually made to maintain soil at optimum moisture content so as to keep the soil at max density or some specified percentage.

38
Proctor Test
Standard Proctor (Standard AASHTO T99)
Modified Proctor (Modified AASHTO T180)
Material Pass # 4 Material Pass # 4
4” Diameter mold 4” Diameter mold
3 Layers 5 Layers
5.5 lb (2.5 kg) Hammer with 2” face
10 lb (4.5 kg) Hammer with 2” face
12” Falling distance 18” falling distance
25 blows/ layer or 56 25 blows/ layer or 56
39
Moisture Density Relationship
Moisture %
Dry
den
sity
kg/
m3
Max dry density
Optimum moisture content
40
Effect of Compactive Effort
Moisture %
Dry
den
sity
kg/
m3
Max dry density
Optimum moisture content

41
Compaction Efforts
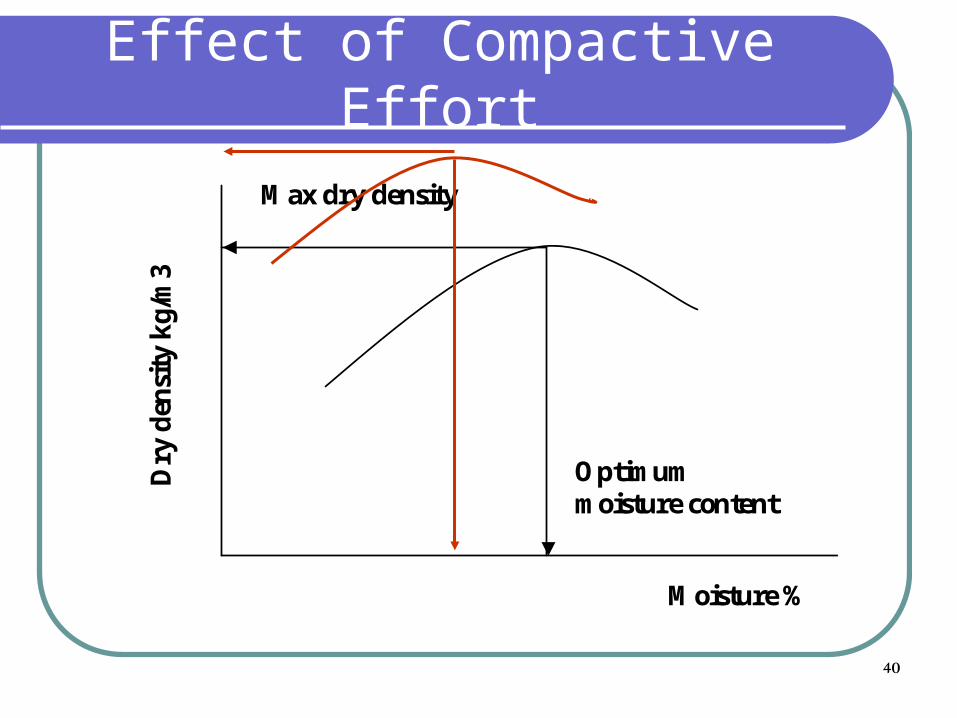
As compactive effort increases, max density will increase and optimum moisture will decrease.
If soil is too dry, more compactive effort is needed to achieve required density.
Type of soil has great effect on density obtained under a given compactive efforts: Moisture content is less critical for clay than plastic
sand. Granular and well graded soils react sharply with
small changes in moisture. Clean, poorly graded, non plastic sands are
relatively insensitive to changes in moisture. Amount of coarse aggregates.

42
Proctor test Procedure
Soil sample pass # 4 with moisture less than optimum.
Compact soil in mold at specified layers. Determine wet unit wt. Select small sample from interior of the
compacted mass to find moisture content. Break soil into new sample. Add water (raise moisture content ) by 1 – 2%. Repeat procedure until decrease is noted in
the wet unit wt, or excess of water is noted.

43
Relation Explanation
When moisture is less than optimum, the soil doesn’t contain sufficient moisture to flow readily under the blows of the hammer.
As moisture increase, the soil flows more readily under the lubricating effect of the additional water, and soil particles move more closer together resulting in density increase. This effect continue until max density.
Further increase tends to overfill the voids, forcing the soil particles to move apart and unit wt. decrease.

44
Control of Embankment Construction
See Table 18.7 in text.% compaction can be found using:
Destructive methodsField cone test using sand, Oil method Balloon method using water.
Nondestructive methodsNuclear equipments
45
Special Soil Tests for Pavement Design
California Bearing Ratio test (CBR): Determine of the load-deformation curve of the soil
in the lab. Using CBR standard testing equipments. Hveem Stabilometer Test:
Determine the resistance value (R) of the soil to the horizontal pressure obtained by imposing avertical stress on a sample of soil.
Both CBR and R values may be used to determine the pavement thickness above the soil to carry the estimated traffic load.

46
CBR
It is a penetration test wherein a standardized piston, having an end diameter of 49.53mm (1.95in), is caused to penetrate the soil at a standard rate of 1.27mm/min (0.05in/min).
The CBR value is calculated as the ratio of the load or stress at 2.54mm (0.1in) penetration to a standard load or stress.
47
CBR Significance
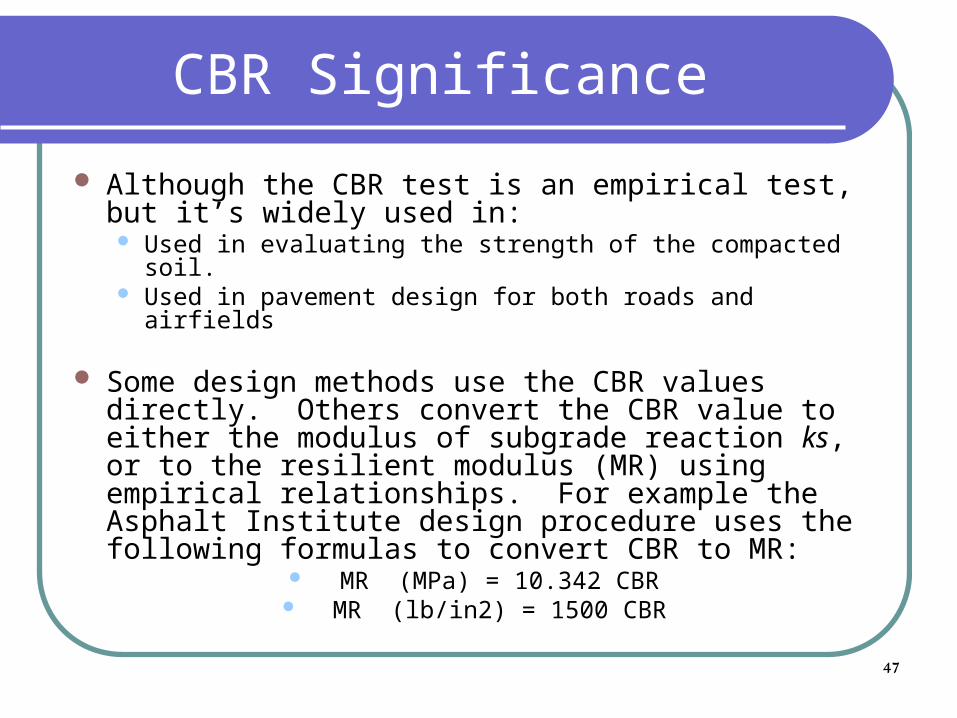
Although the CBR test is an empirical test, but it’s widely used in: Used in evaluating the strength of the compacted soil. Used in pavement design for both roads and airfields
Some design methods use the CBR values directly. Others convert the CBR value to either the modulus of subgrade reaction ks, or to the resilient modulus (MR) using empirical relationships. For example the Asphalt Institute design procedure uses the following formulas to convert CBR to MR:
MR (MPa) = 10.342 CBR MR (lb/in2) = 1500 CBR

48
CBR Test Procedure
The selected sample of subgrade soil (pass Sieve ¾”) is compacted in a mold that is 152 mm (6 in) in diameter and 152 to 178 mm (6 to 7 in) high.
The moisture content, density, and compactive effort used in molding the sample are selected to correspond to expected field conditions (i.e. standard or modified Proctor).
After the sample has been compacted (three molds with 10, 25, and 55 blows /layer), a surcharge weight equivalent to the estimated weight of pavement, base, and subbase layers is placed on the sample, and the entire assembly is immersed-in water for 4 days.

49
CBR Test Procedure
At the completion of this soaking period the sample is removed from the water and allowed to drain for a period of 15 min. The sample, with the same surcharge imposed on it, is immediately subjected to penetration by a piston 49.53 mm (1.95 in) in diameter ( cross section area = 3 square inches) moving at a speed of 1.27 mm/min (0.05 in/min). The total loads corresponding to penetrations of 2.5, 5.0, 7.5, 10.0, and 12.5 mm (0.1, 0.2, 0.3, 0.4, and 0.5 in) are recorded.
A load-penetration curve is then drawn, any necessary corrections made, and the corrected value of the unit load corresponding to 2.5 mm (0.1 in) penetration determined. This value is then compared with a value of 6.9 MPa (1000 lb/in2) required to produce the same penetration in standard crushed rock.
50
CBR Determination
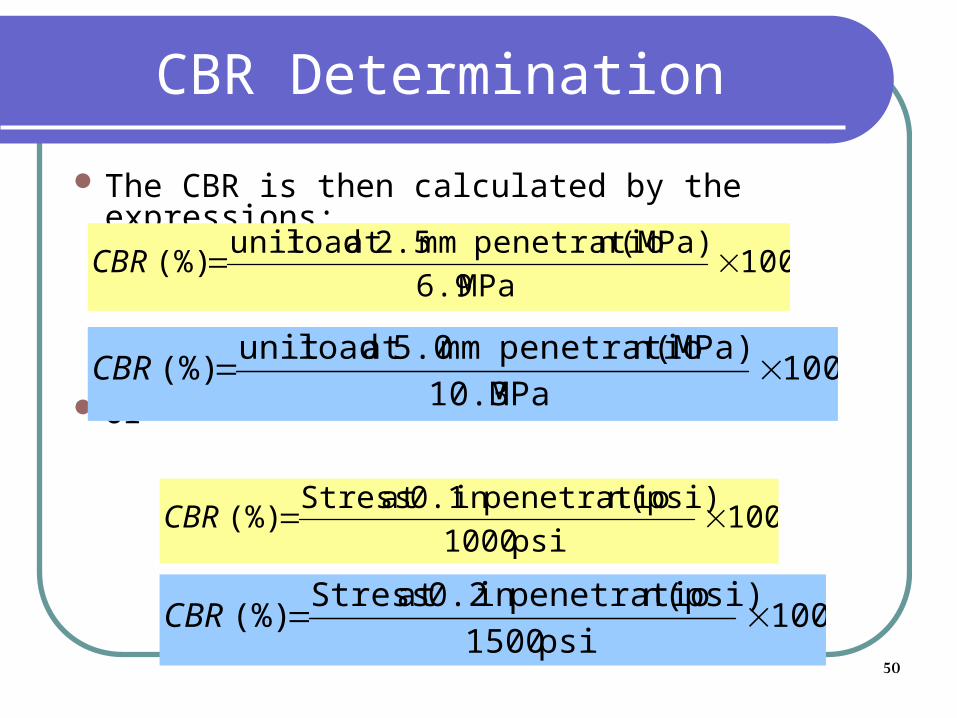
The CBR is then calculated by the expressions:
Or
100MPa6.9
(MPa)npenetratio mm 2.5at loadunit (%) CBR
100MPa10.3
(MPa)npenetratio mm 5.0at loadunit (%) CBR
100psi 1000
(psi)npenetratioin 0.1at Stress(%) CBR
100psi 1500
(psi)npenetratioin 0.2at Stress(%) CBR

51
CBR Determination Cont.
The CBR value is usually based on the load ratio for a penetration of 2.5 mm (0.1 in).
If however, the CBR value at a penetration of 5.0 mm (0.2 in) is higher than the obtained value at 2.5 mm (0.1 in) penetration, the test should be repeated. If the repeated test also yields a larger value, then the CBR at 5.0 mm (0.2 in) penetration should be used.

52
The CBR Plot
Plot the readings of load against the penetration readings and draw a smooth curve through the points.
The curve is normally concave downward, although the initial portion might concave upward due to surface irregularity. In this case, correction should be done by drawing a tangent to the curve at the point of greatest slope. The corrected curve will be used in all further calculations.
From the obtained curve make a computation of the load at the corrected penetration of 2.5mm (0.1 in) and 5.0mm (0.2 in).
The obtained values (in kg) are expressed as percentages of the standard loads of 3000lb and 4500 lb respectively.
100kg 1364
(kg)npenetratio 2.5mmat Load(%) CBR
100kg 2045
(kg)npenetratio 5.0mmat Load(%) CBR

53
CBR Plot
54
CBR Determination Cont.
Usually the value at 2.5mm (0.1 in) is greater than that at 5.0mm (0.2 in) penetration and the former is taken as the CBR value.
If CBR2.5 < CBR5.0 repeat the test on another soil sample. In the case that the second test still gives CBR2.5 < CBR5.0 , then take the CBR value as the value corresponding to 5.0mm penetration.
55
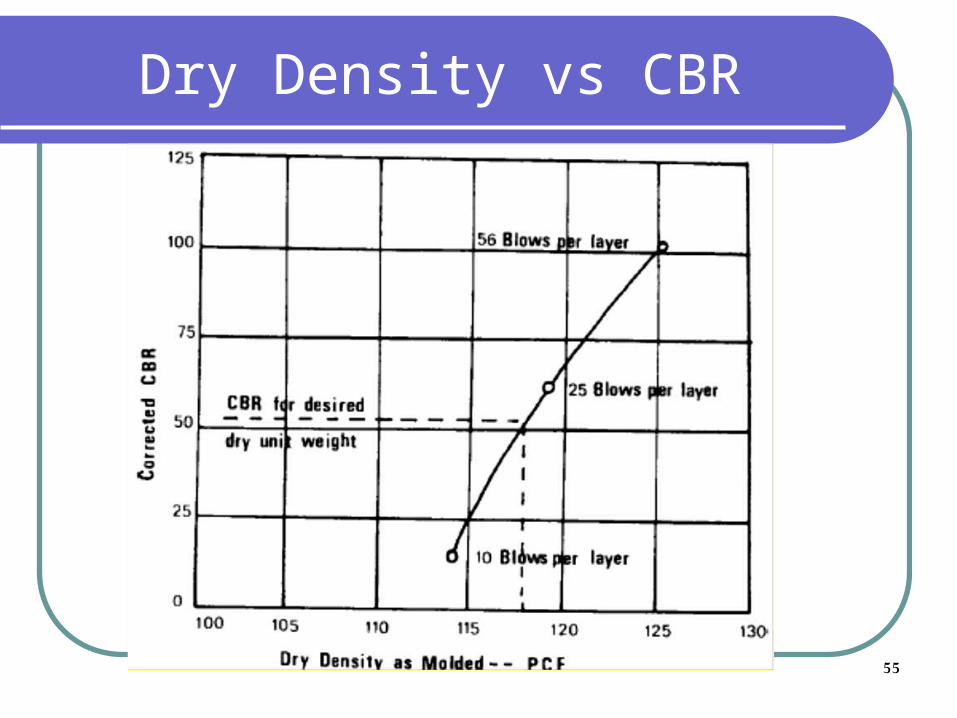
Dry Density vs CBR
56
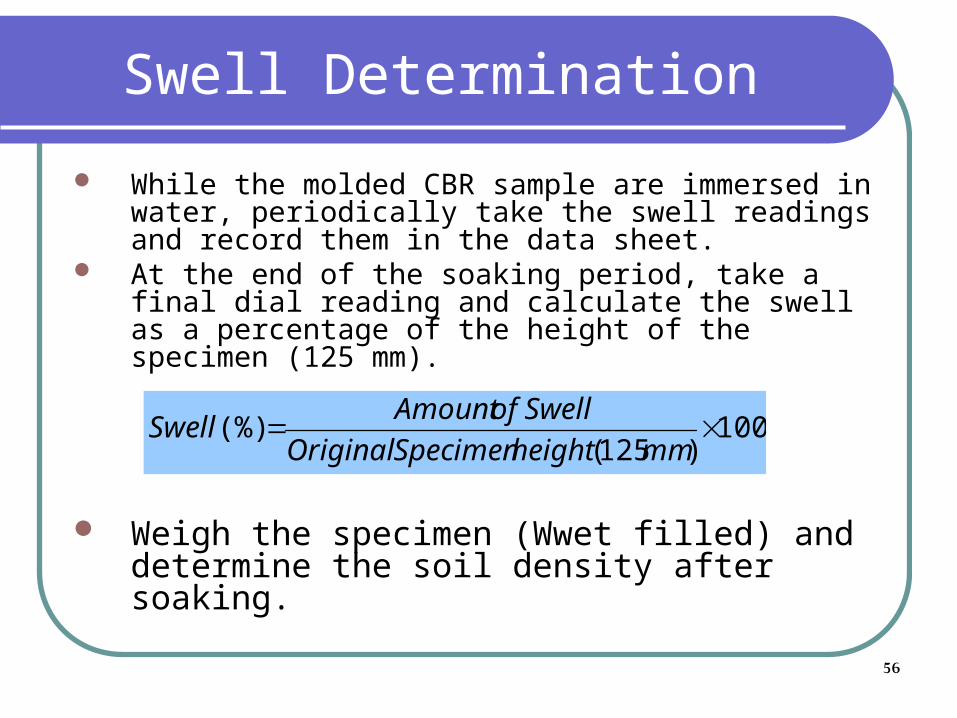
Swell Determination
While the molded CBR sample are immersed in water, periodically take the swell readings and record them in the data sheet.
At the end of the soaking period, take a final dial reading and calculate the swell as a percentage of the height of the specimen (125 mm).
Weigh the specimen (Wwet filled) and determine the soil density after soaking.
100)125(
(%) mmheightSpecimenOriginal
SwellofAmountSwell
57
Frost Action in Soils
Sever damages to pavement layers may result from frost action (Freeze & Thaw).
Due to freezing soil volume increase and causue ice crystals and lenses.
Frost Heave: Distortion or expansion of the subgrade soil or base during freezing temperatures.
During spring (thawing) ice lenses melt which result in water content increase which in turns reducing the strength of the soil causing structural damage ( spring break-up).
58
Frost Action in Soils
Occurrence require: Shallow water table that provides capillary water to
the frost line; Frost susceptible soil (most sever in silty soils
because upward movement of water in silt is faster than in clay);
Ambient temperature must be lower than zero for several days.
Treatment: Remove soil subjected to frost action; Replace with suitable granular backfill to the depth of
frost line; Installation of drainage facilities to lower water table, Restricting truck traffic during spring thaw..