1 high-quality texture reconstruction from multiple scansallen/photopapers/faustobernardini.pdf ·...
TRANSCRIPT

1
High-Quality Texture Reconstructionfrom Multiple Scans
Fausto Bernardini Ioana M. Martin Holly Rushmeier
IBM T. J. Watson Research Center
Abstract
The creation of three-dimensional digital content by scanning real objects has become common practice in graphics applica-tions for which visual quality is paramount, such as animation, e-commerce, and virtual museums. While a lot of attention has beendevoted recently to the problem of accurately capturing the geometry of scanned objects, the acquisition of high-quality textures isequally important, but not as widely studied.
In this paper, we focus on methods to construct accurate digital models of scanned objects by integrating high-quality textureand normal maps with geometric data. These methods are designed for use with inexpensive, electronic camera-based systemsin which low-resolution range images and high-resolution intensity images are acquired. The resulting models are well-suited forinteractive rendering on the latest-generation graphics hardware with support for bump mapping.
Our contributions include new techniques for processing range, reflectance, and surface normal data, for image-based registra-tion of scans, and for reconstructing high-quality textures for the output digital object.
Keywords
Computer Vision, Image Processing, Range Images, Reflectance and Shading Models, 3D Scanning, Texture Acquisition.
I. INTRODUCTION
Three-dimensional scanners are used increasingly to capture digital models of objects for animation, virtual
reality, and e-commerce applications for which the central concerns are efficient representation for interactiv-
ity and high visual quality. Most high-end 3D scanners sample the surface of the target object at a very high
resolution. Hence, models created from the scanned data are often over-tesselated, and require significant
simplification before they can be used for visualization or modeling. Texture data is often acquired together
with the geometry, however a typical system merely captures a collection of images containing the particular
lighting conditions at the time of scanning. When these images are stitched together, discontinuity artifacts
are usually visible. Moreover, it is rather difficult to simulate various lighting conditions realistically or to
immerse the model in a new environment. The scanning system used to perform the experiments described
in this paper is equipped with a high-resolution digital color camera that acquires intensity images under
controlled lighting conditions. Detailed normal and albedo maps of the surface are computed based on these
images. By comparison, geometry is captured at lower resolution, typically enough to resolve only the major
shape features. The benefits of such a system are twofold. First, it allows for the use of relatively inexpen-
sive hardware by eliminating the need for dense geometric sampling and by taking advantage of digital colorIBM T. J. Watson Research Center, P.O. Box 704, Yorktown Heights, NY 10598. email: [email protected],

2
Fig. 1. The visual quality of textures for the model of a statue obtained from multiple overlapping scans is enhanced with ourimage-based fine-registration and weighted averaging techniques. The left image shows the final texture reconstructed from 20overlapping scans. The two small images illustrate a detail from a highly carved area of the hair before (top) and after (bottom)image-based registration. The fine chisel marks become clearly visible after the registration.
cameras that are quickly gaining in resolution while dropping in price. Second, the generated models are
more readily usable in a visualization or modeling environment which exploits the hardware-assisted bump
mapping feature increasingly available in commercial-grade 3D accelerators.
In general, the issue of acquiring and reconstructing high-quality texture maps has received less attention
than the issue of capturing high-quality geometry. In this work, we build upon existing techniques developed
for texture acquisition, reconstruction, and image registration to generate maps of high visual quality for the
scanned objects. Particularly because the noise and inaccuracies of our scanner are greater than those of
high-end systems, we wish to exploit in full all the geometric and image information acquired to improve the
visual quality of the final representation.
In this paper we introduce a novel texture reconstruction framework that uses illumination-invariant albedo
and normal maps derived from the calibration-registered range and intensity images. The albedo maps are
used in a unique way to refine a geometry-only registration of the individual range images. After the range
data is integrated into a single mesh, the resulting object is partitioned into a set of patches. New textures
are reconstructed by projecting the maps onto the patches and combining the best data available at each point
using weights that reflect the level of confidence in the data. The weighted averaging lowers noise present in
the images, while the fine registration avoids blurring, ghosting, and loss of fine texture details, as shown by

3
into a single mesh
Surface
Aregistration
F
C
Texture-to-geometry
B
D
E
Integration of scansillumination invariants
Texture map
Computation of
imagesRange Intensity
images
parameterization
Registration
synthesis
Fig. 2. The sequence of steps required for the reconstruction of a model from multiple overlapping scans.
the results in Figure 1.
II. RELATED WORK
A variety of techniques are used to capture digital models of physical objects, including CAT scans [1]
and structure from motion applied to video sequences [2]. We restrict our discussion to methods involving
instruments that capture range images (in which each pixel value represents depth) and intensity images (in
which each pixel is proportional to the incident light.) A detailed summary of such methods can be found
in [3].
The basic operations necessary to create a digital model from a series of captured images are illustrated in
Figure 2. After outliers are removed from the range images, they are in the form of individual height-field
meshes (scans.) Step A is to align these meshes into a single global coordinate system. In high-end systems
registration may be performed by accurate tracking. For instance, the scanner may be attached to a coordinate
measurement machine that tracks its position and orientation with a high degree of accuracy. In less expensive
systems an initial registration is found by scanning on a turntable, manual alignment, or approximate feature
matching [4], [5]. The alignment is then refined automatically using techniques such as the Iterative Closest
Point (ICP) algorithm of Besl and McKay [6] or the technique of Chen and Medioni [7]. Recent multiview
registration algorithms include [8], [9].
In step B the scans are integrated into a single mesh. The integration may be performed by zipper-
ing/stitching [10], [11], isosurface extraction from volumes [12], [13], or interpolating mesh algorithms [14]

4
applied to error-corrected points.
To relate a texture map to the integrated mesh, in step C the surface is parameterized with respect to a 2D
coordinate system and texture coordinates are interpolated between mesh vertices. A simple parameterization
is to treat each triangle separately [13], [15] and to pack all of the individual texture maps into a larger texture
image. However, the use of mip-mapping in this case is limited since adjacent pixels in the texture may not
correspond to adjacent points on the geometry. Another approach is to find patches of geometry which are
height fields that can be parameterized by projecting the patch onto a plane. Stitching methods [1] use this
approach by simply considering sections of the scanned height fields as patches. Marschner [16] subdivides
the surface into individual patches by starting with seed triangles distributed over the object, and growing
regions around each seed. Harmonic maps are found to establish a 2D coordinate system for each patch, so
individual patches need not be height fields.
Parallel to acquiring geometry, intensity images are captured to obtain information about the albedo of the
surface. Such images may be recorded with electronic or traditional cameras or by using polychromatic laser
technology [15]. In step D, these images are aligned to the corresponding geometry. In some cases the image
acquisition is decoupled from the geometry acquisition [16], [17], [1]. The camera intrinsic and extrinsic
parameters for the images are estimated by manual or automatic feature matching. The advantage is that
acquisition modalities that cannot capture surface reflectance can be used for capturing geometry.
In most cases, however, the alignment is performed by calibration. Geometry and intensity are captured
simultaneously from scanners with a measured transformation between sensing devices. The resolution of the
intensity image may be the same as that of the range image or even higher. When the resolution is the same,
texture mapping is unnecessary since a color can be assigned to each vertex. Nevertheless, such a represen-
tation is inefficient and geometric simplification is typically performed before the surface parameterization
step.
The main benefit of obtaining intensity and range images simultaneously is that the intensity information
can be used in the registration process in step A. Various approaches have been developed to use intensity
images in registration. Johnson and Kang [13] use color as an additional coordinate in the ICP optimization.
This avoids local minima in the solution in areas that have no geometric features, but have significant varia-
tions in the intensity. For models with pronounced geometric and intensity features, the method has proven
to be very effective. A drawback is having to combine position and color data with different ranges and error

5
characteristics. For subtle feature variations, these can cause one type of data to erroneously overwhelm the
other. Schutz et al. [18] introduce empirically computed normalization factors to define a coupling distance
that accounts for position, normal and color differences. A number of researchers have used information
in intensity images to avoid the spatial search required by ICP. These methods use scans that have been
aligned approximately, generally by manual means. Weik [19] uses intensity and intensity gradient images
from the approximately aligned scans after they are transformed into a common camera view. Locations of
corresponding points on overlapping scans are inferred based on the difference between intensity values at
a given pixel and the gradient at that pixel. Pulli [20] performs a full image registration to find correspond-
ing points. Similar to Weik’s method, one intensity image is projected into the camera view of the second,
using the approximate alignment. A planar perspective warping [21] of the first image is then computed to
match the rendered image of the second scan. For each corresponding pixel of the two images, under the
computed transformation, a pair of points from the two scans is generated. A least-squares optimization is
then performed to compute a registration matrix. Both Weik’s and Pulli’s methods require operations on the
full high-resolution intensity images. A high degree of overlap is required, and scan-to-scan variability in
illumination introduces error. Fine scale geometry is matched only if these details are revealed by lighting in
the images. Both methods are effective if there are substantial albedo variations in the scans that dominate
illumination variations. Gagnon et al. [22] avoid full image operations in an alternative non-ICP method for
using intensity images to refine an initial manual alignment. Pairs of range images are aligned manually by
marking three points on overlapping intensity images. The locations of the matching points are refined by
searching their immediate neighborhoods using image cross-correlation [23]. A least-squares optimization
follows to determine a general 3D transformation that minimizes the distances between the point pairs.
After intensity images are aligned to geometry, illumination invariant maps are computed to estimate the
surface albedo (step E.) The number of scans versus the number of intensity images, as well as the resolution
of the scans compared to the resolution of the images are issues that have to be considered. For a small
number of scans and a large number of intensity images obtained under calibrated lighting conditions, the full
Bidirectional Reflectance Distribution Function (BRDF) can be estimated [24]. If many scans are required to
represent an object and only a few high-resolution intensity images are captured per scan, photometric stereo
techniques can be used to estimate Lambertian reflectance [25]. Alternatively, if the range and intensity
images have the same resolution, the geometry can be used to compute reflectance from a single image [26].
6
In step F the final texture is reconstructed. The illumination invariant images are mapped onto the inte-
grated, parametrized surfaces. The main concerns at this step are that the final texture is as sharp as the best
input images, that seams between scans or texture patches are not visible, and that all information available
is fully exploited to maximize the signal-to-noise ratio. To maintain sharpness, Rocchini et al. [1] propose
a stitching approach that uses a single illumination invariant map at any given surface point. Continuity in
sharp features between adjoining maps is maintained by a local texture adjustment at texture boundaries. This
requires high-quality input maps that have no visible noise and no scan-to-scan chromatic differences. Map
adjustment techniques such as this, as well as deghosting methods for image mosaics [21], decouple texture
from geometric variations. This may cause noticeable artifacts when these variations are correlated (e.g.,
dents and scratches that reveal underlying material with different reflectance properties.) To avoid jumps in
color appearance and to reduce noise, Johnson and Kang [13] combine information from multiple overlap-
ping scans. Marschner [16] estimates Lambertian reflectance at each texture pixel in the reconstruction step,
using every data value from captured images covering the point. Each data value is weighted by the relative
angle to the camera view, light source and specular direction in the captured image. In this case, if texture
alignment is imperfect blurring or ghosting artifacts may be generated. Pulli et al. [20], [27] do not explicitly
form texture images associated with the geometry, but propose a dynamic, view-dependent texturing algo-
rithm which determines a subset of the original images taken from view direction close to the current view,
and synthesizes new color images from the model geometry and input images.
III. OVERVIEW
In this section we present our approach to each of the steps described in the previous section. Our goal
is to produce a model of high visual quality, rather than to acquire a dense geometric representation. We
propose two new techniques for the registration and reconstruction steps, respectively. They are outlined in
this overview and will be described in more detail in Sections IV and V.
A. Scan Acquisition and Processing
We use a scanning system in which range and intensity images are obtained simultaneously and are regis-
tered via a priori calibration. The scanner is a hybrid multi-view/photometric system built around the Visual
Interface Virtuoso [28]. Range images are captured by a multi-camera stereo system which projects a striped
pattern onto the target object. The system produces range images that are converted to individual triangle

7
meshes (scans) with an approximate intersample distance of 2 mm and submillimeter depth accuracy.
Intensity images are recorded under five calibrated lighting conditions and have a much higher resolution
than the geometric scans (between 0:25 mm and 0:5 mm intersample distance, depending on surface orienta-
tion.) The intensity images are processed to extract RGB albedo, normal, and weight (confidence) maps for
each scan. This photometric processing involves using the approximate knowledge of the underlying geom-
etry to account for imperfections in the measuring system, as well as global compensation of variations in
camera response [25], [29].
We refer to the images that contain the RGB albedo and normals generically as texture maps. Holes may
occur in these textures where photometric processing fails whenever fewer than three light sources are visible
at a point. In such regions, the textures are filled using the normals of the underlying mesh and data from just
one or two of the associated intensity images. A weight map encodes a degree of confidence in the data at
each pixel of a texture map. The weight includes the effects of distance to the camera, angle to the camera
view direction, whether a photometric normal was computed, and the distance to the edge of the scan. The
boundaries between photometric values and underlying values are smooth, as are the corresponding weights,
so that abrupt changes in the final texture will not be visible.
The acquisition of intensity images aligned with the corresponding range images and the photometric
processing just described correspond to steps D and E in Figure 2.
B. Registration
We begin the scan registration step A with a pairwise manual alignment to estimate the position of each
scan with respect to a global coordinate system. This step is performed at the same time with the removal of
outliers in the range data. Next, the initial manual registration is refined using a variation of the multiview
ICP algorithm [8]. Our ICP solution uses geometric information only.
Like Johnson and Kang [13] and Schutz et al. [18], we seek to produce high-quality texture maps by com-
bining information from multiple overlapping scans at each pixel. However, we avoid the mixing of position
and color, and the use of empirical weights, by performing an image-based alignment after the geometry-
based registration has converged. Similarly to Gagnon et al. [22], we use image matching to refine the
alignment. However, our method is different in a number of critical ways. First, since this is a refinement
step, we compare images that are reprojected onto the same camera view to account for geometric distortions.

8
Second, instead of manually selecting three points to be matched, we have implemented an automatic selec-
tion procedure that identifies a larger number of samples in areas with significant image structure. Finally, we
use images that are consistent with each other by processing them according to methods described in [29].
Our registration method has some similarities with the one proposed by Pulli [20]. Pulli also uses images to
find matching points pairs, projects them back onto the range scans to find corresponding surface points, and
then minimizes a functional of their pairwise distances. However, rather than relying on a full-image warping
transformation to find matching points on overlapping scans, we do local searches on small regions based on
image correlation. The local searches avoid the need for a hierarchical image registration method, and bound
the adjustments to a small search range, since the initial alignment has already been improved by ICP. Also,
rather than considering each pair of corresponding pixels as a valid match, we automatically select a subset of
sample pixels in areas rich of detailed image features (derived from the albedo or normal maps) to minimize
the occurrence of false matches.
The basic idea of our image-based registration algorithm is to use detail maps computed from the texture
maps to generate highly-accurate pairs of corresponding points on the scans by matching their image neigh-
borhoods. The scans are considered for alignment one at a time, in random order, while the others remain
fixed, as suggested in [8]. Given a scan to be aligned, sample points are selected automatically on its detail
map in regions where interesting features are present. The detail maps corresponding to all overlapping scans
are then projected onto the current image plane and a search is performed in the neighborhood of each sample
point for a best match in the overlapping areas of the projected maps. The resulting pairs of image point sam-
ples are back-projected onto their corresponding geometry and used to compute a rigid transformation that
minimizes the sum of squared distances between corresponding points. The transformation thus obtained is
applied to the moving scan, and the process is repeated until a convergence criterion is satisfied.
C. Surface Reconstruction and Parameterization
Having obtained a tightly aligned set of scans, we proceed to integrate them into a seamless triangle mesh
(step B.) We use a technique called Ball Pivoting [14], which efficiently generates a triangle mesh by inter-
polating an unorganized set of points.
Next, we determine a suitable surface parameterization (step C) to allow for an efficient computation of
texture maps that cover the entire object without overlapping. Since we wish to use mip-mapping techniques,

9
we partition the surface into patches and assign one texture image to each patch, rather than parameterizing
the mesh one triangle at a time.
Our texture reconstruction technique uses all the acquired data at each point as opposed to stitching together
pieces of the initial scans. Hence, we do not use the initial scans as texture patches. Instead, a new partition
of the geometry into height-fields is computed by a greedy approach that begins with a number of seed
triangles and grows the surface regions around them until a maximum patch size or maximum slope deviation
is reached. Each patch is then projected in the direction which maximizes its total projected area, providing
a simple local parameterization.
More sophisticated techniques for partitioning a mesh into patches suitable for texture computation have
been proposed, see for example [30], [31], [16], [32]. Any method that provides a mapping from the texture
image assigned to the patch onto the patch geometry could be used in our approach, and it is reasonable to
expect that any of the methods cited above would generate a smaller number of patches and a more even
allocation of texture pixels per surface area than what we obtain with our simple greedy strategy. However,
we found that for the datasets used in our experiments our technique provided patches of sufficient quality.
D. Texture Reconstruction
Once the model is partitioned into height-field patches, albedo and normal maps are reconstructed for
each patch by combining the information in all overlapping textures (step F.) For each pixel of a texture to
be computed, all textures that have information about its albedo and normal are identified. Corresponding
values are combined using a weighting scheme that takes into account the confidence in each value while
avoiding discontinuities at patch-to-patch and scan-to-scan transitions (see also Figure 9.) Occlusions must
also be handled correctly. In practice, since the amount of data involved in this phase may be quite large, it is
important to organize the required computations efficiently.
IV. IMAGE-BASED REGISTRATION
The goal of image-based registration is to improve the geometry-based alignment of scans that make up
a 3D object by taking into account additional information contained in the high-resolution detail maps com-
puted for each scan.
Detail maps are generated from albedo and normals maps. Depending on the application, they may be sin-
gle or multi-channel images. In our experiments we use grey-scale albedo maps and geometry-invariant maps

10
Di
Dm
Sm
Si
~Di
Sj
Dj
~Dj
(a)
Dm
p1i
Ci
Di
Cm
Dj
p1m
SjSi
Sm p2j
p2m
Cj
b2j
~Di
~Dj
t2j
t2mt1m
t1ib1
i
(c)
~Di
Dm
~Dj
(b)
Fig. 3. (a), (b) Example and (c) two-dimensional diagram of the image-based registration algorithm. Three scans are involved:scan Sm (blue), with corresponding detail map Dm is being registered to the two overlapping scans S i (red) and Sj (green).Detail maps Di andDj are mapped onto their respective geometry and rendered onto the image plane of cameraC m, generatingreprojected images ~Di and ~Dj (the three images Dm, ~Di and ~Dj are shown cropped in (b). ~Di and ~Dj are drawn with a littleoffset in (a) and (c) for illustrative purposes.) In the ideal case of perfect scans and no registration error, these images would bepixel-by-pixel the same as Dm in the areas of overlap. Assuming some registration error, we consider a set of sample pointson detail map Dm, distributed in areas where interesting image features are present. Starting with a sample point t 1m on Dm,corresponding to geometric point p1m on Sm, we search in the neighborhood of the corresponding point t 1i on ~Di for a pointb1i that maximizes image correlation (initial and final points are shown with yellow and magenta dots, respectively, on theimages in (b).) The point b1i is then back-projected onto the scan Si into p1i . The process is repeated to generate a set of pairsof corresponding points (pkm; p
kh); h = i; j. A rigid transformation is computed that minimizes the sum of squared distances
between corresponding points.

11
derived from the normals. The proposed image-based registration algorithm makes use of image matching
to identify pairs of corresponding points on the high-resolution detail maps. Subsequently, these pairs are
back-projected onto the scans and used to derive a rigid transformation that minimizes the distance between
corresponding points in a least-squares sense [6].
Figure 3 illustrates our method using a simple example consisting of three scans S i, Sj , and Sm, with their
respective detail maps, Di, Dj, and Dm, and cameras Ci, Cj, and Cm. For the purposes of this example,
Si and Sj are fixed, while Sm is being moved to achieve better alignment with respect to Si and Sj. The
detail maps Di and Dj are rendered onto the image plane of camera Cm, generating projected detail maps
~Di and ~
Dj , respectively. Ideally, in the absence of noise and errors in the initial alignment, the images Dm,
~Di, and ~
Dj would be identical in the areas of overlap. A sample point selected in such an area in one image
would identify precisely the same feature in all overlapping images. In practice, corresponding features may
appear shifted due to misalignment. Let t1m be a sample point on Dm with pixel coordinates (u; v) that are
inside the overlap region of Dm with ~Di and let t1i be the point on ~
Di with the same coordinates: t1i = (u; v).
A correlation-based search is conducted in a neighborhood of t1i to identify a point b1i for which the image
area around it best matches the area around t1
m. The points t1m and b1
i are back-projected onto p1
m 2 Sm and
p1
i 2 Si, respectively, and the pair (p1m; p1
i ) is saved. The process is repeated for other sample points on Dm
where there is overlap with either ~Di or ~
Dj . Finally, after all samples are processed, the pairs (pkm; pkh=i;j) are
used to compute a rigid transformation that improves the position of scan Sm with respect to Si and Sj in the
least-squares sense [6].
Our image-based registration algorithm is described in pseudocode in Figure 4. The input consists of the
scans to be registered with their initial registration matrices, as well as their corresponding detail maps, depth
maps, bounding boxes, and lists of sample points. In addition, the calibration parameters of the intensity-
capture camera are considered known. These parameters include the position and orientation of the camera
in the local frame of each scan, its field-of-view angle, and the pixel size of the output image. Knowledge of
these parameters allows us to define a camera that matches the view of the capture camera. With the exception
of the bounding boxes which are stored in memory for the entire duration of the alignment, all other data is
loaded on demand. The output is a set of registration matrices (one per scan) that defines the new, more
accurate alignment. The main steps of the algorithm are described next.

12
Input: scans to be registered: S1; : : : ; SN
initial registration matrices: M1; : : : ;MN
detail maps: D1; : : : ; DN
depth maps: Z1; : : : ; ZN
bounding boxes: B1; : : : ; BN
lists of sample points: L1; : : : ; LN
where Lm = f(tm; pm)jtm 2 Dm; pm 2 Smg
camera parameters: C
Output: accurate registration matrices: M1; : : : ;MN
Algorithm Image-Based Registration
1. read B1; : : : ; BN
2. while (convergence criterion not satisfied)3. (m1; : : : ; mN) = random permutation (2; : : : ; N)
4. for (m = m1; : : : ; mN)
5. Cm = camera (Mm; C)
6. register scan (m;Cm)
Procedure register scan (m;Cm)
1. read Dm; Zm; Lm
2. for (i = 1; : : : ; N) and (i 6= m)
3. read Si; Di
4. if (Bm intersects Bi)
5. ~Di = project scan (Si; Di; Cm)
6. Omi = compute image overlap (Dm;~Di)
7. if (jOmij > min overlap)8. for ((tm; pm) 2 Lm) and (tm 2 Omi)
9. ti = tm
10. bi = find best match (tm; Dm; ti;~Di)
11. pi = back project (bi; Si; Cm) 2 Si
12. insert pair (pm; pi; pairs list)13. if (jpairs listj � 3)
14. Mm = compute rigid transform (pairs list)
Fig. 4. Skeleton of the image-based registration algorithm.
A. Selection of Sample Points
Prior to the actual alignment, a list of sample points Lm is computed for each scan Sm. We use image-
processing techniques to identify points tkm; k = 1; : : : ; nm in the detail map Dm. The goal is to select points
in areas of rich content that pertain to matching by cross-correlation, rather than to identify precise image
features. In addition, for each tkm we also compute the corresponding point pkm 2 Sm under the perspective

13
projection defined by the capture camera.
(a) (b)
(c) (d)
Fig. 5. Selection of sample points from detail maps using edge detection.
We have experimented with a variety of techniques, including selection based on moment invariants and
several edge-detection methods. For the test cases described in this paper, we used an edge-detection tech-
nique which is illustrated in Figure 5. Figure 5(a) shows a portion of the original detail image. First, the
detail image is slightly blurred using a Gaussian filter to reduce the noise. Next, horizontal and vertical Sobel
operators are applied separately to the blurred image. The two resulting edge images are combined into one
that contains at each pixel the largest of the corresponding values at that pixel (see Figure 5(b)). A threshold-
ing operation is applied next to filter out regions with low gradient variation. The threshold value is selected
automatically, based on the image histogram. The result is a bitmap that contains values of one where the
gradient variation is above the threshold and zero elsewhere (see Figure 5(c)). This bitmap is used to select
sample points in regions where edges have been identified. Before selecting the points, all pixel values are set
to zero where the corresponding weights in the weight map are below a given confidence threshold, since we
do not want any samples in these areas (see Figure 5(d).) For the actual selection, a regular grid is superim-
posed onto the bitmap to ensure that selected points are distributed over the entire image. The first non-zero
pixel encountered in each grid cell in row-wise order is selected as the sample point corresponding to that cell
14
and is inserted into the list of samples. During alignment, points in the list are considered in random order to
ensure that all meaningful regions of the image contribute to the registration process. We emphasize that we
use the edge bitmap solely for the purpose of selecting samples. The actual image matching is performed by
cross-correlation on the detail maps in the neighborhood of each sample point.
B. Projection of Detail Maps
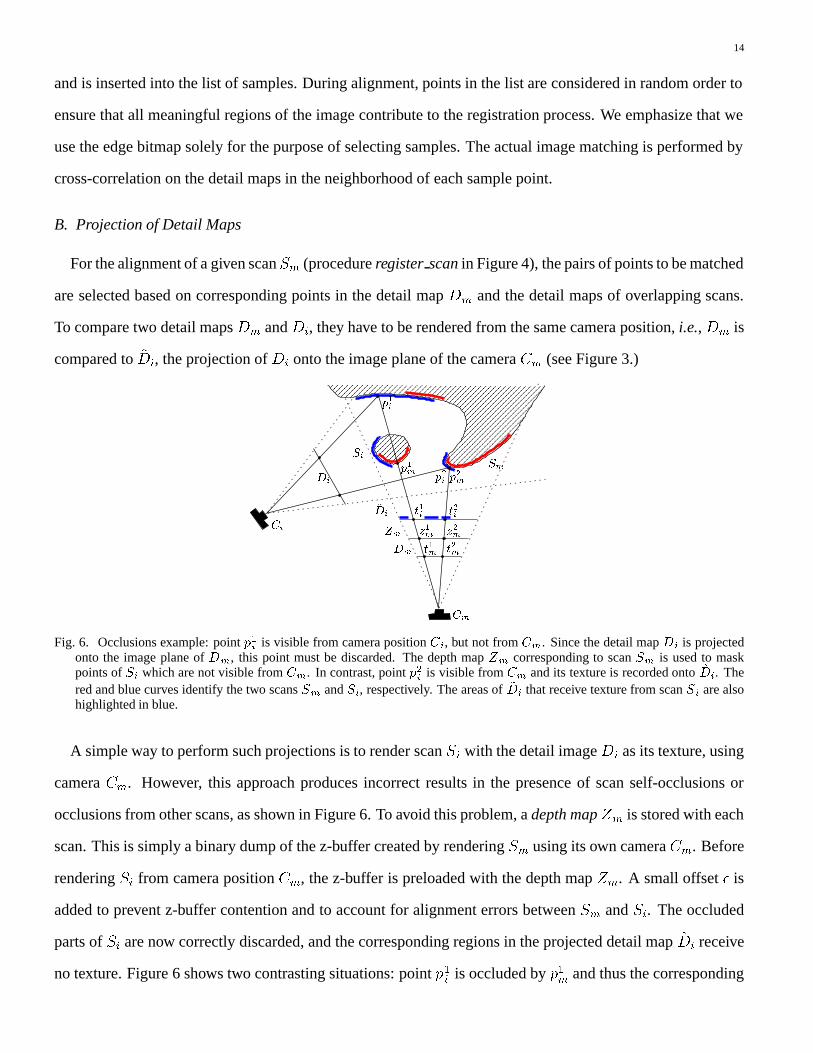
For the alignment of a given scan Sm (procedure register scan in Figure 4), the pairs of points to be matched
are selected based on corresponding points in the detail map Dm and the detail maps of overlapping scans.
To compare two detail maps Dm and Di, they have to be rendered from the same camera position, i.e., Dm is
compared to ~Di, the projection of Di onto the image plane of the camera Cm (see Figure 3.)
��������
���������
���������
������������������
������
�������������������������������������������������������
�������������������������������������������������������
Ci
Dm
Zm
~Di
Di
Cm
z2m
t1i
t2m
p1i
t2i
z1m
t1m
p2mp1m
p2i
SmSi
Fig. 6. Occlusions example: point p1i is visible from camera position Ci, but not from Cm. Since the detail map Di is projectedonto the image plane of Dm, this point must be discarded. The depth map Zm corresponding to scan Sm is used to maskpoints of Si which are not visible from Cm. In contrast, point p2i is visible from Cm and its texture is recorded onto ~Di. Thered and blue curves identify the two scans Sm and Si, respectively. The areas of ~Di that receive texture from scan Si are alsohighlighted in blue.
A simple way to perform such projections is to render scan Si with the detail image Di as its texture, using
camera Cm. However, this approach produces incorrect results in the presence of scan self-occlusions or
occlusions from other scans, as shown in Figure 6. To avoid this problem, a depth map Zm is stored with each
scan. This is simply a binary dump of the z-buffer created by rendering Sm using its own camera Cm. Before
rendering Si from camera position Cm, the z-buffer is preloaded with the depth map Zm. A small offset � is
added to prevent z-buffer contention and to account for alignment errors between Sm and Si. The occluded
parts of Si are now correctly discarded, and the corresponding regions in the projected detail map ~Di receive
no texture. Figure 6 shows two contrasting situations: point p1i is occluded by p1m and thus the corresponding

15
pixel t1i 2 ~Di remains black, whereas point p2i is visible from Cm and thus t2i receives texture values from Di.
C. Identification of Matching Pairs
Given a pair of detail maps Dm and ~Di, both rendered from the same camera position Cm, the algorithm
first computes an overlap bitmap Omi. A pixel in this bitmap is set to one if and only if both Dm and ~Di have
a weight at that pixel that is larger than the confidence threshold. If there is sufficient overlap, the sample
points (tm; pm) 2 Lm for which tm is inside the overlap region are processed one-by-one, until a prespecified
number of matching pairs is found or until all points have been processed.
������������������������������������������
������������������������������������������
������������������������������������
������������������������������������
���������
���������
������������������������������������
������������������������������������
���������
���������
���������
���������
Fig. 7. Sliding-window search for the point maximizing cross-correlation between image neighborhoods. The search starts atpoint ti 2 ~Di, marked in black. The green area is cross-correlated to the corresponding area in Dm. The operation is repeatedfor areas centered in all pixels within the search region outlined in red. The pixel corresponding to the center of the maximumcross-correlation area is marked in red. The search window is moved to the new center and a new iteration starts.
For a given sample (tm; pm) such that tm 2 Dm has pixel coordinates (u; v), we define a point ti 2 ~Di with
the same coordinates. Ideally, tm and ti mark the same image feature on Dm and ~Di, i.e., scans Sm and Si are
perfectly aligned. In practice, ti may be slightly offset with respect to the feature marked by tm due to errors
in the alignment of the scans. Our strategy is to search in the neighborhood of ti for another point bi that is
a better match for tm, and to use the corresponding point pi = back projection(bi; Si; Cm) 2 Si as the
match of pm in the final alignment. The search for bi is performed using a sliding-window cross-correlation
approach which is outlined in Figure 7.
The radius of the search region for the cross-correlation and the size of the correlation window are de-
fined taking into account the resolution of the scanning system and the maximum registration error after the
geometry-based alignment. In our case, given a linear intersample distance of the scanner of approximately
2 mm and a residual error after the geometry-based alignment of less than 4 mm, we define a conservative
radius of 7 mm (i.e., 14 pixels assuming a 0:5 mm resolution in the detail maps) for the search area around
each point ti. A cross-correlation is performed in this area using a window of 15 mm radius (i.e., 30 pixels),
also a fairly conservative choice to ensure that significant features around each point are included.
The location within the search area that yields the highest value for the correlation coefficient defines the

16
best match position bi. Only pairs for which the correlation value is above a certain threshold are used to
refine the alignment. We compute the correlation coefficient of n data points (tkm; tki ) according to Pearson’s
formula [23], �2 = s2
mi=smmsii, where
smm =X
Dm(tkm)
2�
1
n
hXDm(t
km)i2
;
sii =X
~Di(t
ki )2�
1
n
hX~Di(t
ki )i2
;
smi =X
Dm(tkm)
~Di(t
ki )�
1
n
XDm(t
km)X
~Di(t
ki ):
Cross-correlation is known to be a time-consuming procedure. For efficiency, we replace an exhaustive search
in a 14-pixel radius area with a sliding window approach that is faster to compute. We restrict the radius of
the search area to 3 pixels and we allow it to slide in the direction of the best correlation for a predefined
number of times. An obvious problem with this method is that the search may terminate by finding a local
maximum of the correlation function and thus the global maximum is never reached. We compensate for this
drawback by identifying a larger number of points than are actually needed. An alternative solution is to allow
the search window to slide out of a local maximum with a given probability dependent on the surrounding
values.
D. Multiple Iterations and Convergence
Our image-based registration method generally performs multiple iterations to allow each scan to adjust its
position with respect to its neighbors. The number of iterations is typically determined by some convergence
criterion. In our experiments, we use as a measure of convergence the change in the mean square error
between consecutive iterations. If this change is small, the algorithm stops. At each iteration, the scans are
considered for alignment one-by-one, in random order. The scan currently being aligned moves in search for
a better position with respect to all other scans, which are considered temporarily fixed. Culling is used to
speed up the procedure by considering only scans with intersecting bounding boxes.
This image-based registration algorithm has several advantages. It takes into account high-resolution in-
formation in the captured images to fine-tune the geometric alignment of scans. The fine-tuning is performed
via image matching involving a simple and efficient cross-correlation procedure that is restricted to small
areas around selected sample points. Specific image features need not be identified. Any image processing

17
technique that allows for finding feature-rich regions in the input images is well-suited for the selection of
the sample points. The sampling method presented is completely automatic and requires no manual interven-
tion. Occlusions are handled simply and efficiently by comparing depth values stored in precomputed depth
buffers.
There is a potential residual registration error due to the lower resolution and line-of-sight error of the
range scans. The effect of these two sources of error is alleviated by two factors. First, these errors are
randomly distributed around a mean value, so that using a large number of sample points, and having multiple
overlapping scans at each point, tends to average out the error. Second, both errors are nearly perpendicular
to the image plane of the albedo and normal maps, and contribute minimally to ghosting artifacts in the
resulting textures. The line-of-sight error affects all methods that rely on reprojecting matching image points
on the corresponding range scans as a step in computing the registration transformation [13], [19], [20], [22],
although it has greater impact in our system given our assumption of lower resolution range scans compared
to the intensity images. In applications where a greater registration accuracy in the direction normal to the
surface must be achieved, the normal maps could be used to locally refine the geometry obtained from the
range scans, and to estimate with increased resolution the position of points on the surface. Increased accuracy
could also be obtained by interleaving steps of registration and line-of-sight error correction. These ideas will
be explored in future work.
V. TEXTURE RECONSTRUCTION
The goal of texture reconstruction is to generate seamless texture maps covering the model. To make
maximum use of the acquired data, texture maps are recalculated based on the integrated mesh. For a given
scan, albedo and normal data may now be obtained in regions where there is no geometry available from that
scan.
The input to the texture reconstruction process consists of the collection of height-field patches that form a
partition of the model surface and the finely registered scans with the recomputed albedo, normal, and weight
maps. A mapping between geometry and corresponding textures is defined as an orthogonal projection in the
direction that maximizes the projected patch area (see Figure 9.)
The pixel size of a texture is determined based on the projected size of the corresponding patch and on a
user-specified parameter representing the desired number of pixels per unit of length. All individual texture

18
(a) (b) (c) (d)
Fig. 8. Calculation of the final weight map for a section of a scan used to reconstruct the model in Figure 1. (a) Intensity image.(b) Preliminary weight map based on the ratio of projected to true area for each pixel. (c) Preliminary weight map based on thephotometric calculations. (d) Final weight image.
maps are combined using the weight maps defined in Section III. Figure 8 shows the calculation of the
final weight map for a section of a scan as the combination of two preliminary weight maps. For illustrative
purposes, the relative weights in each weight image are shown with a color map with black as zero, and the
hues from blue to red corresponding to increasing non-zero weights. Figure (a) shows a section of an intensity
image for one of the scans used to create the model in Figure 1. Figure (b) shows the first preliminary weight
map for this section of the scan based on the ratio of projected to true area for each pixel. This ratio is
computed as the cosine of the surface normal to the camera direction divide by the square of the distance to
the camera. Occlusion boundaries, such as the tip of the nose in this image, are detected, and a weight of zero
is assigned to each occlusion boundary. By setting these pixels to zero, occlusion boundaries are treated in
the same manner as the edges of the scan. Figure (c) shows the second preliminary weight map based on the
photometric calculations. If a surface normal can be computed from photometric data for a pixel it is assigned
a high weight. If such a normal can not be computed, but there is an underlying surface normal value, a much
lower, but non-zero value is assigned. A smooth transition (indicated by the transition from red to blue in
Figure (c)) is applied between the photometric and non-photometric areas, so that there will not be a sudden
spatial break in the contribution of this scan to the final result. The values of Figure (b) and (c) are multiplied
and rescaled to form the final weight image, shown in Figure (d). The last step in computing the final weights
in (d) is to compute a smooth transition from areas with non-zero weight, to the edge values which have a
weight of zero. The weights are stored as 0-255 values. The quantization accounts for the large black area in
the lower right of this example, where the values in both images (b) and (c) are low, and the values are further
reduced by the transitioning to the nose silhouette edge. Because weights are generated per scan and not per

19
��������
����
���������������������������������������
���������������������������������������
aCi Cj Ck
P
p
Ai ai ajAj
ak Ak
A
��������
����
����������
�����������������������������������������������������������������
�����������������������������������������������������������������
������������
Ci
a1
a1i
Ai
P
A
p2
z1i
a2
p1
a2iz2i
Zi
(a) (b)
Fig. 9. (a) Two-dimensional diagram of texture remapping. An albedo map A is computed for patch P , which is parameterized asa height field onto the image plane of A. Three scans S i, Sj , and Sk have camera frusta intersecting patch P and are consideredfor the remapping. For each pixel a on textureA, consider the corresponding point p on patch P . This point projects onto pointsai, aj and ak in the albedo maps of the three scans, and onto w i, wj and wk in the corresponding weight maps. The resultingalbedo value for a is (wiai + wjaj + wkak)=(wi + wj + wk). This weighting scheme avoids discontinuities at transitionsbetween patches or between scans within the same patch. (b) Examples of occlusions.
patch, transitions across patch boundaries are not visible. Also, since the weights for each scan decrease with
distance to the scan border, scan-to-scan boundaries are not visible.
The computation of a value for each texture pixel is illustrated in Figure 9. In this example, an albedo map
A is computed for patch P . The three scans Si, Sj, and Sk have camera frusta that intersect the bounding box
of patch P and are considered for the reconstruction.
A straightforward solution to the remapping problem is to use ray-casting. However, the time required to
process all ray-mesh intersections makes this procedure prohibitively expensive. Another method to combine
the albedo maps of the three scans into A is to define an orthogonal camera and then render P multiple
times, with each of the albedo and weight maps from the three scans as its texture. The rendered images are
accumulated using weighted averaging. This approach is also inefficient and produces incorrect results in the
presence of occlusions. Consider the situation in Figure 9(b): points p1 and p2 receive values from the maps
associated with scan Si, even though they are occluded when rendered from camera position Ci. Similar to
the method described in Section IV depth values are used to filter out occluded points.
Specifically, to compute an albedo map A for a patch P , accumulation buffers for albedo, normals, and
weights are created and initialized. P is then sampled at points corresponding to each pixel of A. This can
be done by defining an orthogonal camera that matches the projection of P onto A, then scan-converting the
primitives in patch P into a z-buffer.
We use the inverse viewing transformation to convert each pixel (u; v) and the associated depth to world

20
coordinates that are stored in a point map. We start the processing of each overlapping scan by loading its
albedo, normal, weight and depth map, and by defining a perspective camera matching the actual camera that
was used to capture the intensity images. We then consider each pixel of A. We retrieve the corresponding
patch point from the point map, and use the viewing transformation to map the point into pixel coordinates
(u; v) and its depth relative to the perspective camera. We compare the depth of the point with the value stored
in the depth map Zi for the scan. If the depth is larger than the stored value (minus a small offset to account
for numerical errors), then the point is occluded and therefore no longer considered. Otherwise, we fetch the
albedo, normal and weight values at location (u; v) in the corresponding maps, and update the accumulation
buffers. After all the scans have been processed, accumulated albedo and normal values are divided by the
accumulated weight.
By pre-sampling the patch geometry and by fetching values from all maps simultaneously, computations
are streamlined. Occlusions are handled simply and efficiently by comparing depth values in precomputed
depth buffers. Image and geometric information are loaded on demand, to allow processing of large sets of
scans that do not fit in memory. The only information stored for all scans is the view-frustum of the capture
camera and the bounding box of each patch to allow view frustum culling at the bounding box level.
VI. RESULTS
We demonstrate our new methods with results for three qualitatively different test objects. One is a 26 cm
tall vase, with few geometric features and sharp surface color variations. The second is a 12 cm tall piece
of clay with no surface color variations, but a lot of small scale geometric variations. The third object is a
section of a large marble statue with subtle variations in both geometry and color, shown in Figure 1.
For the vase, the major challenges are accurate alignment for an object with few geometric features, and
maintainance of sharp textures. The use of image-based alignment improves the geometric alignment, and
maintains sharpness, as illustrated in Figure 10. Twenty scans, shown textured-mapped with the original
intensity images in Figure (a), were acquired to cover the full vase. Figure (b) shows a portion of one of the
five captured intensity images for one of the scanner positions. The acquired image contains both specific
illumination and some noise. The albedo map obtained from the five calibrated images, mapped on the
corresponding scanned geometry, is shown in Figure (c). The effects of illumination have been removed,
but noise remains. Figure (d) shows the albedo maps reconstructed from multiple overlapping scans, using

21
(a)
(b)
(c)
(f) (g)
(d)
(e)
Fig. 10. The vase dataset. (a) The twenty scans used to reconstruct the vase. (b) Intensity image captured by the scanner.(c) Computed albedo map. (d) Reconstructed albedo without image-based registration. (e) Same as (d) with image-basedregistration. (f) Photograph of the vase. (g) Rendering of a computer model of the vase reconstructed from the twenty scans.

22
geometry-based registration only. The noise has been damped out by averaging, but the imperfect alignment
causes ghosting artifacts. The same map after the image-based registration refinement is shown in Figure (e).
On the 2 to 3 mm thick grapes stems ghosting artifacts are far less apparent. A photograph of the vase, lit
by a small lamp from the front, is shown in Figure (f). The full reconstructed vase, lit from the direction
of the viewpoint with parallel light, is rendered in Figure (g). Note the sharpness of the texture achieved
through image-based alignment. We did not attempt to simulate the directional characteristics of the small
lamp illuminating the vase in the photograph. The viewing parameters are similar, but not identical. The
20 scans used comprise a total of 418 thousand range data points. The final reconstructed model is a 200
thousand triangle mesh. We started with 150 sample points per detail image. For each scan, we limited the
number of matching pairs used to a maximum of 10 in each region of overlap with another scan. For this
test, the image-based registration required a total of 115 minutes on a 450MHz Pentium II, using 35MB of
memory and six iterations. Texture reconstruction was completed in 30 minutes.
The clay object is shown in Figure 11. Figures (a) and (b) show intensity images associated with two
scans of the clay. The two scans have one side of the block in common. The common side can be identified
visually, however the illumination for the two scans is quite different. For these scans, that show no albedo
variations, detail images were computed from the normals images. To obtain values that were independent
of the coordinate system, the detail images were computed by taking the dot product of the normal at each
pixel with the average of normals in a small neighborhood. The resulting detail images for the two scans are
shown in Figures (c) and (d). Since the common surface between the two scans is almost flat, ICP did a poor
job aligning the scans, as shown in the result in Figure (e) (lit from the far left to reveal relief.) Comparing
the small features in Figure (e) with the features apparent in the original intensity images shows considerable
ghosting. Figure (f) shows the result after the texture alignment. Most of the ghosting has been removed, and
the true features are more clearly defined.
The views required to scan the section of statue in Figure 12 were restricted by its setting shown in Fig-
ure (a). The 20 scans captured are shown in Figure (c). For the statue, the major challenge is obtaining sharp
details in the normals maps that indicate small toolmarks in the geometry as seen in the black and white pho-
tograph in Figure (b). Figures (d) and (e) show a comparison of the reconstructed normals maps before and
after image-based registration. Illumination from a glancing angle accentuates the fine details on the head
ornament. The details are clearer after the image-based registration. The reconstructed model can be relit us-

23
(a) (c) (e)
(b) (d) (f)
Fig. 11. (a), (b) Intensity images associated with two scans of a clay object. (c), (d) Detail images for the two scans, derived fromthe normal maps. (e) Result after ICP registration (lit from the far left to reveal relief.) (f) Result after the texture alignment.Most of the ghosting has been removed, and the true features are more clearly defined.
ing the detail normals and albedo. Figures (f) and (g) show the statue under two different lighting conditions.
The 20 scans used comprise a total of 207 thousand range data points. The final reconstructed model is a
200 thousand triangle mesh. As for the vase, we started with 150 sample points per detail image and limited
the number of matching pairs used to a maximum of 10 for each pair of overlapping scans. Image-based
alignment of the 20 source scans completed in 148 minutes for six iterations. Texture reconstruction required
an additional 35 minutes.
VII. CONCLUSIONS
We have demonstrated an approach for generating texture maps for the efficient representation of scanned
objects with high visual quality. We use a novel image-based registration algorithm that takes into account
high-resolution information in the captured images. The geometric alignment is improved by matching image
structure around automatically selected points. The refined alignment allows us to reconstruct sharp textures.

24
(a) (b)
(c)
(d) (e)
(f) (g)
Fig. 12. (a) Black and white photograph showing the section of statue in Figure 1 in context. (b) Black and white photographshowing a closeup view. (c) The 20 scans used to reconstruct the head. (d), (e) Normal map before and after image-basedregistration. (f), (g) The reconstructed model of the statue rendered under two different lighting conditions.

25
Our texture reconstruction approach uses a unique weighting scheme to combine the best information at each
texture pixel that reduces noise and which eliminates the evidence of any scan or patch boundaries.
We are considering future work in a number of directions. We are exploring the interleaving of geometric
ICP, image-based alignment, and line-of-sight error correction in our pipeline. We conjecture that accounting
for line-of-sight errors during alignment will produce better registration results. We also seek to improve our
method for generating texture patches. Currently, we use a relatively simple greedy approach that does not
guarantee an optimal set of patches.
While three-dimensional scanning is being used with increasing frequency, it remains a relatively expensive
and labor-intensive process. Significant research is required to refine the entire acquisition and model building
pipeline. Focusing on methods that employ inexpensive hardware to produce high visual quality will make
this technology accessible to a much broader audience.
REFERENCES
[1] C. Rocchini, P. Cignoni, C. Montani, and R. Scopigno, “Multiple textures stitching and blending on 3D objects,” in Proceedings of the 10thEurographics Workshop on Rendering, Granada, Spain, June 1999.
[2] M. Polleyfeys, R. Koch, M. Vergauwen, and Luc Van Gool, “Hand-held acquisition of 3D models with a video camera,” in Proceeding ofthe Second Intl. Conf. on 3-D Digital Imaging and Modeling, Ottawa, Canada, October 1999, pp. 14–23.
[3] F. Bernardini and H. Rushmeier, “The 3D model acquisition pipeline,” in Eurographics 2000 State of the Art Reports. EurographicsAssociations, 2000, To appear.
[4] G. Roth, “Registering two overlapping range images,” in Proceeding of the Second Intl. Conf. on 3-D Digital Imaging and Modeling,Ottawa, Canada, October 1999, pp. 191–200.
[5] D. Zhang and M. Hebert, “Experimental analysis of harmonic shape images,” in Proceedings of the Second Intl. Conf. on 3-D DigitalImaging and Modeling, Ottawa, Canada, October 1999, pp. 209–219.
[6] P. J. Besl and N. D. McKay, “A method for registration of 3-D shapes,” IEEE Transactions on Pattern Analysis and Machine Intelligence,vol. 14, no. 2, pp. 239–256, Feb. 1992.
[7] Y. Chen and G.G. Medioni, “Object modeling by registration of multiple range images,” Image and Vision Computing, vol. 10, no. 3, pp.145–155, 1992.
[8] R. Bergevin, M. Soucy, H. Gagnon, and D. Laurendeau, “Towards a general multiview registration technique,” IEEE Transactions onPattern Analysis and Machine Intelligence, vol. 18, no. 5, pp. 540–547, May 1996.
[9] Kari Pulli, “Multiview registration for large data sets,” in Proceedings of the Second Intl. Conf. on 3-D Digital Imaging and Modeling,Ottawa, Canada, October 1999, pp. 160–168.
[10] M. Soucy and D. Laurendeau, “A general surface approach to the integration of a set of range views,” IEEE Transactions on PatternAnalysis and Machine Intelligence, vol. 17, no. 4, pp. 344–358, Apr. 1995.
[11] G. Turk and M. Levoy, “Zippered polygon meshes from range images,” in Proceedings of SIGGRAPH ’94 (Orlando, Florida, July 24–29,1994), Andrew Glassner, Ed. ACM SIGGRAPH, July 1994, Computer Graphics Proceedings, Annual Conference Series, pp. 311–318,ACM Press, ISBN 0-89791-667-0.
[12] B. Curless and M. Levoy, “A volumetric method for building complex models from range images,” in SIGGRAPH 96 Conference Proceed-ings, Holly Rushmeier, Ed. ACM SIGGRAPH, Aug. 1996, Annual Conference Series, pp. 303–312, Addison Wesley, held in New Orleans,Louisiana, 04-09 August 1996.
[13] A. Johnson and S. Kang, “Registration and integration of textured 3-D data,” in Proceedings of the Intl. Conf. on Recent Advances in 3-DDigital Imaging and Modeling, Ottawa, Canada, May 1997, pp. 234–241.
[14] F. Bernardini, J. Mittleman, H. Rushmeier, C. Silva, and G. Taubin, “The ball-pivoting algorithm for surface reconstruction,” IEEETransactions on Visualization and Computer Graphics, vol. 5, no. 4, pp. 349–359, October-December 1999.
[15] M. Soucy, G. Godin, and M. Rioux, “A texture-mapping approach for the compression of colored 3D triangulations,” The Visual Computer,vol. 12, pp. 503–513, 1996.
[16] Stephen R. Marschner, Inverse rendering for computer graphics, Ph.D. thesis, Cornell University, 1998.[17] P. Neugebauer and K. Klein, “Texturing 3D models of real world objects from multiple unregistered photographics views,” Computer
Graphics Forum, vol. 18, no. 3, pp. C–245–C–256, 1999, Proceedings of EUROGRAPHICS ’99.[18] C. Schutz, T. Jost, and H. Hugli, “Multi-feature matching algorithm for free-form 3D surface registration,” in Proceedings of International
Conf. on Pattern recognition, 1998, held in Brisbane, Australia, August 1998.[19] S. Weik, “Registration of 3-D partial surface models using luminance and depth information,” in Proceedings of the Intl. Conf. on Recent
Advances in 3-D Digital Imaging and Modeling, Ottawa, Canada, May 1997, pp. 93–100.[20] Kari Pulli, Surface reconstruction and display from range and color data, Ph.D. thesis, Dept. of Computer Science and Engineering, Univ.
of Washington, 1997.

26
[21] R. Szeliski and H. Shum, “Creating full panoramic mosaics and environment maps,” in Computer Graphics Proceedings, 1997, AnnualConference Series. Proceedings of SIGGRAPH 97, pp. 251–258.
[22] E. Gagnon, J.-F. Rivest, M. Greenspan, and N. Burtnyk, “A computer-assisted range image registration system for nuclear waste cleanup,”IEEE Transactions on Instrumentation and Measurement, vol. 48, no. 3, pp. 758–762, 1999.
[23] R. C. Gonzalez and R. E. Woods, Digital Image Processing, Addison-Wesley, 1993.[24] Y. Sato, M. Wheeler, and K. Ikeuchi, “Object shape and reflectance modeling from observation,” in Computer Graphics Proceedings, 1997,
Annual Conference Series. Proceedings of SIGGRAPH 97, pp. 379–388.[25] H. Rushmeier, F. Bernardini, J. Mittleman, and G. Taubin, “Acquiring input for rendering at appropriate level of detail: Digitizing a Pieta,”
in Proceedings of the 9th Eurographics Workshop on Rendering, Vienna, Austria, June 1998.[26] M. Levoy et al., “The digital Michelangelo project: 3D scanning of large statues,” in Computer Graphics Proceedings, 2000, To appear.[27] Kari Pulli, Habib Abi-Rached, Tom Duchamp, Linda G. Shapiro, and Werner Stuetzle, “Acquisition and visualization of colored 3D objects,”
in Proceedings of International Conf. on Pattern recognition, 1998, pp. 11–15, held in Brisbane, Australia, August 1998.[28] “Visual Interface Inc.,” www.visint.com.[29] H. Rushmeier and F. Bernardini, “Computing consistent normals and colors from photometric data,” in Proceeding of the Second Intl. Conf.
on 3-D Digital Imaging and Modeling, Ottawa, Canada, October 1999, pp. 99–108.[30] M. Eck, T. DeRose, T. Duchamp, H. Hoppe, M. Lounsbery, and W. Stuetzle, “Multiresolution analysis of arbitrary meshes,” in SIGGRAPH
95 Conference Proceedings, Robert Cook, Ed. ACM SIGGRAPH, Aug. 1995, Annual Conference Series, pp. 173–182, Addison Wesley,held in Los Angeles, California, 06-11 August 1995.
[31] Aaron W. F. Lee, Wim Sweldens, Peter Schroder, Lawrence Cowsar, and David Dobkin, “MAPS: Multiresolution adaptive parameterizationof surfaces,” in SIGGRAPH 98 Conference Proceedings, Michael Cohen, Ed. July 1998, Annual Conference Series, pp. 95–104, AddisonWesley.
[32] J. Maillot, H. Yahia, and A. Verroust, “Interactive texture mapping,” in Computer Graphics Proceedings, 1993, Annual Conference Series.Proceedings of SIGGRAPH 93, pp. 27–34.