1 guest speaker: bill frietsche us epa. april 7: qa systems, epa definitions, pqaos and common...
TRANSCRIPT

Precision, Bias, and Total Error (Accuracy)
1
Guest Speaker:
Bill FrietscheUS EPA

2
April 7: QA Systems, EPA definitions, PQAOs and common sense – Mike Papp
April 14: Routine Quality Control and Data Management (1-pt QC, flow rate, and instrument stability checks) – Travis Maki
April 21: Audits Overview (NPAP, PEP, Annual PE, Flow Rate Audits) – Jeremy Howe
April 28: Calculating Bias and Precision and AQS reports – Bill Frietsche
May 5: 40 CFR 58 App. A- Gaseous Pollutants – Glenn Gehring
May 12: 40 CFR 58 App. A- Ozone – Brenda Jarrell May 19: 40 CFR 58 App. A- PM filter and continuous
methods –Brandy Toft
Overall Course Overview:

…the difference between your answer and the
“truth”Two components of total error (accuracy):
Bias (jump)Precision (wiggle)
Error
3

Some imprecision is unavoidable
Sometimes up, sometimes down–“random”
Difference divided by best estimate of the truth
“truth” is:◦For gas QC checks: known conc.◦For PM flow rate: audit (known) FR◦For PM2.5 collocated: their average
Precision Error
4

1st way of assessing precision:
5
di = the
difference between a
known value and
your value (flow rate,
conc., voltage,
that should
remain the same)
Sequence of check (date, time, check number)
Repeated measurement of the same thing

Pairs of simultaneous measurements (collocated instruments)
2nd way of assessing precision:
6
di (difference
between collocated
values)
date

Bias = calibration error:
7
Can be sudden or due to slow drift over time:
di = the difference between the true value (audit value) and the analyzer
date

Includes both bias and precision At any one time, an audit value could be
close to the analyzer value due to precision errors in both
Or, audit value could be far from analyzer value due to precision errors adding
Audits estimate Accuracy EPA uses audit results to verify that ongoing
QC checks do represent total error
Accuracy = total error
8

Auditor’s see only one day, while your QC checks see overall big picture
Accuracy = total error:
9
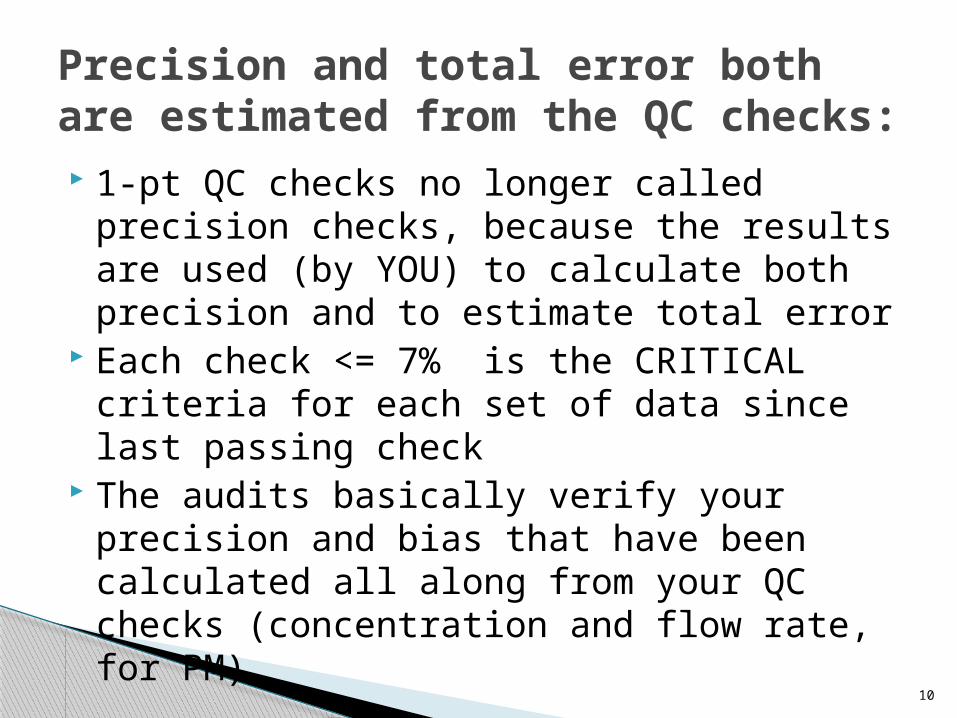
1-pt QC checks no longer called precision checks, because the results are used (by YOU) to calculate both precision and to estimate total error
Each check <= 7% is the CRITICAL criteria for each set of data since last passing check
The audits basically verify your precision and bias that have been calculated all along from your QC checks (concentration and flow rate, for PM)
Precision and total error both are estimated from the QC checks:
10
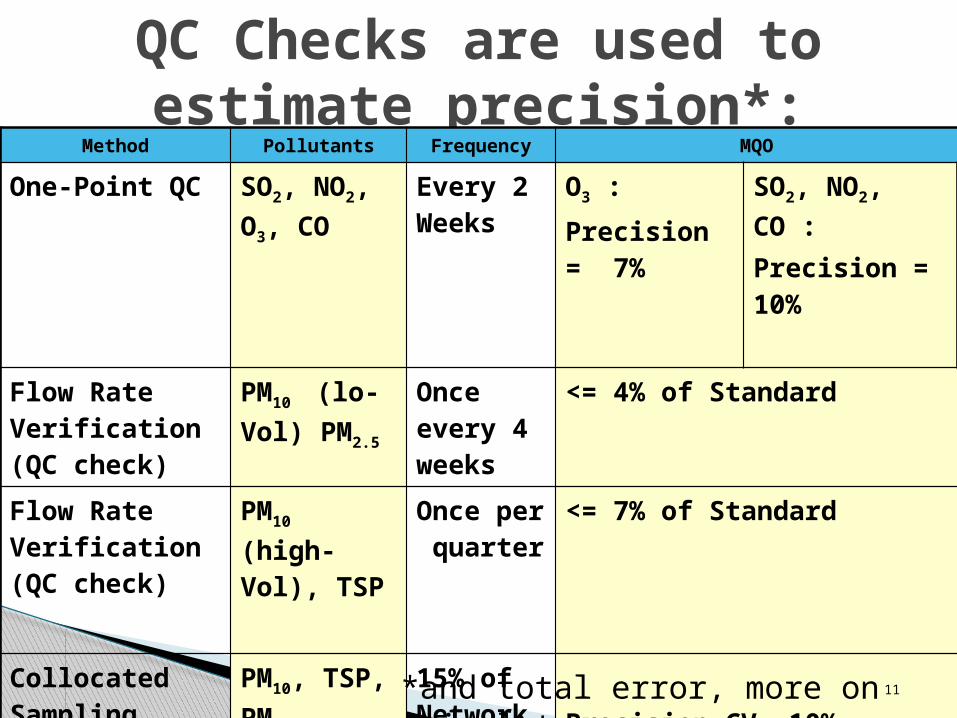
QC Checks are used to estimate precision*:
Method Pollutants Frequency MQO
One-Point QC SO2, NO2, O3, CO
Every 2 Weeks
O3 :
Precision = 7%
SO2, NO2, CO :
Precision = 10%
Flow Rate Verification (QC check)
PM10 (lo-Vol) PM2.5
Once every 4 weeks
<= 4% of Standard
Flow Rate Verification (QC check)
PM10 (high-Vol), TSP
Once per quarter
<= 7% of Standard
Collocated Sampling
PM10, TSP, PM2.5
15% of Network Every 12 Days
Precision CV= 10% (which means RPD =14%)
11*and total error, more on this later….

Estimates your overall system uncertainty, if you were perfectly calibrated
Changes over time can point to operator error, lab error, poorly written procedures, equipment/standards going bad
Changes can be fixed sooner rather than at audit
EPA compares precision by site and agency
Why is tracking precision important?
12

Useful to track precision (or bias) over time
See this example (and you fill in your values) at:
Another example in the DASC tool:
Control charts:
13
di
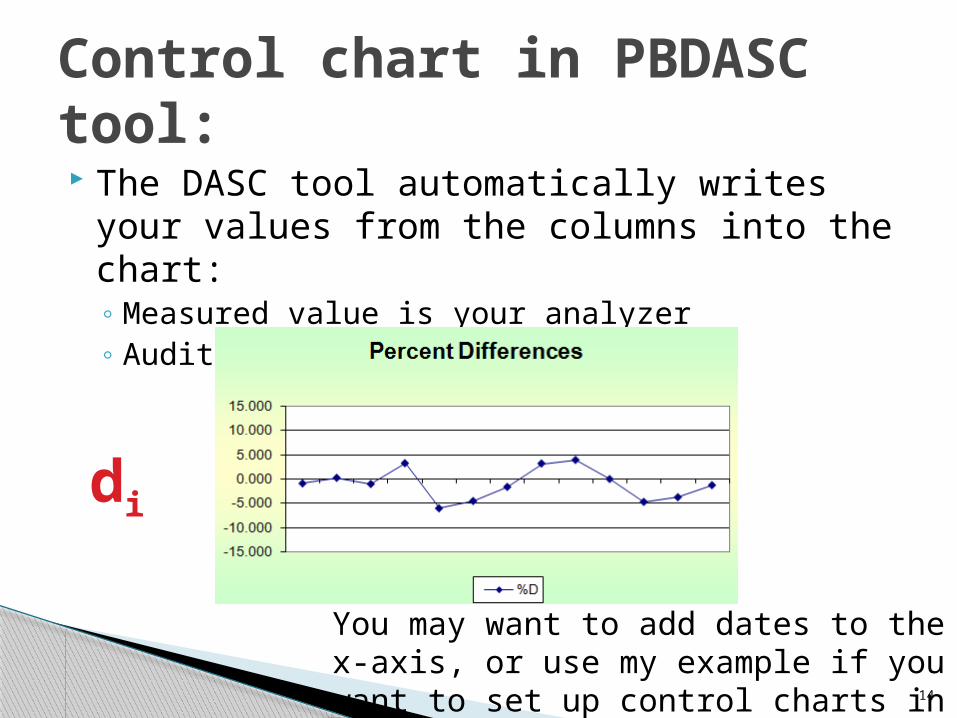
The DASC tool automatically writes your values from the columns into the chart:◦ Measured value is your analyzer◦ Audit value is the known
Control chart in PBDASC tool:
14
You may want to add dates to the x-axis, or use my example if you want to set up control charts
in your program
di

In their annual QA reports, from your RP transactions in AQS:
http://www.epa.gov/ttnamti1/qareport.html http://www.epa.gov/ttnamti1/anlqa.html
EPA estimates precision:
15
di
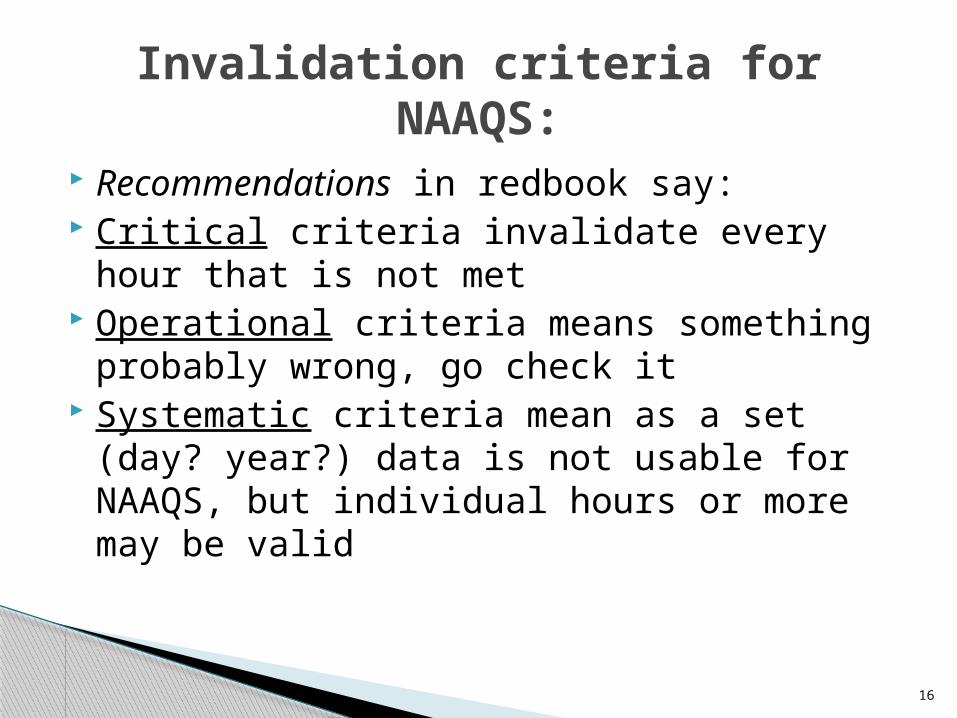
Recommendations in redbook say: Critical criteria invalidate every hour that is
not met Operational criteria means something
probably wrong, go check it Systematic criteria mean as a set (day?
year?) data is not usable for NAAQS, but individual hours or more may be valid
Invalidation criteria for NAAQS:
16

(NO2 and SO2 are the same)
Critical QC invalidation criteria for gas:
17

Critical invalidation criteria for PM:
18
Method Pollutants Frequency
MQO
Flow Rate Verification (QC check)
PM10 (lo-Vol), PM2.5
Once every 4 weeks
<= 4% of Standard
Flow Rate Verification (QC check)
PM10 (high-Vol), TSP
Once per quarter
<= 7% of Standard

Operational precision invalidation criteria for PM:
19
Method Pollutants Frequency MQO
Collocated Sampling
PM10, TSP, PM2.5
15% of Network Every 12 Days
Precision as CV < = 10% (meaning the relative percent diff must be less than 14% for conc > 3 ug/m3)
100
2)(
ii
iii YX
YXd

Keep the bias component minimized by calibrating and verifying your equipment against a standard
Keep precision component low by consistency You can work to keep bias down, while precision
is often out of your control below a certain limit EPA calculates from your RA transactions
Total Error
20
100
audit
auditmeasdi

Total error requirements for NAAQS are all operational criteria (investigate, but not necessarily
invalid):
21
Method Pollutants Frequency MQO
Annual Performance Evaluation (Audit)
SO2, NO2, O3, CO
Once per Year
<= 15% for each audit concentration— OPERATIONAL
Semi-Annual Flow Rate Audit
PM10, PM2.5 Every 6 Months
<= 4% of Standard OPERATIONAL
Semi-Annual Flow Rate Audit
PM10 (high-Vol), TSP
Every 6 Months
<= 10% of Standard OPERATIONAL
PM2.5 PEP Program
NPAP
PM2.5
SO2, NO2, O3, CO
QuarterYear (see QA Requirements.xls)
Bias = 10% -- OPERATIONAL

Bias: systematic difference, or “jump” Precision: random error, or “wiggle” Accuracy = total error, a combination of
both Simple temp bath illustrations at: http://itep68.itep.nau.edu/itep_downloads/Q
A101_Resources/AllDownloadableMovies/
Bias, precision, and total error:
22

DASC (Data Assessment Statistical Calculator)◦http://itep68.itep.nau.edu/itep_download
s/QA101_Resources/DASC%20EPA%20Prec%20and%20Bias%20Calculator/
AQS: Data Quality Indicators Report (AMP255)
23
How do I calculate precision and total error?
Minimize bias by regular calibrations both accuracy (total error) and
precision are first estimated by di on an ongoing basis, by you
Audits verify total error estimates Course website:
http://itep68.itep.nau.edu/itep_downloads/QA101_Resources/
Our emails:◦ Bill Frietsche: [email protected]◦ [email protected]◦ [email protected]
24
Before we cut to Bill:

AMP255 and other AQS QA tools

• Appendix A to Part 58• Table A-2 of App A• AQS TTN web site• AQSP&A Spreadsheet• Discoverer• AMTIC web site• AQS Helpline• AQS AMP255 Data Quality Indicator Report

Appendix A to Part 58
• Regulations that define QA reporting requirements for criteria pollutants• Define assessments for each criteria pollutant
• 1 Pt QC check for gases• Annual performance evaluation for gases• Flow rate verification for particulate matter• Semi-annual flow rate audit for particulate matter• Collocated sampling requirements for particulate matter• Pb audit strips for laboratory analysis QA• Performance Evaluation Program for PM fine, PM coarse,
and Pb• Formerly called precision and accuracy data
– still use these terms on AQS transactions
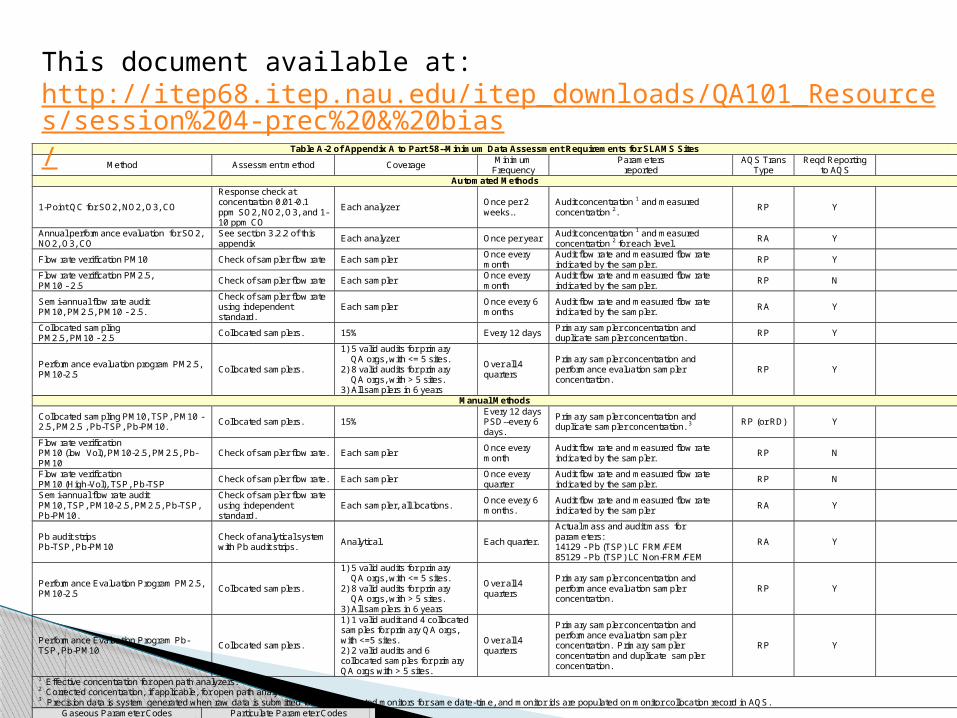
Table A-2 of Appendix A to Part 58--Minimum Data Assessment Requirements for SLAMS Sites
Method Assessment method Coverage Minimum
Frequency Parameters
reported AQS Trans
Type Reqd Reporting
to AQS
Automated Methods
1-Point QC for SO2, NO2, O3, CO
Response check at concentration 0.01-0.1 ppm SO2, NO2, O3, and 1-10 ppm CO
Each analyzer Once per 2 weeks..
Audit concentration 1 and measured concentration 2.
RP Y
Annual performance evaluation for SO2, NO2, O3, CO
See section 3.2.2 of this appendix
Each analyzer Once per year Audit concentration 1 and measured concentration 2 for each level.
RA Y
Flow rate verification PM10 Check of sampler flow rate Each sampler Once every month
Audit flow rate and measured flow rate indicated by the sampler.
RP Y
Flow rate verification PM2.5, PM10 - 2.5
Check of sampler flow rate Each sampler Once every month
Audit flow rate and measured flow rate indicated by the sampler.
RP N
Semi-annual flow rate audit PM10, PM2.5, PM10 - 2.5.
Check of sampler flow rate using independent standard.
Each sampler Once every 6 months
Audit flow rate and measured flow rate indicated by the sampler.
RA Y
Collocated sampling PM2.5, PM10 - 2.5
Collocated samplers. 15% Every 12 days Primary sampler concentration and duplicate sampler concentration.
RP Y
Performance evaluation program PM2.5, PM10-2.5
Collocated samplers.
1) 5 valid audits for primary QA orgs, with <= 5 sites. 2) 8 valid audits for primary QA orgs, with > 5 sites. 3) All samplers in 6 years
Over all 4 quarters
Primary sampler concentration and performance evaluation sampler concentration.
RP Y
Manual Methods
Collocated sampling PM10, TSP, PM10 - 2.5, PM2.5 , Pb-TSP, Pb-PM10.
Collocated samplers. 15% Every 12 days PSD--every 6 days.
Primary sampler concentration and duplicate sampler concentration. 3
RP (or RD) Y
Flow rate verification PM10 (low Vol), PM10-2.5, PM2.5, Pb-PM10
Check of sampler flow rate. Each sampler Once every month
Audit flow rate and measured flow rate indicated by the sampler.
RP N
Flow rate verification PM10 (High-Vol), TSP, Pb-TSP
Check of sampler flow rate. Each sampler Once every quarter
Audit flow rate and measured flow rate indicated by the sampler.
RP N
Semi-annual flow rate audit PM10, TSP, PM10-2.5, PM2.5, Pb-TSP, Pb-PM10.
Check of sampler flow rate using independent standard.
Each sampler, all locations. Once every 6 months.
Audit flow rate and measured flow rate indicated by the sampler
RA Y
Pb audit strips Pb-TSP, Pb-PM10
Check of analytical system with Pb audit strips.
Analytical. Each quarter.
Actual mass and audit mass for parameters: 14129 - Pb (TSP) LC FRM/FEM 85129 - Pb (TSP) LC Non-FRM/FEM
RA Y
Performance Evaluation Program PM2.5, PM10-2.5
Collocated samplers.
1) 5 valid audits for primary QA orgs, with <= 5 sites. 2) 8 valid audits for primary QA orgs, with > 5 sites. 3) All samplers in 6 years
Over all 4 quarters
Primary sampler concentration and performance evaluation sampler concentration.
RP Y
Performance Evaluation Program Pb-TSP, Pb-PM10
Collocated samplers.
1) 1 valid audit and 4 collocated samples for primary QA orgs, with <=5 sites. 2) 2 valid audits and 6 collocated samples for primary QA orgs with > 5 sites.
Over all 4 quarters
Primary sampler concentration and performance evaluation sampler concentration. Primary sampler concentration and duplicate sampler concentration.
RP Y
1 Effective concentration for open path analyzers. 2 Corrected concentration, if applicable, for open path analyzers. 3 Precision data is system generated when raw data is submitted for both collocated monitors for same date-time, and monitor ids are populated on monitor collocation record in AQS.
Gaseous Parameter Codes Particulate Parameter Codes SO2 42401 PM10 81102
NO2 42602 TSP 11101
O3 44201 PM10-2.5 86101
CO 42101 PM2.5 88101
Pb-TSP 14129
Pb-PM10 85129
This document available at: http://itep68.itep.nau.edu/itep_downloads/QA101_Resources/session%204-prec%20&%20bias/

AQS TTN web site http://www.epa.gov/ttn/airs/airsaqs/
AQSP&A Spreadsheet http://www.epa.gov/ttn/airs/airsaqs/padata/
AQS Discoverer http://www.epa.gov/ttn/airs/airsaqs/aqsdiscover/
AMTIC web site http://www.epa.gov/ttn/amtic/
AQS Help Line [email protected] 1-866-411-4EPA (4372)

Example run of AMP255 shown onscreen

All QC data helps EPA balance your costs of QC with needed information to protect health
Questions to AQS are welcomed EPA committed to improving user friendliness Course website:
http://itep68.itep.nau.edu/itep_downloads/QA101_Resources/
Our emails:◦ Bill Frietsche: [email protected]◦ [email protected]◦ [email protected]
31
AQS Precision and Accuracy Conclusions: