1 grain production. 2 nass us select crop value 2010 billions of dollars oatsbarleysor- ghum...
TRANSCRIPT
1
Grain production

2
NASS
US Select Crop Value 2010Billions of Dollars
Oats Barley Sor-ghum
Wheat Soy-bean
Corn
$1.7$0.7$0.2
$13.0
$38.9
$66.7
3
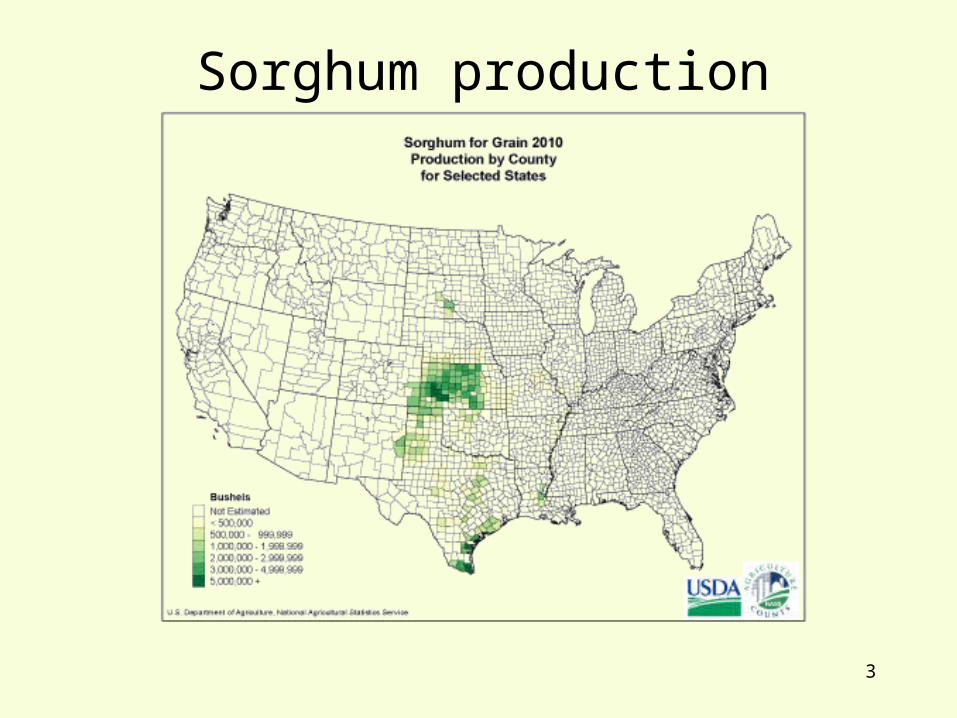
Sorghum production
4
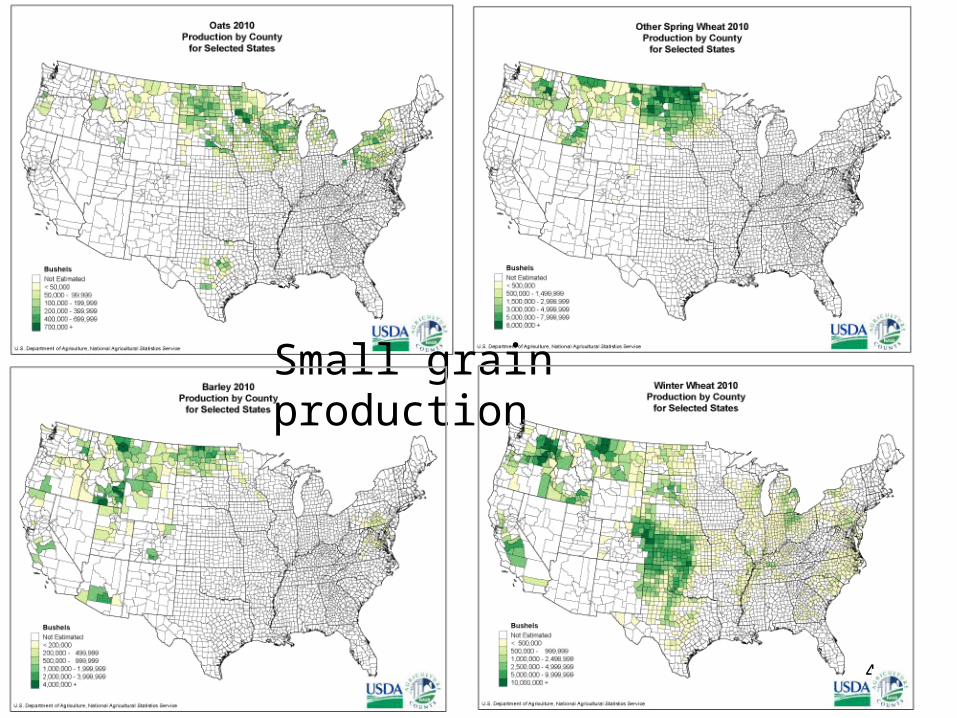
Small grain production

5
Corn
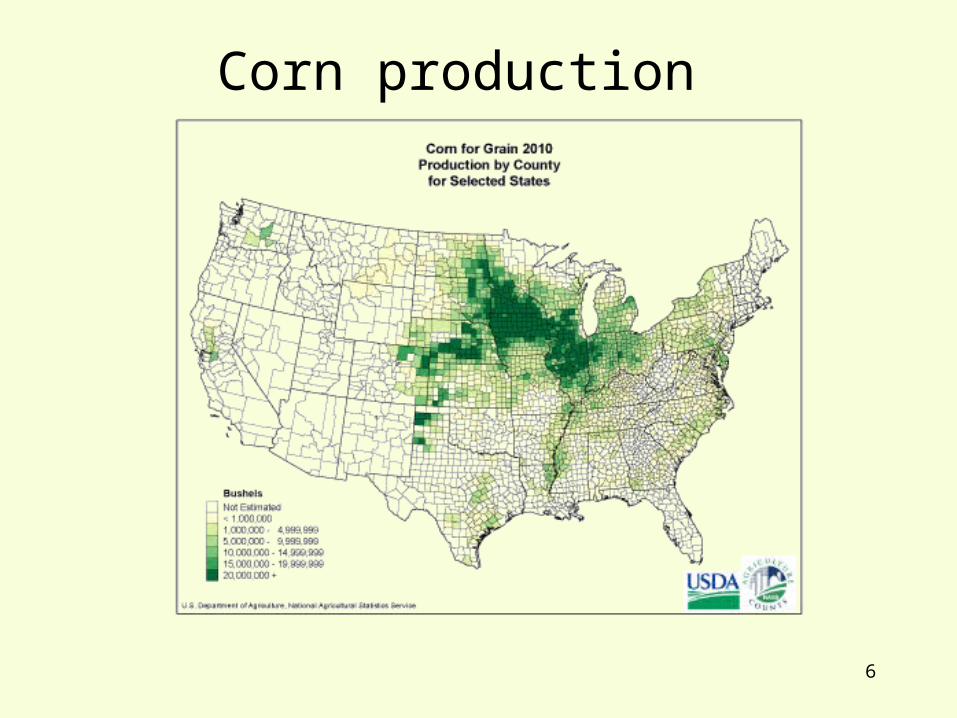
• Graze corn - alternative pasture• Corn silage - dairy• High moisture corn• Grain
6
Corn production
7
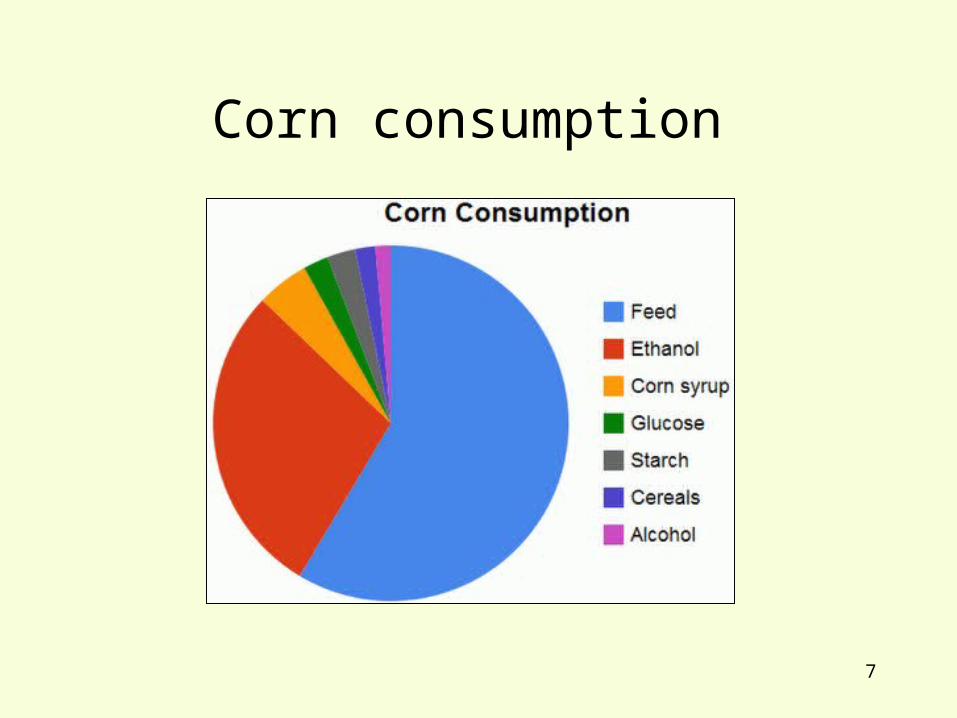
Corn consumption
8
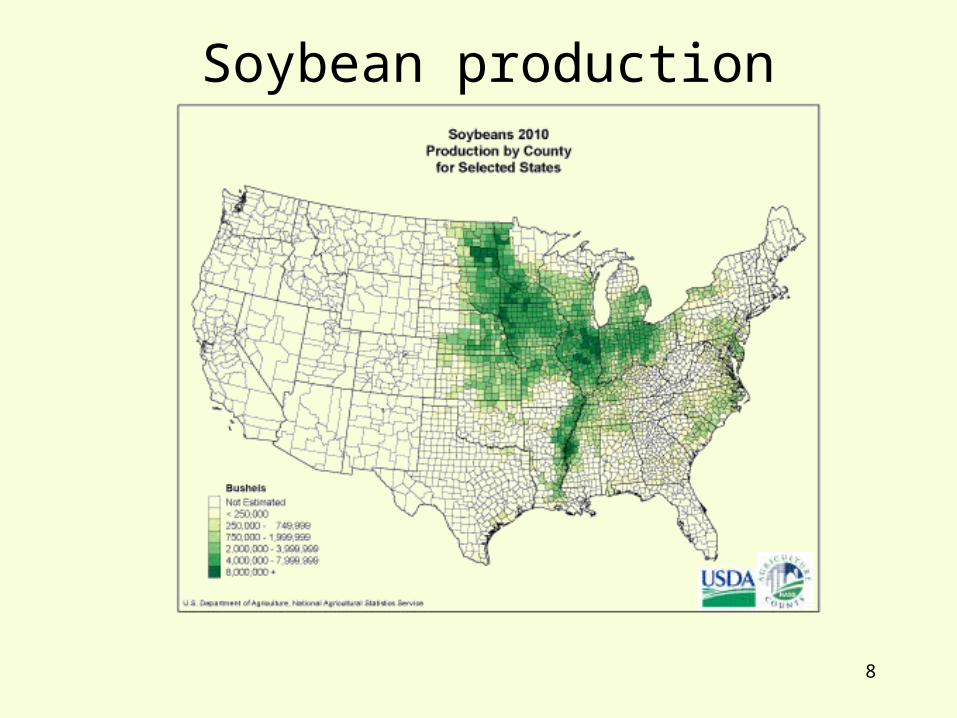
Soybean production
9
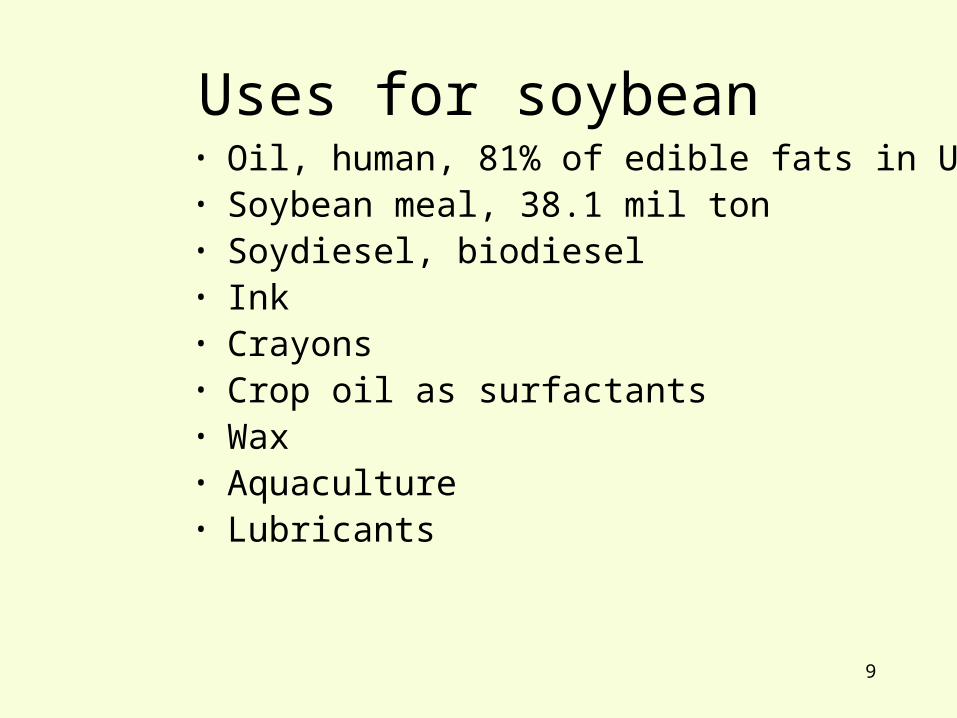
Uses for soybean• Oil, human, 81% of edible fats in US• Soybean meal, 38.1 mil ton• Soydiesel, biodiesel• Ink• Crayons• Crop oil as surfactants• Wax• Aquaculture• Lubricants
10
Why does the Midwest lead in corn and soybean production?
Why corn?
11
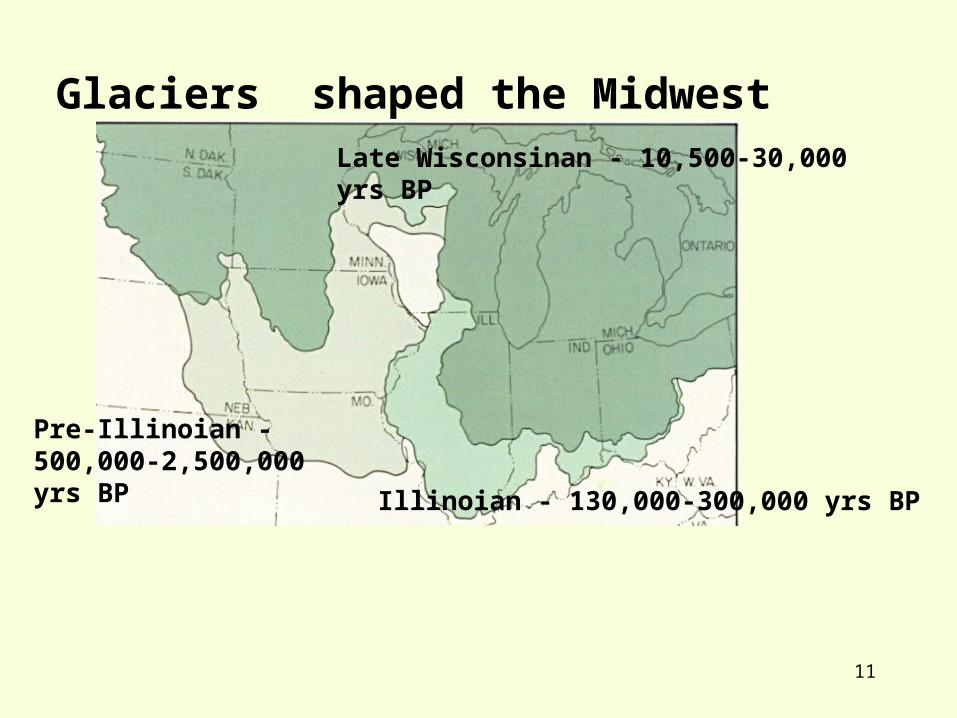
Glaciers shaped the MidwestLate Wisconsinan - 10,500-30,000 yrs BP
Illinoian - 130,000-300,000 yrs BP
Pre-Illinoian - 500,000-2,500,000 yrs BP
12
13
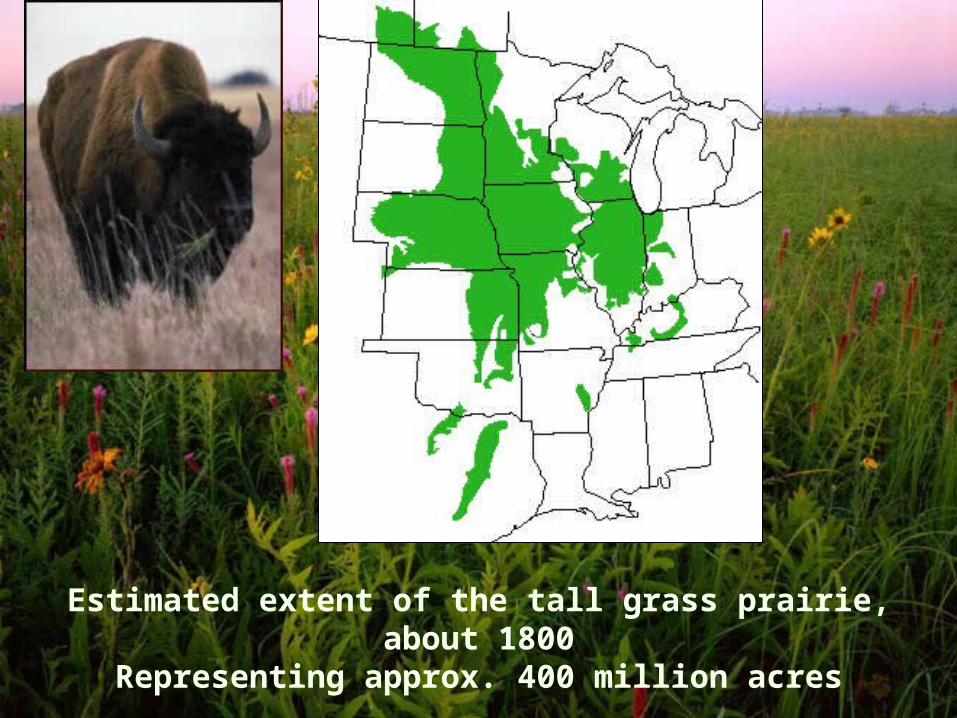
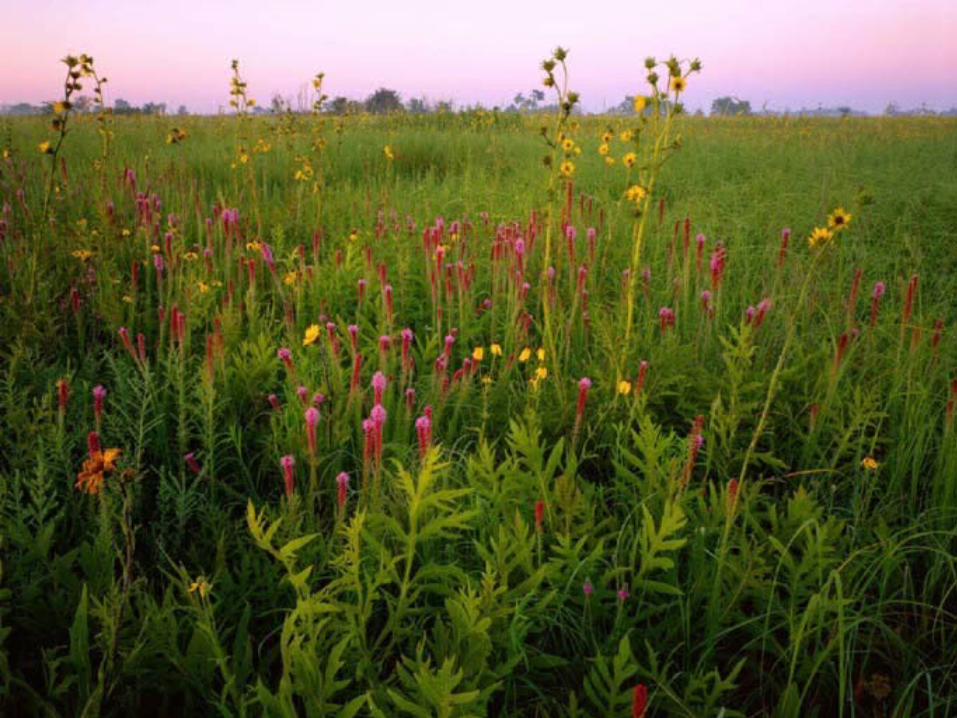
Estimated extent of the tall grass prairie, about 1800Representing approx. 400 million acres
14
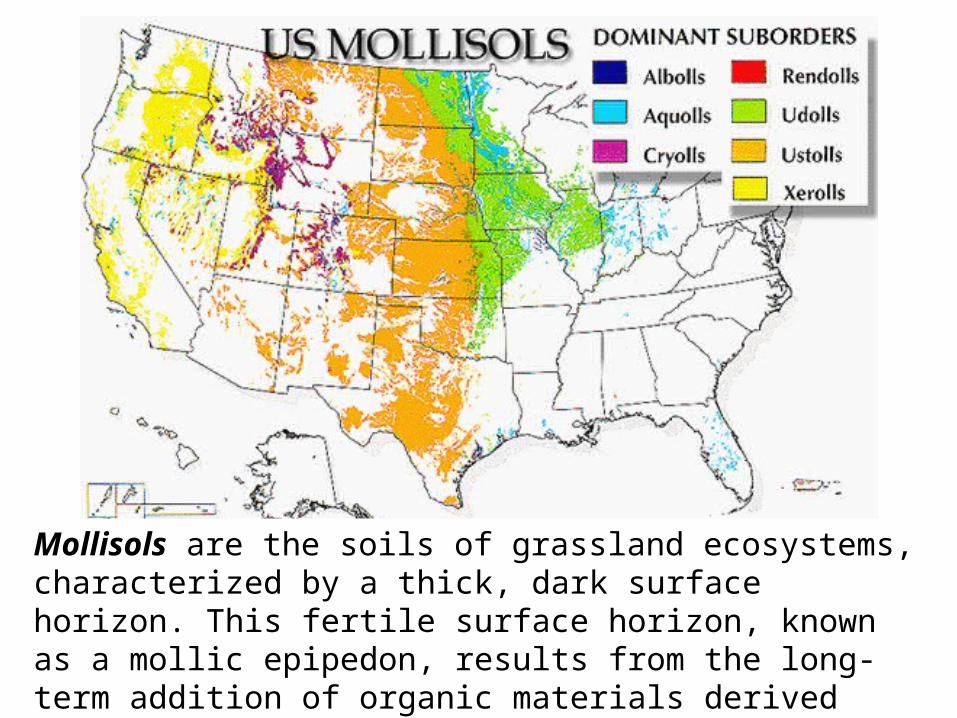
Mollisols are the soils of grassland ecosystems, characterized by a thick, dark surface horizon. This fertile surface horizon, known as a mollic epipedon, results from the long-term addition of organic materials derived from plant roots.
15
16Image of NRCS
17
Iowa’s (Midwest) Landscape Changed
• Iowa’s tall grass prairie declined from12.6 million ha to 24,560 ha, a 99.9% decrease

18
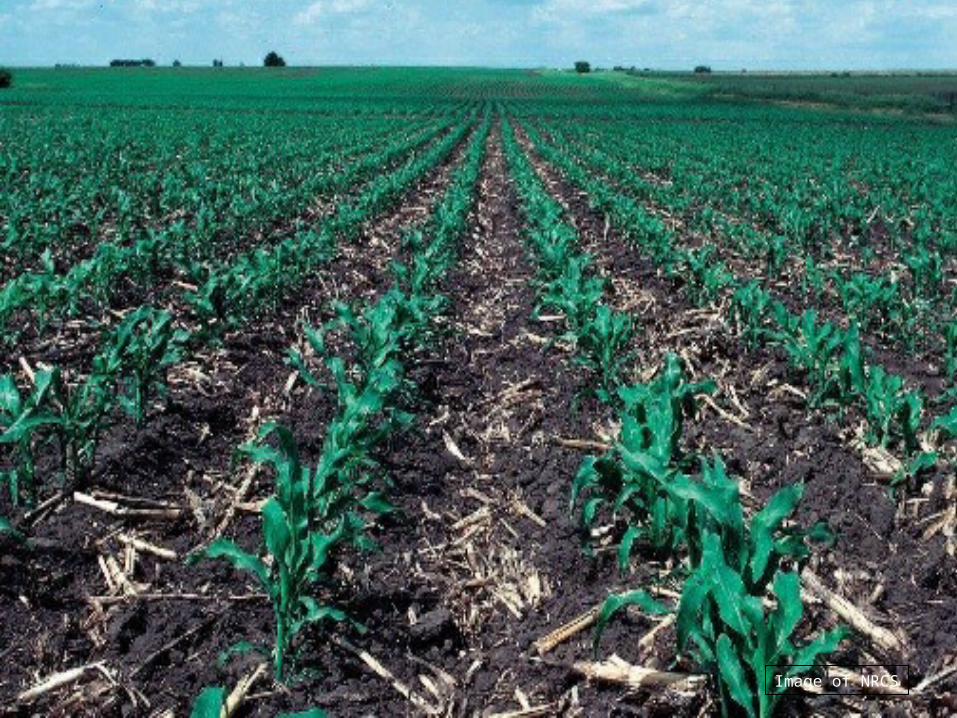
Iowa’s (Midwest) landscape changed
Causes:• Human settlement• Steel, moldboard plow• Water drainage of land• Agriculture production, WW II• Chemicals• Specialization• Urban development?• Biofuel production?
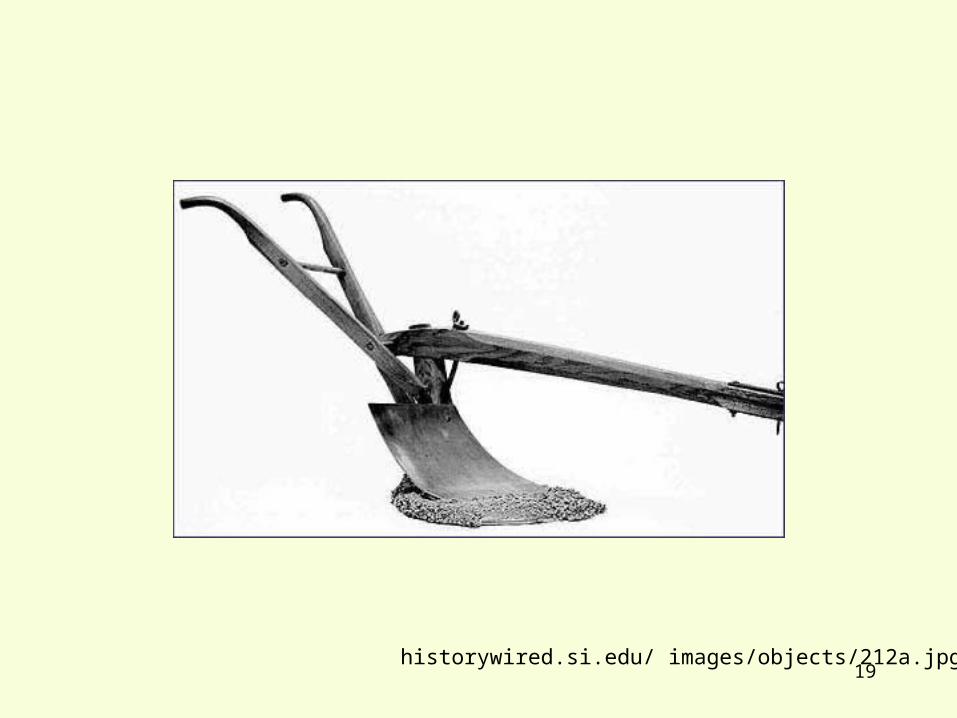
19historywired.si.edu/ images/objects/212a.jpg
20
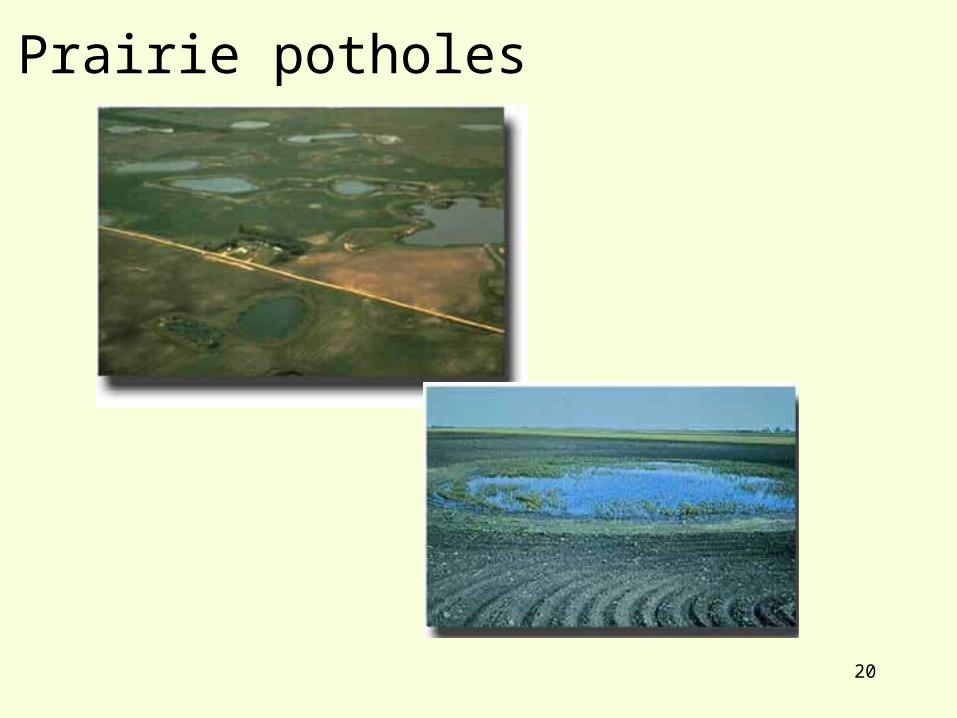
Prairie potholes

21
22
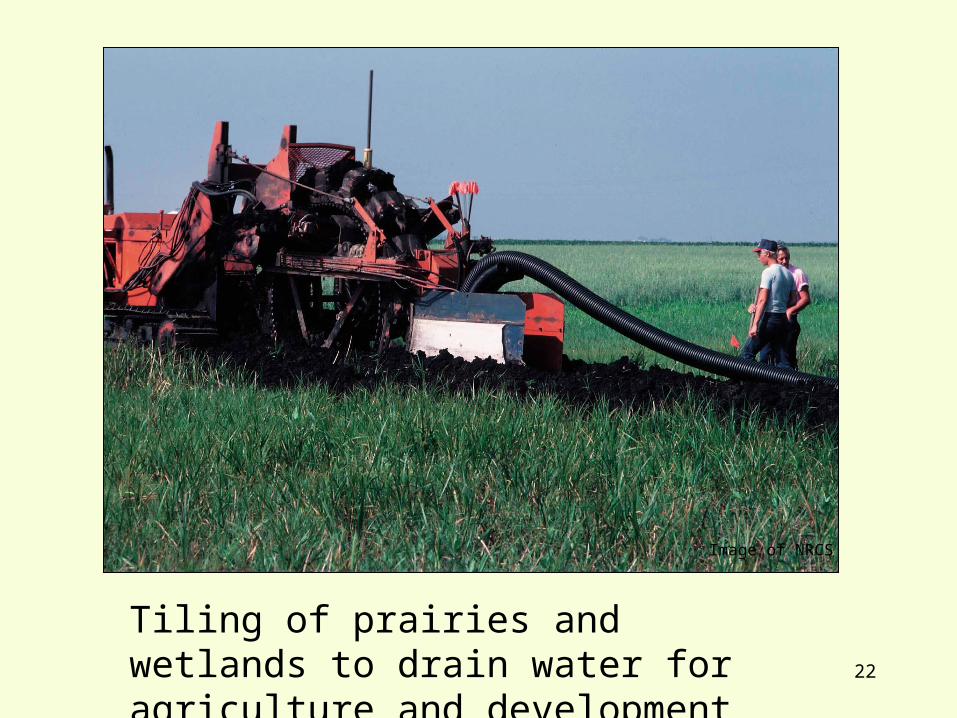
Tiling of prairies and wetlands to drain water for agriculture and development
Image of NRCS
23
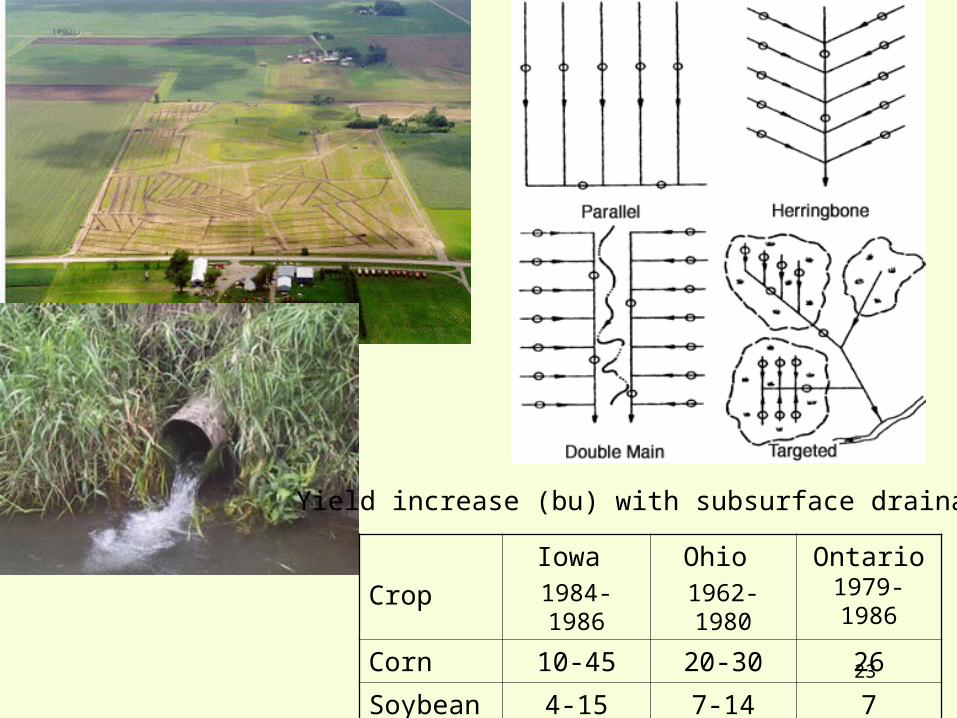
Crop
Iowa 1984-1986
Ohio 1962-1980
Ontario 1979-1986
Corn 10-45 20-30 26
Soybeans 4-15 7-14 7
Yield increase (bu) with subsurface drainage
24
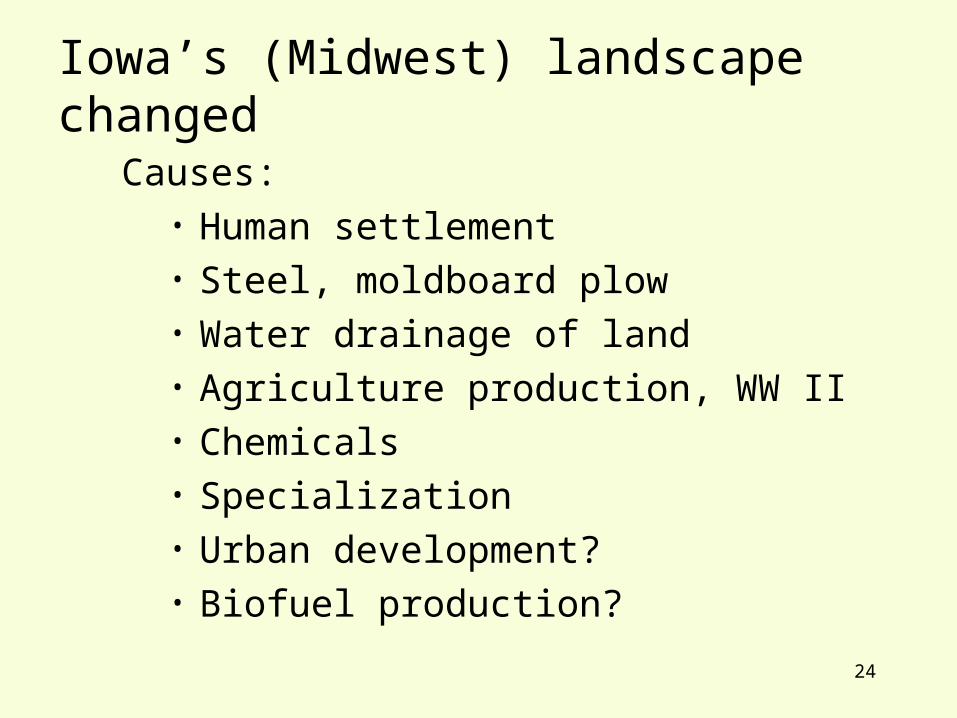
Iowa’s (Midwest) landscape changed
Causes:• Human settlement• Steel, moldboard plow• Water drainage of land• Agriculture production, WW II• Chemicals• Specialization• Urban development?• Biofuel production?
25
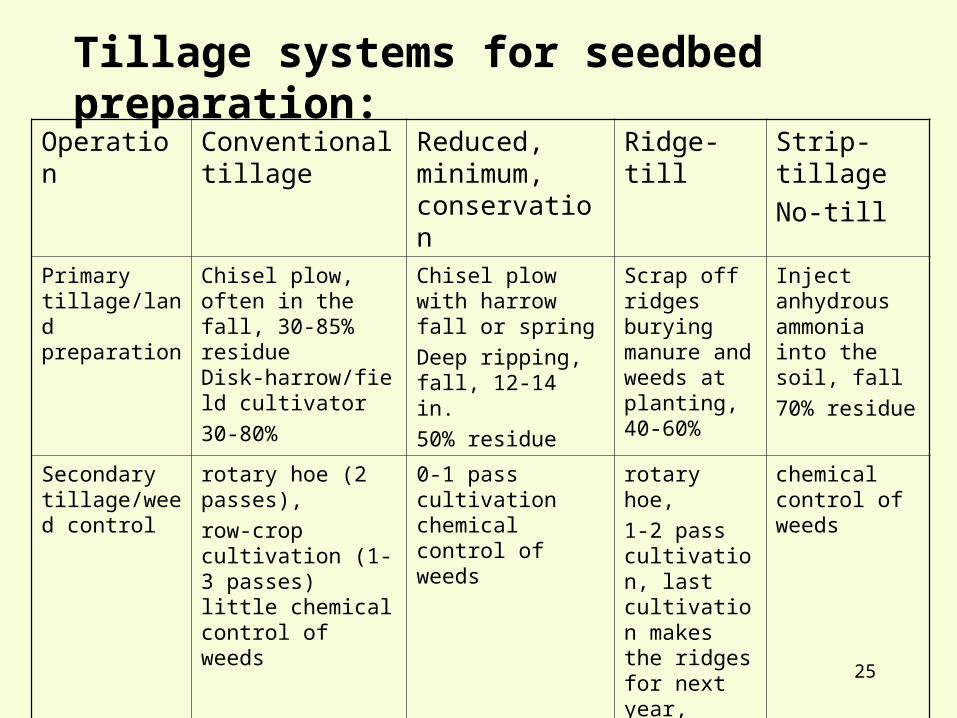
Tillage systems for seedbed preparation:Operation Conventional
tillageReduced, minimum, conservation
Ridge-till Strip-tillage
No-till
Primary tillage/land preparation
Chisel plow, often in the fall, 30-85% residueDisk-harrow/field cultivator
30-80%
Chisel plow with harrow fall or spring
Deep ripping, fall, 12-14 in.
50% residue
Scrap off ridges burying manure and weeds at planting, 40-60%
Inject anhydrous ammonia into the soil, fall
70% residue
Secondary tillage/weed control
rotary hoe (2 passes),
row-crop cultivation (1-3 passes)little chemical control of weeds
0-1 pass cultivationchemical control of weeds
rotary hoe,
1-2 pass cultivation, last cultivation makes the ridges for next year, banding chemicals
chemical control of weeds
26
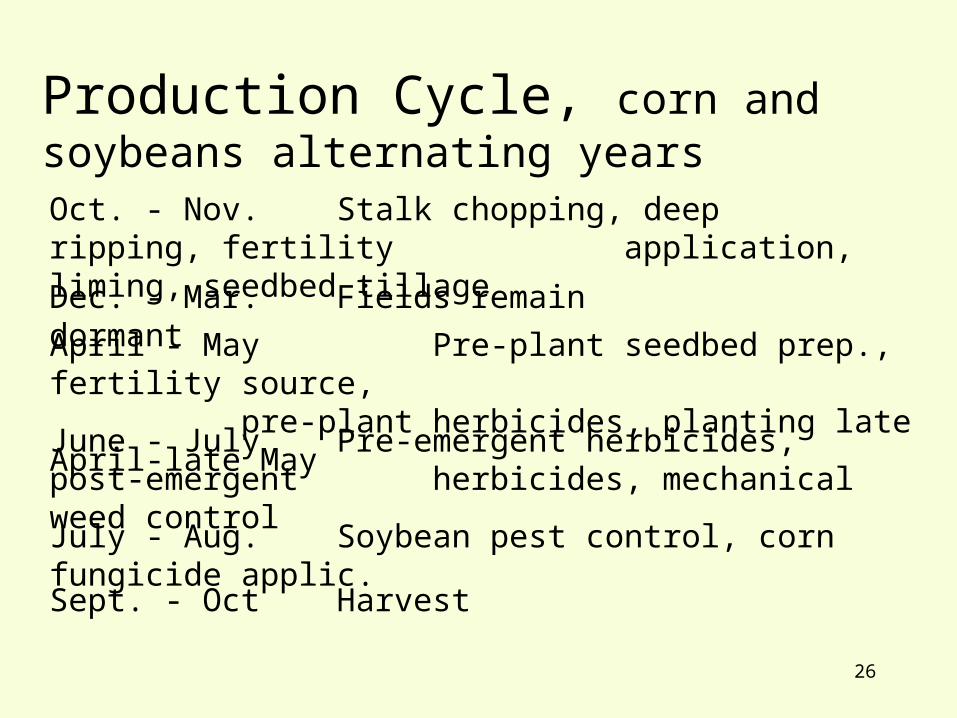
Dec. - Mar. Fields remain dormant
April - May Pre-plant seedbed prep., fertility source, pre-plant herbicides, planting late April-late May
June - July Pre-emergent herbicides, post-emergent herbicides, mechanical weed control
July - Aug. Soybean pest control, corn fungicide applic.
Sept. - Oct Harvest
Oct. - Nov. Stalk chopping, deep ripping, fertility application, liming, seedbed tillage
Production Cycle, corn and soybeans alternating years
27
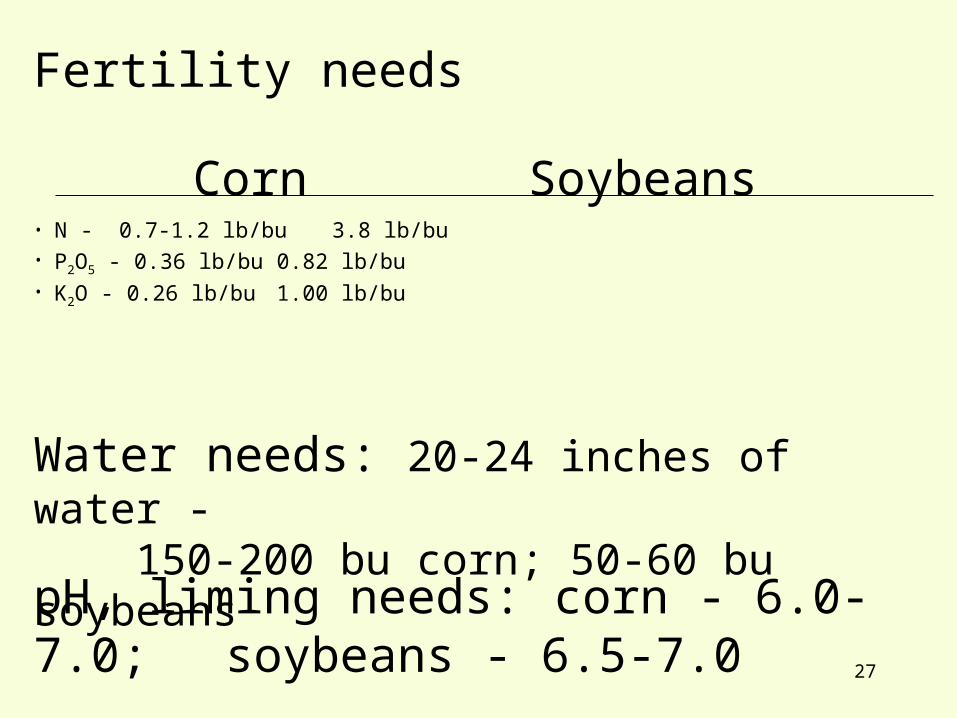
Fertility needs
• N - 0.7-1.2 lb/bu 3.8 lb/bu • P2O5 - 0.36 lb/bu 0.82 lb/bu• K2O - 0.26 lb/bu 1.00 lb/bu
Corn Soybeans
Water needs: 20-24 inches of water - 150-200 bu corn; 50-60 bu soybeans
pH, liming needs: corn - 6.0-7.0; soybeans - 6.5-7.0
28
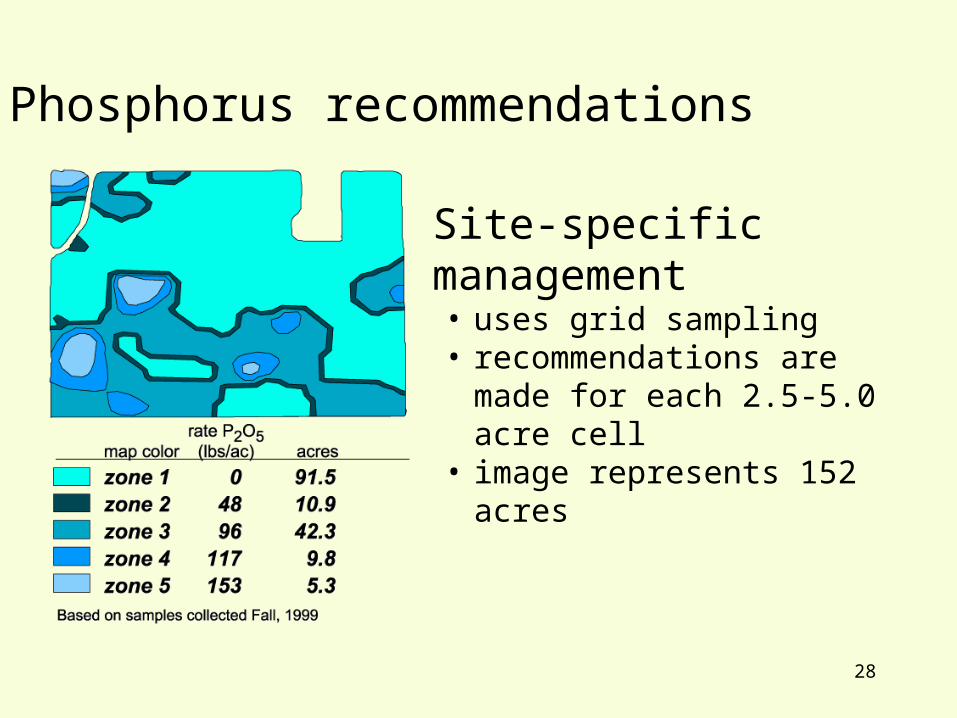
Site-specific management• uses grid sampling• recommendations are made for
each 2.5-5.0 acre cell• image represents 152 acres
Phosphorus recommendations
29
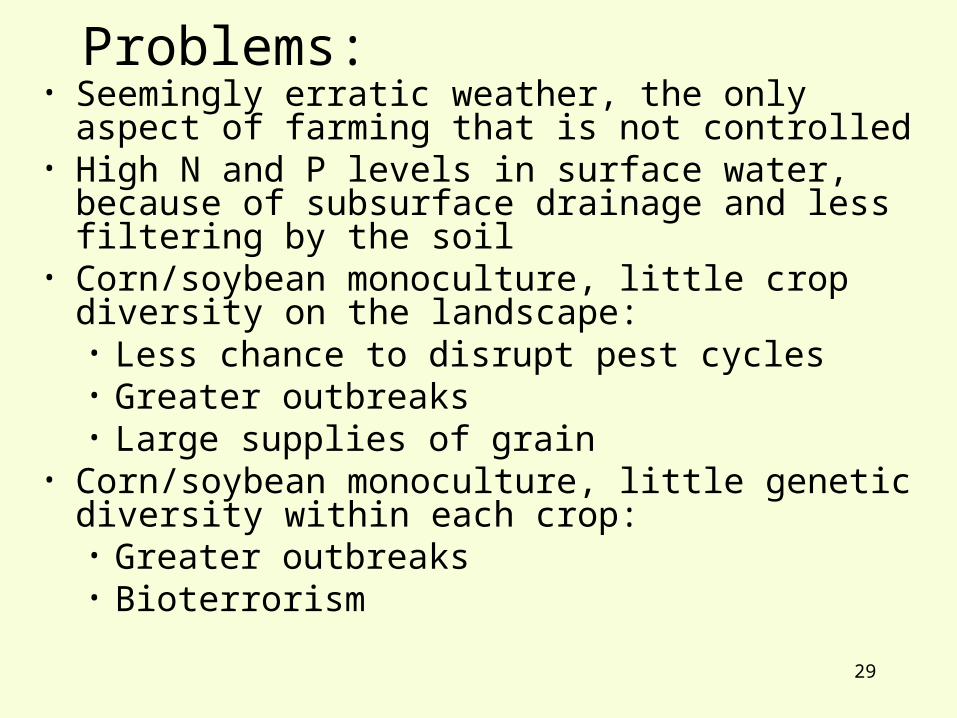
Problems:• Seemingly erratic weather, the only aspect of
farming that is not controlled• High N and P levels in surface water, because of
subsurface drainage and less filtering by the soil• Corn/soybean monoculture, little crop diversity on
the landscape:• Less chance to disrupt pest cycles• Greater outbreaks• Large supplies of grain
• Corn/soybean monoculture, little genetic diversity within each crop:• Greater outbreaks• Bioterrorism
30
• Open canopy much of the year• not getting the full benefits of sunlight• erosion, not an perennial system• unused nutrients, N and P
Iowa Daily Erosion Project:http://wepp.mesonet.agron.iastate.edu/GIS/rainfall.phtml?
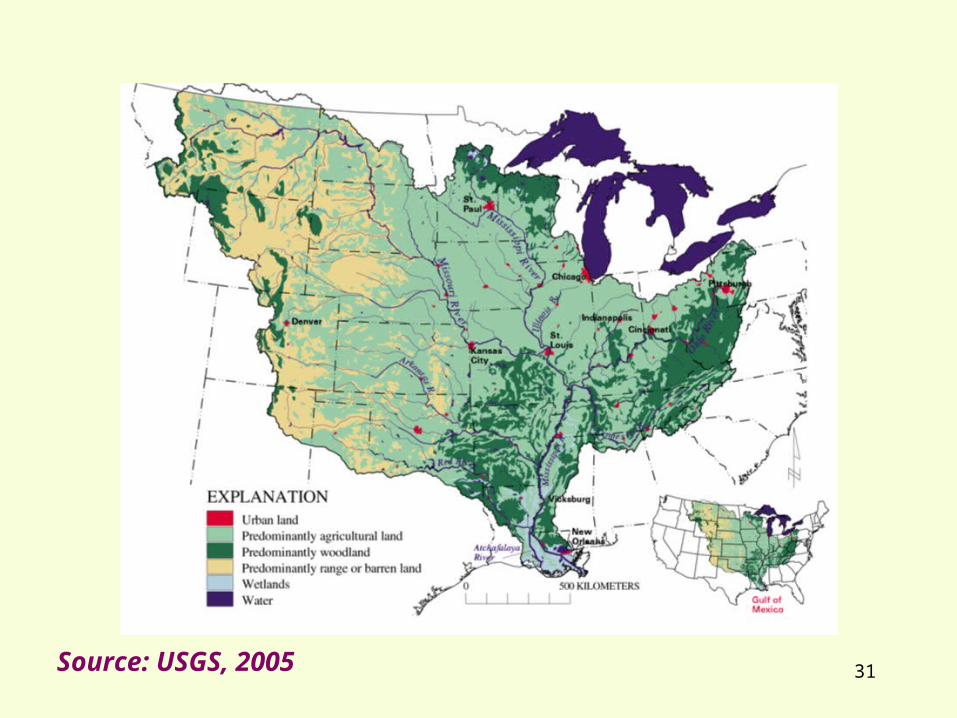
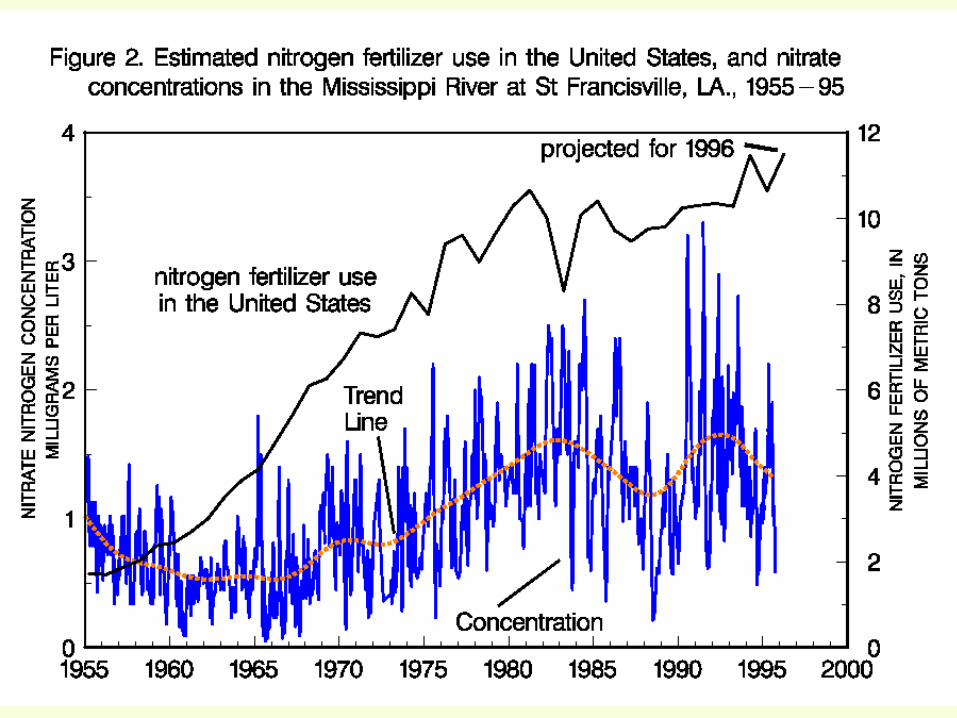
31Source: USGS, 2005
32
33
34
35
36
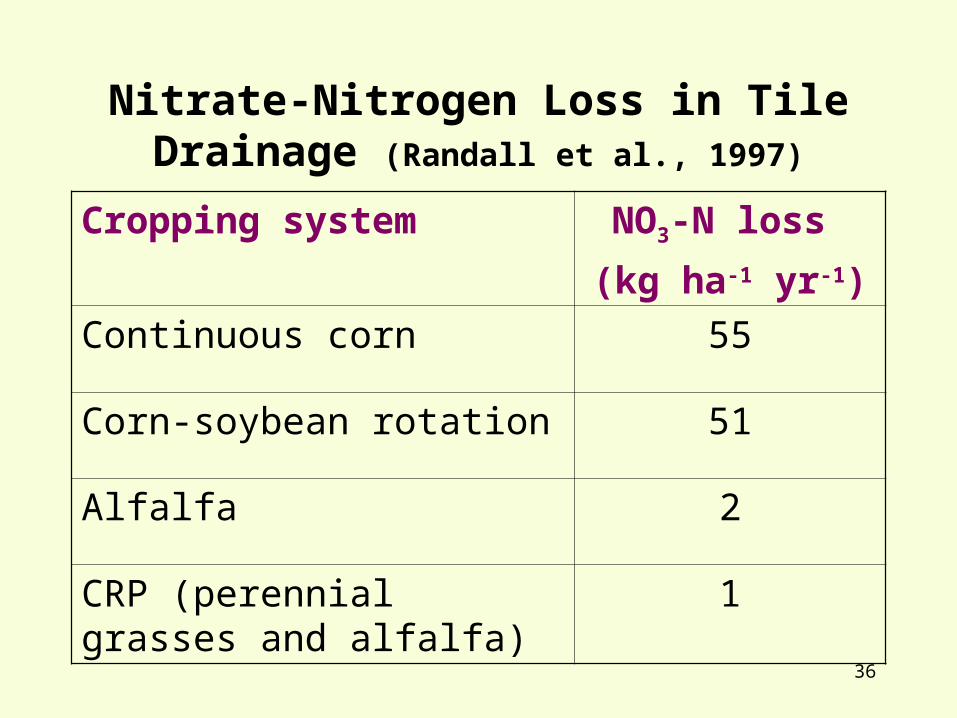
Nitrate-Nitrogen Loss in Tile Drainage (Randall et al., 1997)
Cropping system NO3-N loss
(kg ha-1 yr-1)
Continuous corn 55
Corn-soybean rotation 51
Alfalfa 2
CRP (perennial grasses and alfalfa)
1
37
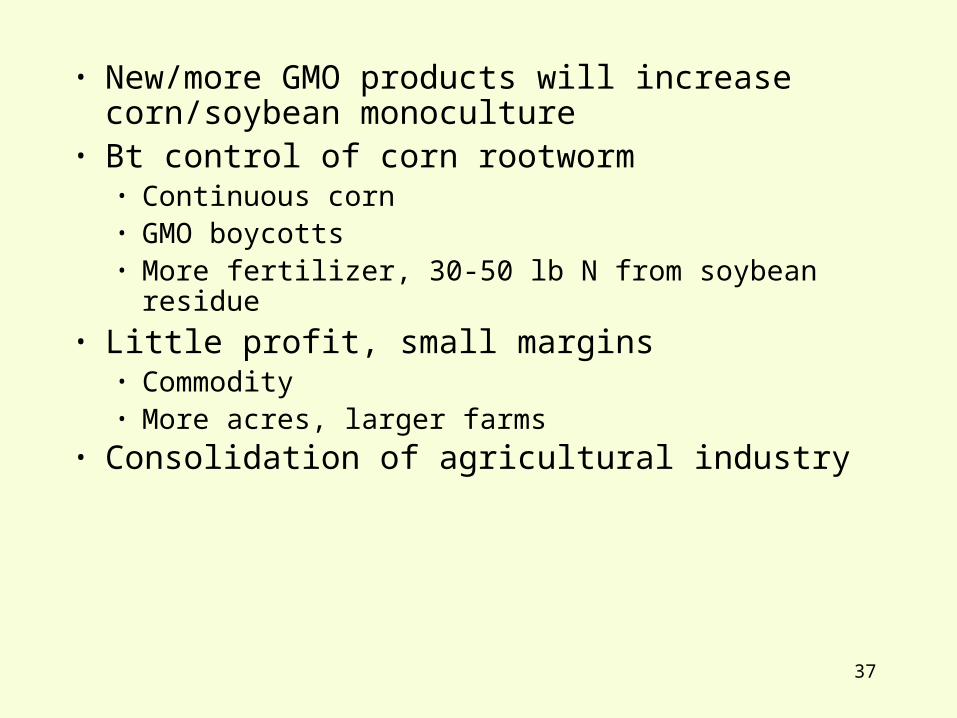
• New/more GMO products will increase corn/soybean monoculture
• Bt control of corn rootworm• Continuous corn• GMO boycotts• More fertilizer, 30-50 lb N from soybean residue
• Little profit, small margins• Commodity• More acres, larger farms
• Consolidation of agricultural industry
38
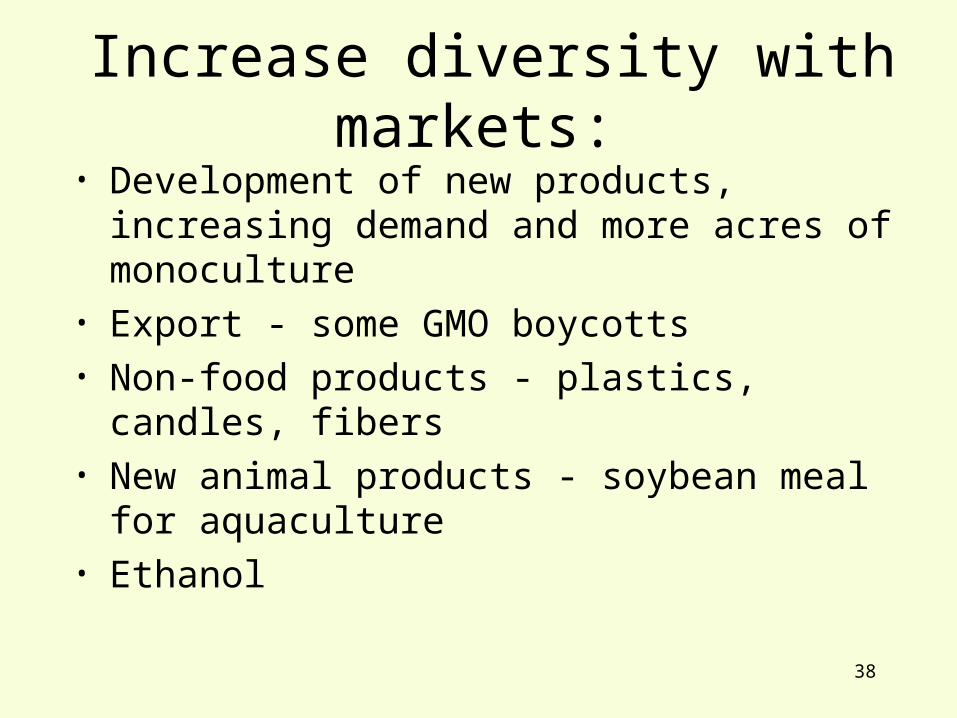
Increase diversity with markets:• Development of new products, increasing
demand and more acres of monoculture• Export - some GMO boycotts• Non-food products - plastics, candles, fibers• New animal products - soybean meal for
aquaculture• Ethanol
39
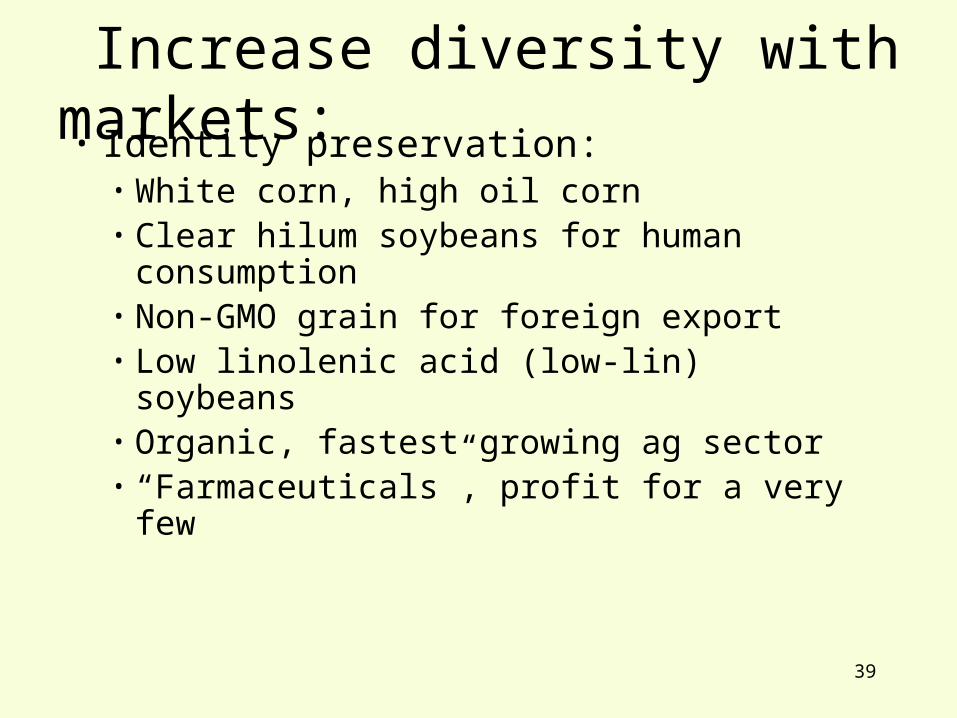
Increase diversity with markets:• Identity preservation:
• White corn, high oil corn• Clear hilum soybeans for human
consumption• Non-GMO grain for foreign export• Low linolenic acid (low-lin) soybeans• Organic, fastest growing ag sector• “Farmaceuticals”, profit for a very few
40
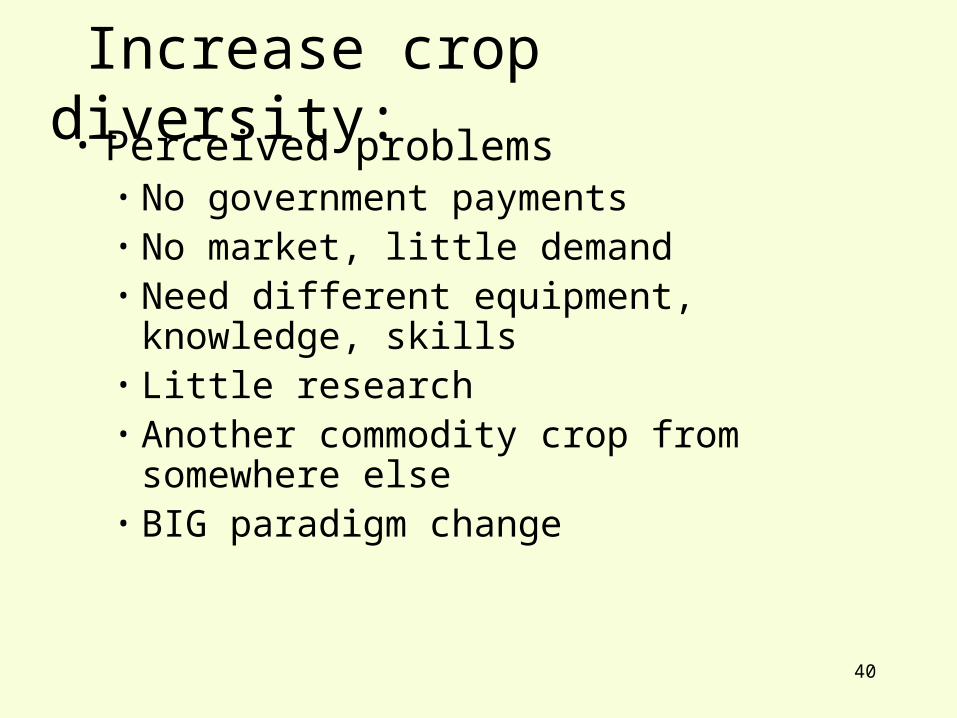
Increase crop diversity:• Perceived problems
• No government payments• No market, little demand• Need different equipment, knowledge, skills• Little research• Another commodity crop from somewhere
else• BIG paradigm change