1 from firm to fluid - structure-texture relations of filled ... · 2 probed under large...
TRANSCRIPT
From firm to fluid - Structure-texture relations of filled gels1
probed under Large Amplitude Oscillatory Shear2
T.J. Fabera,b,1,∗, L.C.A. van Breemenb, G.H. McKinleyc3
aFrieslandCampina, PO box 1551, 3800 BN Amersfoort, The Netherlands4bPolymer Technology, Eindhoven University of Technology, PO Box 513 ,5600 MB Eindhoven, The Netherlands5
cDepartment of Mechanical Engineering, Massachusetts Institute of Technology,6
77 Massachusetts Avenue, Cambridge - MA 02139, USA7
Abstract8
Soft-solid foods show a progressive transition from a viscoelastic solid state to a flowing fluid
state when subjected to a large load. The engineering properties and sensory texture of soft-
solid foods depend strongly on the rheological properties that characterize this fluidization.
In this paper we use Large Amplitude Oscillatory Shear (LAOS) rheometry to quantify the
texture of emulsion-filled food gels in terms of measurable material properties . We provide
unambiguous rheological definitions for the firmness, rubberiness, softening and fluidization
of soft-solid food gels. We propose a new measure for the load-induced solid-fluid transition,
the fluidizing ratio, which quantifies the progression of damage and the degree of plastic flow
in the soft-solid gel. We use another dimensionless measure, the thickening ratio, to reveal
and characterize the resulting sequence of flow regimes. We use our rheological definitions
to quantify the texture of zero-fat, low-fat and full-fat semi-hard cheese respectively. Our
data provides evidence that the rate of two physical processes, microcrack nucleation and mi-
crocrack propagation, are controlled by the amount of fat emulsion in the gel and govern the
rubberiness and brittleness of semi-hard cheese. By translating texture terminology into quan-
titative material properties measured using Large Amplitude Oscillatory Shear, we augment
the capabilities of LAOS as an analytical tool for structure-texture engineering of soft-solid
food gels.
Keywords: emulsion-filled gels, fluidization, food texture engineering, microstructure,9
LAOS10
1. Introduction11
Product reformulation, the replacement or removal of ingredients from a product in or-12
der to reduce caloric content, raw material costs, or carbon footprint, is a major theme in the13
structured processed-food industry (Norton et al., 2006; Almeida-Rivera et al., 2007). Rad-14
ical reformulation often leads to deficits in the sensory texture profile of the food product15
∗corresponding authorEmail address: [email protected] (T.J. Faber)
Preprint submitted to Journal of Food Engineering December 16, 2016

(Renard et al., 2006), but numerous alternative structuring routes are available that potentially16
over-come this trade-off (Van der Sman and Van der Goot, 2009; Mezzenga et al., 2005; Dick-17
inson, 2012; Stokes and Frith, 2008). Due to constraints of time and money, a systematic and18
effective approach is needed to choose between these structuring alternatives. Such a ratio-19
nal approach requires models that relate the food microstructure to its sensory texture profile20
(Aguilera, 2005).21
Panel tests provide detailed and quantitative information on how formulation influences22
the sensory texture profile (Drake, 2007), however the datasets obtained do not give any clues23
to the relation between microstructure and texture. On the contrary, rheological measure-24
ments, such as the creep-recovery experiment for example, do provide information on the25
material microstructure, as well as quantitative measures for the ‘firmness’ and ‘rubberiness’26
of soft-solid gels, which are measures quantifying the resistance of the gel to deform and27
to flow respectively (Fig. 1(a,b), Faber et al. (2016a)). Hutchings and Lillford (1988) argue28
that narrowing down a texture attribute to a point on a curve of an instrumented texture mea-29
surement, is an over-simplification of the concept of sensory texture. They point out that the30
perceived texture is a measure of the process of breaking down structure, rather then the mea-31
surement of an equilibrium state. In previous work, we have treated the firmness of cheese, a32
soft-solid emulsion-filled gel, as a time-dependent, linear viscoelastic property (Faber et al.,33
2016b). The time-dependency of firmness reflects the dynamic aspect of the perception of34
this texture attribute (Scott Blair and Coppen, 1940). We developed an equation of state for35
the firmness containing two intrinsic material properties: the first is a scale factor or “quasi-36
property” denoted G, which sets the scale of the stress in the material, and the magnitude of37
this scale factor is determined by the extent to which the structural elements form a space-38
spanning network, the level of ’crowding’ in the material and the stiffness of the structural39
elements (Palierne, 1990, 1991; Mellema et al., 2002; Pal, 2008; Stokes and Frith, 2008; Bot40
et al., 2014) The second material property in our equation of state, the fractional exponent β,41
quantifies the frequency and temporal response of the cheese and its magnitude is determined42
by the rate of rearrangements of protein colloids and aggregates (Mellema et al., 2002; Van43
Vliet et al., 1991; Van Vliet and Walstra, 1994).44
Thus for food materials belonging to the class of soft-solid, emulsion-filled gels, a structure-45
texture engineering model is in place to keep the firmness on a constant level while changing46
the food’s composition. Developing structure-texture relations for the rubberiness of these47
types of food products is a more challenging task though. In Faber et al. (2016a) we defined48
rubberiness as the amount of strain recovered at the end of the creep / recovery experiment49
and, as in our expression for the firmness, we quantified rubberiness from the magnitude of50
2

G, β and the time of duration of the experiment. Our equation predicts approximately equal51
rubberiness for all cheese compositions in the linear viscoelastic regime, whereas panel tests52
have shown that reduced fat cheese is perceived as more rubbery than full fat cheese (Yates and53
Drake, 2007; Childs and Drake, 2009). Our creep recovery tests showed that distinctions in54
the rubberiness were only revealed when the material response became amplitude-dependent,55
implying that rubberiness is a textural attribute that reflects the non-linear response of the56
material. This is in line with the antonym for rubbery, which is ‘moldable’, and which has57
connotations to the plastic nature of cheese (Davis, 1937). This suggests that a rheological58
measure for the rubberiness of cheese, should be based on a test that probes the yielding and59
plastic response of the material (Barnes, 1999).60
Large Amplitude Oscillatory Shear (LAOS) experiments are very suitable for simulta-61
neously probing the time-dependent and amplitude-dependent response of materials in one62
test protocol (Hyun et al., 2011). Furthermore, data obtained in LAOS provides informa-63
tion on the underpinning physical processes responsible for the collapse of microstructure64
(Rogers et al., 2011b), which is a prerequisite for structure-texture modeling. In recent years,65
a number of non-linear material functions have been proposed to facilitate physical interpre-66
tation of the large datasets that are generated by modern rheometers in LAOS experiments67
(Cho et al., 2005; Ewoldt et al., 2008; Rogers et al., 2011b; Dimitriou et al., 2013; Ewoldt,68
2013a). Cho et al. (2005) were the first to consider strain- and strain-rate as two independent69
orthogonal inputs in a controlled-strain LAOS experiment (henceforth denoted LAOStrain,70
(Dimitriou et al., 2013)), and they additively decomposed the resulting stress into an elastic71
and a viscous contribution. Ewoldt et al. (2008) elaborated on the concept of stress decom-72
position, and used Chebyshev polynomials of the first kind to quantify the inter-cycle and73
intra-cycle evolution of the elastic and viscous stresses. They showed that the coefficients74
of the Chebyshev polynomials are physically relevant non-linear material functions. They75
developed an ontological framework that characterizes and quantifies the evolution of the76
shape of the Bowditch-Lissajous curves that visualize the response of a material to Large77
Amplitude Oscillatory Shear. Their framework consists of appropriately-defined orthogonal78
higher order dynamic moduli and viscosities, and descriptions of elastic and viscous non-79
linearities in terms of physical mechanisms such as strain hardening and softening, or shear80
thinning and thickening. This ontological framework was recently extended to incorporate81
definitions for Large Amplitude Oscillatory Shear experiments performed in controlled stress82
mode (LAOStress, Laeuger and Stettin (2010); Dimitriou et al. (2013); Ewoldt (2013a)).83
Rogers et al. (2011b) interpret the shape of the Bowditch-Lissajous curve of yield stress84
fluids undergoing large amplitude oscillatory shear, in terms of a sequence of physical pro-85
3

cesses (SPP) that describe the transition of these type of materials from a “solid” to a “soft”86
state. The dynamic aspect of this transition was denoted by active terms like “yielding”, ‘shear87
melting” and “fluidization” (Helgeson et al., 2007). The underpinning physical processes were88
described from the perspective of microstructural elements being trapped and escaping from89
surrounding cages, while the cages are themselves stretching and transitioning in anisotropic90
flows of clusters (Laurati et al., 2014; Rogers et al., 2011b; Min Kim et al., 2014). In this pa-91
per we also interpret the LAOS response of our soft-solid gels in terms of physical processes92
that lead to the progressive collapse of the underlying microstructure. However, the onset and93
progression of flow occurs not just because of particle and cluster rearrangement but also be-94
cause of nucleation and propagation of cracks in the gel phase. This has recently been shown95
by Leocmach et al. (2014) to be the governing physical process that drives the collapse of96
brittle protein gels like cheese (the material under investigation in the present study).97
Charalambides et al. (1995) use measures from solid mechanics such as energy release98
rate, fracture toughness and Young’s modulus to derive structure-function relations for Ched-99
dar cheese. Their focus is thus on either the ultimate failure point or the initial stress-strain100
response of the compression curve. We find this approach to deriving structure-function rela-101
tions somewhat limited, as both the time-dependency of the response, as well as the transition102
from viscoelastic to a elastoviscoelastic response remains uncharacterized. Both aspects are103
crucial in describing firmness and the transition of a soft-solid to a flowing fluid. Similar argu-104
ments hold against the use of fracture strain and fracture stress measured in torsion gelometry105
to derive structure-function relations of cheese. In this technique capstan shaped cylinders are106
twisted until fracture (Tunick and Van Hekken, 2002). Furthermore, both techniques require107
samples with a minimum level of firmness in order to be cut into a cylindrical shape that can108
hold its own weight. Shear rheometry does not have this constraints and can therefore also be109
applied to soft, spreadable foodstuffs.110
Tariq et al. (1998) where the first to apply Large Amplitude Oscillatory Shear measure-111
ments on a soft-solid food material, being Mozarella Cheese. They used spectral analysis, a112
viscoelastic constitutive model and a visual inspection of the Lissajous curve to quantify de-113
parture from linearity. Numerous studies now exist in which the Large Amplitude Oscillatory114
Shear protocol is used to characterize food materials, here we briefly discuss some typical115
examples and approaches to derive structure-texture relations from LAOS data. Van der Vaart116
et al. (2013) systematically changed the microstructure of dark chocolate melt suspensions117
to study the effect on the flow properties of the melts. These properties are a predictor for118
both the processability as well as the final sensory texture of the chocolate. Ng et al. (2011)119
analyzed the rheological properties of the gluten gel phase of wheat-flour dough. It is widely120
4

believed that these properties have a strong influence on the breadmaking qualities. They used121
a constitutive model that describes the observed power-law relaxation, finite extensibility and122
progressive transition to a softer network. Sun et al. (2014) related the strain-stiffening of123
gelatin gels measured in LAOStrain to the molecular and network architecture using a con-124
stitutive model that accounted for the fractal nature of the network. Ptaszek et al. (2016)125
used LAOS to characterize the nonlinear rheological properties of fresh wet foams, prepared126
with egg white protein and stabilized using hydrocolloids. Melito et al. (2013) used statistical127
techniques to correlate panel test data to the magnitude of the non-linear material functions128
of Cheddar cheese. They compared the response to that of Mozarrella, in which the protein129
strands are more anisotropic and American cheese, which has a less compact and fused struc-130
ture. Rogers et al. (2009) also correlated large strain experiments to the sensory profile of131
Cheddar cheese differing in age and fat content. These correlations pointed towards the extent132
of strain weakening as the critical measure to differentiate in texture attributes.133
All of these previous studies contain elements required for building a structure-texture134
engineering model. However they don’t provide unambiguous rheological measures for “tex-135
ture”, which are ultimately required to make an explicit connection between the sensory tex-136
ture profile and the microstructure of soft-solid foods. In this paper, we use LAOStress and137
LAOStrain to quantify and characterize the solid-fluid transition of semi-hard cheese, a canon-138
ical example of a soft-solid, emulsion-filled, gel. We define quantitative measures for the139
firmness, rubberiness, brittleness and fluidization of cheese. First we show how firmness and140
rubberiness are quantified from the first-harmonic moduli and compliances. Then we demon-141
strate how the progression of damage and onset of flow are quantified from the evolution in the142
shape of the elastic Bowditch-Lissajous curve. We quantify the extent of solid-fluid transition143
with a new measure, the fluidization ratio, and characterize the resulting fluid with a modified144
thickening ratio. We show that the presence of a minimum amount of emulsion in the gel,145
gives rise to a highly non-linear elastoviscoplastic response and that fat content and water-146
protein ratio are the critical control parameters for achieving the correct level of firmness,147
rubberiness, brittleness and fluidization. We conclude by interpreting the magnitude of our148
quantitative rheological measures for the texture of soft-solid gels in terms of the microscopic149
physical processes that lead to the collapse of the cheese microstructure.150
The differences from the work of Tariq et al. (1998) and the present work are threefold.151
First, the authors used the generalized Maxwell model with discrete relaxation spectrum to152
fit stress-strain responses. This required eight to eighteen parameters for a reasonable fit. We153
use a two-parameter fractional constitutive model not only to fit the response at a given strain154
amplitude and frequency, but also to predict the response at alternate strain amplitudes and155
5
frequencies. I.e. our model is more compact and more effective. Second, we not only visualize156
the onset of a non-elliptical shape, we also quantify the shape evolution using geometrically157
defined moduli. Third, we quantify and characterize the onset of non-linearity using concepts158
of rubberiness, softening, fluidization, rate thickening and rate thinning.159
2. Materials and methods160
2.1. Cheese composition161
Foil ripened Gouda rectangular cheeses (500 × 300 × 100 mm) were acquired at an age162
of 3-14 days and kept at 5◦C to minimise compositional changes due to protein breakdown or163
(de-)solubilization of minerals (Lucey et al., 2005; O’Mahony et al., 2006) . Fat content was164
varied by using cheese from three fat classes: zero-fat (≈ 0% fat in dry matter, fidm), low fat165
(≈ 20% fidm) and full-fat (≈ 48% fidm). The cheese was analyzed for composition according166
to international standards (standard in brackets): pH (NEN 3775, Netherlands Normalisation167
Institute), l-lactic acid (ISO 8069, International Standard Organisation), protein (through total168
nitrogen / soluble nitrogen / anhydrous nitrogen fractions (Visser, 1977)), ash (Association of169
Official Analytical Chemists AOAC 930.30), calcium (insoluble calcium phosphate, AOAC170
984.27), lactose (ISO 5762-2), water (=100-total solids (ISO 5534)), fat (ISO 1735) and chlo-171
ride (ISO 5943). Weight fractions of protein, water and fat were converted to volume fractions172
according to the procedure outlined by Yang et al. (2011) taking the temperature-dependent173
densities of these main cheese constituents from Sahin and Sumnu (2006).174
2.2. Cheese hydration175
Cheese slices of approximately 60× 60× 4.5 mm were cut from a block coming from the176
core of the cheese using a wire cutter with a wire thickness of 0.3 mm. To provide cheese with177
different water / protein ratios (w/w%, denoted as w/p), the hydration procedure developed178
by Luyten (1988) was followed, with slight adaptations for shear rheometry. Part of the slices179
were hydrated in a salt solution, which had equal concentration of calcium (Ca2+) and chloride180
(Cl−) as in the moisture of the non-hydrated cheeses on a molar basis. For the fraction of181
soluble calcium (out of total calcium) a value of 20% was assumed (McMahon et al., 2005).182
Hydration was performed by submersing a single cheese slice for 1, 2, 4, 8, 16 or 24 hours in183
250 ml of the salt solution. After this period, slices were taken from the liquid and excessive184
moisture was carefully removed with tissue paper. Just before and after hydration the slices185
were weighed. From the weight increase the new water/protein ratio was calculated, assuming186
that the concentration of soluble components in the cheese moisture remained the same and187
6

that there was no net transfer of material from the cheese to the liquid. Slices were wrapped188
in aluminum foil and kept in the refrigerator for 2-3 days to allow for moisture equilibration189
(Luyten, 1988). From each cheese slice, three discs of 25 mm diameter and approximately190
4.5 mm thickness were punched for parallel plate shear rheometry. The punch was designed191
such that contact area with the disc was minimized. Exact thickness of the disc was recorded192
using the gap width measurement of the rheometer. Samples that were tested at temperatures193
of T = 25◦C were allowed to equilibrate to room temperature (T = 20◦C) in aluminum foil194
for at least 30 minutes prior to further preparation .195
2.3. Large amplitude oscillatory shear rheology196
Measurements were performed with a Physica MCR501 Rheometer (Anton Paar, Austria)197
with a parallel plate geometry. To prevent slip, serrated upper and lower plates were used.198
The temperature of the lower plate was controlled with a Peltier stage, and the upper plate199
and cheese environment were thermally controlled with a cap hood. The upper plate was200
lowered with a speed of 25 µm/min until a normal force of 2 N (8 kPa) was reached. The201
gap width was recorded at that point and decreased by an extra 2% while keeping the normal202
force constant at 2 N to ensure full contact with the cheese, resulting in an initial gap width203
range of 4.2 - 4.4 mm. While conducting LAOStrain and LAOStress measurements, the gap204
distance was controlled by keeping the normal force at a fixed level of 2 N. After loading the205
sample between the two parallel plates it was heated at a heating rate of 0.5◦C per minute206
until the desired temperature of either T = 10 ◦C or T = 25 ◦C was reached. The exposed207
surface area of the sample was covered with sunflower oil to minimise sample drying during208
the experiment. A maximum weight loss of 0.5 w/w% was recorded. Measurements were209
started 100 seconds after the equilibrium temperature was reached. Automatic adjusting time210
and averaging settings were used to avoid inter-cycle transient effects at constant stress or211
strain amplitudes.212
To test if slip was eliminated the stress-strain response of a cycle was analyzed on the213
presence of one of the following indicators for slip: 1) irregular fluctuations in the stress-214
strain response of the Lissajous curves; 2) broadband noise in the Fourier Transform stress-215
strain response; 3 ) a-symmetry and unclosed loops in the Lissajous curve; 4 ) a magnitude216
of the ratio of the first and second harmonic of the Fourier Transform of the stress-strain217
response n1/n2 > 0.1 (Tariq et al., 1998); 5) Secondary loops in the Lissajous curve plotted218
from the viscous perspective (Tariq et al., 1998). In addition marker tests were performed on219
a selection of samples (Chakrabarti, 2006). From these analyses we conclude that we have220
minor slip in our measurements, that only occurs at strains well in the non-linear regime. The221
7

marker tests also showed the absence of edge fractures. Strain amplitudes at which minor slip222
occurs are indicated with filled symbols in Fig. 5(a), Fig. 5(b), Fig. 7(a), and Fig. 7(b). Size223
independence of the material response was confirmed with measurements on a selected set of224
samples using an alternate plate diameter of 50 mm and a sample with a thickness of 2.3 mm225
respectively.226
LAOStrain. Strain sweeps were conducted at a frequency ω = 5 rad/s and a logarithmical227
increase of the strain amplitude γ0 from 0.01 to 100 %, at temperatures of T = 10 ◦C and228
T = 25 ◦C.229
LAOStress. Stress sweeps were conducted at a frequency ω = 5 rad/s and a logarithmical230
increase of the stress amplitude σ0 from 10 to 105 Pa, at temperatures of T = 10 ◦C and231
T = 25 ◦C.232
Frequency sweep. To probe the time-dependency of the LAOStrain and LAOStress response,233
strain sweeps and stress sweeps were repeated on different samples of the same test material,234
at a frequency ω = 0.2, 0.5, 1, and 2 rad s−1 and a temperature of T = 25 ◦C.235
Creep compliance. A large step stress σ0 was imposed on the test specimen of amplitude236
σ0 = 1000 Pa and held at this value for t = 100 s at fixed measuring temperatures of either237
T = 10 ◦C or T = 25 ◦C, while measuring the resulting strain γ(t;σ0). Subsequently the238
imposed stress was released and the resulting strain recovery or recoil was measured for t =239
100 s.240
2.4. Confocal Scanning Laser Microscopy (CSLM)241
A Leica inverted CSLM (TCS SP2, DM IRE2) was used. The water/protein phase was242
stained with fluorescent isothiocyanate (FITC) and the fat phase with Nile red (0.1%/0.01%).243
Staining occurred by placing a sample of approximately 1 × 5 × 5 mm3 in a solution of the244
dyes in a glycerol / water / polyethyleneglycol (PEG) (45/5/50 %) mixture for 30 minutes. All245
cheese manipulations (cutting and staining) were done at 8 ◦C in the cold room to prevent fat246
melting. Stained cheese was transported to the confocal microscope in a Petri dish placed in a247
polystyrene foam box containing frozen ice pack isolated by rubber foam. Image acquisition248
was done below 15 ◦C using a conditioned air flow. Single 2D images were obtained from249
the internal structure, by imaging at a depth of about 10 µm below the surface generated with250
a razor blade. The frame size of all images was 119.05 ×119.05 µm (1024 × 1024 pixels)251
obtained with a water immersion objective (63×, NA = 1.2). Baseline adjustment and auto-252
dye-finding were applied to all images acquired using LEICA Confocal Software (LCS).253
8

3. Results and discussion254
3.1. Firmness and Rubberiness255
3.1.1. Firmness256
In previous work we have demonstrated that the firmness F of a food gel, is a time-257
dependent, linear viscoelastic property, which can best be measured in a controlled-stress258
experiment (Faber et al., 2016a). In Fig. 2(c) we show the result of measuring the firmness of259
cheese in a creep / recovery experiment at a time t f = 100 s (circles), where the firmness is260
defined as the inverse of the creep compliance at the end of the creep phase,261
F ≡ 1/J(t f ) (1)
which has units of Pa. Note that the time of t f = 100 s is a user-defined choice. In (Faber262
et al., 2016b) we provide an extensive analysis of the effect of the loading conditions on the263
response of cheese in the creep-recovery test, and show that the creep response of cheese is264
well described by a power-law in time. A well-defined ‘equilibrium time’ therefore does not265
exist. However we also show that the effect of t f on the magnitude of the firmness F is eas-266
ily quantified once the intrinsic linear viscoelastic material properties of cheese are extracted267
from the creep response. The measurements presented in Fig. 2(c) are performed on zero-fat268
cheese (blue symbols), which is an unfilled gel (micrograph in Fig. 2(a)), and full-fat cheese269
(red symbols), which is an emulsion-filled gel (micrograph in Fig. 2(b)) and at two temper-270
atures of T = 10◦C (filled symbols) and T = 25◦C (hollow symbols). Fig. 2(c) shows two271
effects of dispersing fat in the gel phase. First, at T = 10◦C, the fat acts as a strong firmness272
enhancer: the compliance J(t) of zero-fat cheese (blue filled circle) decreases by a factor of273
seven compared to full-fat cheese (red filled circle), and the firmness F thus increases by the274
same factor. Second, at T = 25◦C, the full-fat curve shows a clear inflection point, marked275
with a cross, whereas the slope of the creep curve for zero-fat cheese at T = 25◦C continu-276
ously declines. We have shown in previous work that this inflection point, marks a transition277
from primary creep to tertiary creep and ultimately fracture, caused by the formation and278
propagation of microcracks in the gel phase (Faber et al., 2016b; Leocmach et al., 2014). This279
signature of a non-linear response, should be avoided when measuring the firmness F, since280
this textural attribute is defined in the linear viscoelastic regime. This implies that when com-281
paring firmness of several materials a suitable combination of stress amplitude σ0 and creep282
time t f must be chosen (the ‘stress-time’ (Davis, 1937; Faber et al., 2016b)), such that none of283
the materials display a non-linear response. This requires either an iterative testing procedure,284
or very small stress amplitudes and times. Both are inconvenient, especially when a large285
9
number of formulations, varying over a wide range of firmness, need to be measured. A Large286
Amplitude Oscillatory Shear-experiment in controlled-stress mode (LAOStress, (Dimitriou287
et al., 2013)), does not have the limitation of imposing a single loading condition per test run.288
Instead, a range of stress amplitudes σ0 can be imposed, where the lower limit of σ0 can289
be set such that for all the materials tested the material response within the linear viscoelastic290
regime is probed, regardless of their firmness. In the same test run, the non-linear properties291
can be probed as well, by choosing the appropriate upper-limit of the stress amplitude range.292
In the LAOStress experiment, a cosinusoidal oscillating stress σ(t) is imposed (Ewoldt,293
2013a), defined by:294
σ(t) = σ0 cosωt (2)
where the time-scale of the oscillation is set by the frequency ω. We define the firmness F,295
measured using a LAOStress experiment at a frequency ω f , as the inverse of the magnitude296
of the complex creep compliance,297
F ≡ 1/∣∣∣J∗(ω f )
∣∣∣ (3)
which has units of Pa, like the definition for the firmness F presented in Eq. (1). In the298
LAOStrain experiment, a sinusoidal oscillating strain γ(t) is imposed, defined by (Ewoldt,299
2013a):300
γ(t) = γ0 sinωt (4)
where the maximum strain is set by the strain amplitude γ0, and the time-scale by the fre-301
quency ω. When the imposed strain is in the linear viscoelastic range, we can define a linear302
viscoelastic complex shear modulus G∗(ω) . Substituting the relation (Ferry, 1980)303
|J∗(ω)| |G∗(ω)| = 1 (5)
in the oscillatory-stress based definition of the firmness F, Eq. (3), we obtain304
F ≡∣∣∣G∗(ω f )
∣∣∣ = F, (6)
i.e. at a test frequency ω f and temperature T the magnitude of the firmness F of a material305
measured using LAOStrain is equal to the magnitude of the material’s firmness F measured306
using LAOStress. In appendix A we show that this is indeed the case.307
For soft-solid gels that display power-law stress relaxation over a broad range of time-308
scales (e.g. cheese), the magnitude of the complex shear modulus G∗(ω) is accurately de-309
scribed by (Jaishankar and McKinley, 2013):310
|G∗(ω)| = Gωβ (7)
10

in which G and β are the material parameters of the Scott Blair model. The ‘quasi-property’311
G is a scale factor that sets the scale of the stress in the material with units of Pa sβ, the dimen-312
sionless fractional exponent β quantifies the temporal and frequency response of the material.313
The magnitude of linear viscoelastic material functions, such as the creep compliance J(t) in314
Eq. (1), the shear complex compliance J∗(ω) in Eq. (3), and the complex shear modulus in315
G∗(ω) in Eq. (3) are readily inter converted and can also be expressed in terms of these two in-316
trinsic material propertiesG and β (Jaishankar and McKinley (2013); Table A.1 in Faber et al.317
(2016b)). Fitting the Scott Blair model’s expression for the creep compliance (Eq. (A.10) in318
Faber et al. (2016b)) to the data for the creep response of full-fat cheese at T = 10 ◦C (red,319
filled) and zero-fat cheese at T = 10 ◦C and T = 25 ◦C (blue, filled and hollow) in Fig. 2(c),320
shows that the response of these three samples is indeed in the linear viscoelastic regime (fit321
not shown here, Faber et al. (2016a,b)).322
Fourier transformation of a non-linear viscoelastic stress response, σ(t;ω, γ0) to an im-323
posed oscillatory strain gives (Ewoldt, 2013a):324
σ(t;ω, γ0) = γ0
∑n:odd
{G′n sin nωt + G′′n cos nωt
}(8)
where the non-linear material functions G′n(ω, γ0) and G′′n (ω, γ0), are the nth harmonic dy-325
namic elastic and viscous moduli respectively. The first-harmonic dynamic elastic and vis-326
cous modulus {G′1(ω, γ0),G′′1 (ω, γ0)}, are average measures of the dynamic modulus over one327
full cycle (Ewoldt et al., 2008). In the linear viscoelastic regime, these moduli are equal to328
the shear storage modulus G′1(ω, γ0)=G′(ω), and shear loss modulus G′′1 (ω, γ0)=G′′(ω) re-329
spectively. From G′1(ω, γ0) and G′′1 (ω, γ0) we calculate the magnitude of the first-harmonic330
complex modulus, G∗1(ω, γ0) , using331 ∣∣∣G∗1(ω, γ0)∣∣∣ =
√G′1
2 + G′′12 (9)
The magnitude of the complex modulus G∗(ω) , and thus the firmness F, is equal to the plateau332
value for the first-harmonic complex modulus G∗1(ω, γ0) .333
In Fig. 3(a) we show values of the first-harmonic complex modulus G∗1(ω, γ0) determined334
in a strain sweep at a frequency ω = 5 rad s−1, for samples of the same test materials as used in335
Fig. 2(c). We have plotted the magnitude of the firmness F as circles on the vertical axis. The336
shading on the left ordinate axis, with a gradient from top to bottom indicates schematically337
the ranking of the samples from firm to soft. As in Fig. 2(c) the response of full-fat cheese at338
T = 10 ◦C (red, filled circle) and zero-fat cheese at T = 10 ◦C and T = 25 ◦C (blue, filled339
and hollow circles) is predominantly linear viscoelastic, the order of ranking from firm to soft340
is identical for these samples to the order in Fig. 3(a). Although firmness is a time-dependent341
11

property and the timescales of the measurements in Fig. 2(c) and Fig. 3(a) vary widely, this342
does not influence the ranking on firmness. The magnitudes for the fractional exponent β343
of the three samples, which quantify temporal effects on the firmness measurements F and344
F, only show a small variation from 0.15 < β < 0.19. In the linear viscoelastic regime the345
ranking on firmness is thus governed by the difference in magnitude of the quasi-property G.346
The firmness measurement of full-fat cheese at T = 25 ◦C is based on a non-linear re-347
sponse in Fig. 2(c), whereas in Fig. 3(a) the firmness measurement is based on a linear vis-348
coelastic response. As a result the full-fat cheese at T = 25 ◦C is ranked firmer than the349
zero-fat cheese at T = 10 ◦C in Fig. 3(a) whereas in Fig. 2(c) the ranking between the two350
cheeses types is reversed. This demonstrates that the propensity for a soft-solid material to351
yield has a significant effect on the apparent magnitude of the firmness in a creep / recovery352
experiment.353
3.1.2. Rubberiness354
In previous work we have defined ‘moldability’ as the antonym for ‘rubberiness’ (Faber355
et al., 2016a). Moldability refers to the plastic nature of cheese (Davis, 1937): if the loading356
of the cheese is severe enough, part of the imposed strain is irrecoverable, and the sample357
deformation becomes permanent. In the stress-strain curve of a ductile plastic material loaded358
in tension or compression, the strain beyond which deformation will be permanent is clearly359
visible as a local maximum in the stress. This maximum is referred to as the ‘yield point’,360
and the coordinates give the yield stress (σy) and yield strain (γy) respectively. Reiner and361
Scott Blair (1967) define yielding as an abrupt event, which marks the beginning of ‘flow’ in362
a material, where ‘flow’ is defined as non-recoverable deformation proceeding in time. These363
definitions show that the concepts of rubberiness, plasticity, flow and yielding are strongly364
interrelated.365
In the creep phase of the creep / recovery experiment, the yielding event is marked by an366
inflection point in the compliance-time curve, defined by367
mindJ(t)
dt= σ−1
0 mindγ(t)
dt= σ−1
0 γ(t)min (10)
where γ(t)min is the minimum in the instantaneous strain rate profile (computed by differ-368
entiating the measured shear strain γ(t)). The yield point in a non-linear creep / recovery369
experiment, is thus the point in time where the strain rate in the material reaches a local mini-370
mum value. In Fig. 2(c) the yield point for full-fat cheese at T = 25◦C (hollow red squares) is371
clearly visible, and is denoted with a cross. The time t at which yielding occurs is denoted as372
the yield-time ty and has a magnitude of ty = 45 seconds. For times t < ty the deformation is373
12

predominantly that of a viscoelastic solid, and for materials that display power-law relaxation,374
such as cheese, the strain-rate decreases exponentially in time so that, γ(t) ∝ tβ−1 for t < ty,375
where β is the fractional exponent. This regime is commonly denoted as ‘primary creep’376
or ‘Andrade’ creep (Andrade, 1910). The yield-time ty, marks the transition from ‘primary’377
creep to a deformation regime where the strain-rate γ(t) diverges as (ty − t)−1, as a result of378
rapid growth of fractures in the sample (Leocmach et al., 2014). This regime is denoted as379
‘tertiary’ creep. The transition regime of ‘secondary’ creep, is the region of irrecoverable or380
plastic flow. If the stress is released from the sample during the secondary creep regime, the381
extent of plastic flow can be measured as the unrecoverable strain γ∞(t), or unrecoverable382
compliance J∞(t) = γ∞(t)/σ0, in the recovery phase of the creep / recovery experiment. The383
overall material response is then commonly called elastoviscoplastic.384
In Faber et al. (2016a) we have defined rubberiness as the relative amount of recovered385
compliance,386
R ≡J(t f ) − J(t f + ∆tr)
J(t f )(11)
where t f is the time of observation for measuring firmness (i.e. the elapsed time at the end of387
the creep phase) and ∆tr is the elapsed time of recovery at which we measure the rubberiness388
R. In Fig. 2(c) the absolute extent of unrecovered compliance for each of the four samples, is389
depicted by the last square marker of each creep / recovery curve, at time t = ∆tr+ t f = 200 s.390
The magnitude of the rubberiness R of each sample is plotted as a triangle on the right-hand391
ordinate axis, using a coloring scheme that corresponds to the colors used for the samples392
of the curves. The three samples that do not yield during the creep phase, full-fat cheese at393
T = 10 ◦C (red, filled triangle) and zero-fat cheese at T = 10 ◦C and T = 25 ◦C (blue, filled394
and hollow triangles) show a small variation in the magnitude of the rubberiness R. We have395
shown previously that in the linear viscoelastic regime the magnitude of R is governed by the396
magnitude of the fractional exponent β, not by the quasi-property G, and that the recorded397
values of the unrecovered compliance is merely a finite time-effect (Faber et al., 2016b). For398
times ∆tr � t f , the amount of strain will asymptotically approach zero and the rubberiness399
R ≈ 1.400
Various sources report that reduced-fat cheese is perceived as more rubbery than full-fat401
cheese (Yates and Drake, 2007; Childs and Drake, 2009), a discrimination we do not find402
for the three samples discussed above. The measurement of the rubberiness of the full-fat403
cheese at T = 25◦C in Fig. 2(c) (red hollow triangle) shows that it requires a yielding event to404
make the discrimination between zero-fat and full-fat cheese. As a result of the yielding and405
13
subsequent plastic flow, the rubberiness of the full-fat cheese at T = 25◦C is a factor of 2.5406
lower than the three non-yielded samples. This suggest that incorporating a measure of ‘the407
resistance to yield’ will provide a more suitable definition for rubberiness than ‘the extent to408
which a sample return to its original shape’ proposed by Faber et al. (2016a).409
In order to measure the resistance to yield in the creep / recovery experiment, a stress-410
time loading must be chosen that leads to yielding of all the samples in the creep phase.411
This requirement for the loading condition is exactly the opposite of what we required for412
the firmness measurement in the previous section, and implies that firmness and rubberiness413
cannot easily be measured in a single creep / recovery experiment. Furthermore, if we want414
to use Eq. (11) to quantify rubberiness, the imposed load must lead to a elastoviscoplastic415
deformation that is viscometric for the complete duration of the creep phase; wall slip, fracture416
or inhomogeneous flow of the sample will complicate the analysis. These two constraints on417
the loading conditions again require an iterative testing procedure, and are nearly impossible418
to meet when the firmness and yield strains of the samples vary widely. So the same arguments419
discussed earlier also hold for rubberiness and rationalize why a LAOS experiment is preferred420
over a series of creep / recovery experiments.421
In LAOStrain, the resistance to yield is quantified by the magnitude of the yield strain422
amplitude γ0,y, and therefore we define the rubberiness R:423
R ≡ γ0,y. (12)
The rubberiness R, measured in LAOStrain, is thus a dimensionless quantity, just as the424
rubberiness R measured with the creep / recovery experiment ( Eq. (11)). The magnitude of425
the yield strain amplitude γ0,y is determined using the relation426 ∣∣∣∣∣∣ |G∗1(ω, γ0)| − |G∗(ω)||G∗(ω)|
∣∣∣∣∣∣ > y (13)
where we use y = 0.01 as the measure for yielding. The magnitudes of the rubberiness R of427
zero-fat (blue) and full-fat cheese (red), at the two temperatures of T = 10 ◦C (filled symbols)428
and T = 25 ◦C (filled symbols), are plotted as triangles on the horizontal axis in Fig. 3(a).429
Note that the full-fat cheese at T = 10 ◦Cand T = 25 ◦C, have swapped position in the order430
of ranking on rubberiness as compared to Fig. 2(b). The same holds for the zero-fat cheese431
measured at T = 10 ◦C and T = 25 ◦C.432
In this section we have argued that one can interchangeably use the LAOStress- or LAOStrain-433
method to measure the firmness of a food gel. However the two shearing protocols result in434
different magnitudes for the rubberiness both in a relative and absolute sense, as we demon-435
strate in Appendix A. There we prove that that the magnitude of the material rubberiness R436
14

measured using LAOStrain, is equal to the magnitude of the rubberiness R measured using437
LAOStress, normalized by the firmness of the material, R = R/F. We thus have to select be-438
tween the two methods for quantifying rubberiness. We prefer the LAOStrain-measure for the439
rubberiness R over the LAOStress-measure R for three reasons. Firstly, LAOStrain provides440
a measure for the rubberiness that is independent of the firmness of the material, whereas441
the LAOStress method does not. The second argument is that R has the (dimensionless) unit442
of accumulated material strain, just as in the definition of the rubberiness R measured in the443
creep / recovery experiment, whereas R has units of stress. In food rheology, it is common444
practice to reserve units of Pa for quantifying the stiffness, hardness or firmness of food mate-445
rials (Davis, 1937; Sherman, 1970; Duizer et al., 2011). A final practical argument in favour446
of LAOStrain measurements, is that they more readily allow probing the material response447
deeper into the fluid regime, which we demonstrate in Fig. 3(b,c). We have plotted the intra-448
cycle maximum of the stress during LAOStrain measurement, σmax (unfilled squares), as a449
function of the imposed strain amplitude, γ0, for zero-fat (blue, Fig. 3(b)) and full-fat cheese450
(red, Fig. 3(c)). The intra-cycle maxima are calculated using Eq. (8). In Fig. 3(b,c) we have451
also plotted the intra-cycle maxima of the measured strain γmax (filled squares), as a function452
of the imposed stress amplitude σ0 , using Eq. (A.2). The combination of the stress-induced453
rise in the compliance J∗1(ω,σ0) , and the simultaneous increase in the stress amplitude σ0 in454
LAOStress, results in a self-catalyzed, abrupt failure of the material which is absent in LAOS-455
train. As a result, the range of stress amplitude σ0 over which deformations can be controlled456
in LAOStress, is smaller than the range of intra-cycle maxima that can be measured in the457
stress σmax during LAOStrain deformation.458
3.2. Softening vs. Fluidization459
Fig. 3(a) shows three routes towards a decrease in the first harmonic complex modulus460
G∗1(ω, γ0) of a full-fat cheese at T = 10◦C (red squares): 1) reformulation by removing all the461
fat (from filled red circle to filled blue circle); 2) increasing the temperature T (indicated by the462
white arrow from red filled square to red unfilled square), and 3) increasing the imposed strain463
amplitude γ0 (indicated by the red dashed arrow alongside the red filled squares). A popu-464
lar descriptive term for a material with low modulus (or high compliance) is ‘soft’ (Ewoldt,465
2013b). Hence a rheological definition of “softening” measured using LAOStrain could be466
‘a decrease in the first harmonic complex modulus G∗1(ω, γ0) ’. ‘Soft’ has connotations with467
’pleasant touch’ (Essick et al., 2010). This suggests that the ‘softening’ of cheese always in-468
creases the user affinity and that any of the three routes towards a decrease in G∗1(ω, γ0) are469
suitable. Below we show that this is not the case and that the term “softening” requires further470
15

specification.471
Route 1, reformulation of the cheese by removing fat, makes the cheese less caloric, and472
less firm, but also more rubbery. Calorie reduction is an incentive for cheese reformulation,473
however an increase in rubberiness is undesired (Yates and Drake, 2007). Furthermore, we474
have shown in previous work (Faber et al., 2016b) that the reduced firmness of the zero-fat475
cheese will lead to sagging of the cheese blocks during storage, which is a second undesired476
side-effect of the cheese reformulation. Route 2, increasing the temperature T , decreases477
the firmness (indicated by the white arrow in Fig. 3(a) and has only a minor effect on the478
rubberiness. By storing the cheese at T = 10◦C sagging will not be an issue. Increase of the479
cheese temperature in the mouth will induce the transition from firm to soft as indicated by480
the white arrow in Fig. 3(a). Route 3, increasing the strain amplitude γ0, does not affect the481
caloric content, nor the firmness, nor the rubberiness of the cheese, but transitions the full-fat482
cheese from a more solid to a more fluid state, as indicated by the dashed arrow in Fig. 3(a).483
The example above demonstrates that ‘softening’ of a soft-solid gel can have very different484
origins from a rheological perspective, and is not always favorable from a user affinity or ma-485
terial processing perspective. It is therefore too generic a measure to build structure-property486
relations on, and we propose to use two separate terms to describe the reduction in the mod-487
ulus G∗1(ω, γ0) of soft-solid food gels such as cheese. We define ‘softening’ as a decrease in488
the firmness, i.e. by changing the composition or the temperature of the material. We thus489
reserve the term ‘softening’ for modifications of the intrinsic, linear viscoelastic properties of490
the food gel. In Fig. 3(a), softening is depicted by the vertical gradient in the shaded area to491
the left.492
For strain-induced softening, a process which does not change the intrinsic material prop-493
erties of the cheese, we use the term ‘fluidizing’. This term is commonly used in the study of494
granular materials (Kunii and Levenspiel, 1991), to indicate the transition from a static solid-495
like to a dynamic fluid-like state. Recently the term has gained a foothold in LAOS studies496
on yield stress fluids, to separate the event that marks yielding, from the subsequent process,497
i.e. the progression of irreversible flow (Rogers et al., 2011a; Laurati et al., 2014; Min Kim498
et al., 2014). In Fig. 3(a) we have marked yielding by a point on the abscissa (triangles) and499
use it to quantify rubberiness. Fluidization of the full-fat cheese at T = 10◦C, is indicated500
by the dashed arrow to demonstrate it is a process rather than an event. Fluidization covers501
a range of strain amplitudes that is either broad, such as for the full-fat cheese in Fig. 3(a)502
(red squares), or small, like for the zero-fat cheese (blue squares). Fig. 3(a) shows that the503
broadness of the fluidizing regime, is inversely correlated to the yield strain amplitude γ0,y,504
and thus rubberiness R. In Fig. 3(a), the increase the rubberiness is depicted by the horizontal505
16
gradient in the shaded area at the bottom of the figure.506
Our measurements show that the addition of fat to zero-fat cheese increases the propensity507
of semi-hard cheese to soften when temperature is increased, as well as the propensity of the508
cheese to fluidize under an increasing load. Both temperature-induced softening, as well as509
load-induced fluidization occur during oral processing and have connotations to the in-mouth510
“melting” of soft-solid food gels. Our distinct rheological definitions for ‘softening’ and ‘flu-511
idization’ allow for separation of these two contributions to ‘meltability’ and to identify the512
structure parameters that drive the melting sensation of soft-solid food gels such as semi-hard513
cheese.514
3.3. Damage progression and failure515
To visualize the deformation-induced fluidization of cheese, we plot the material response516
to the imposed sinusoidal oscillating strain as ‘Bowditch-Lissajous’ curves of the material517
response, henceforth referred to compactly as Lissajous plots. In Fig. 4(a)-(c) we show Lis-518
sajous plots for a selection of strain amplitudes γ0 from oscillatory strain sweeps performed519
on zero-fat cheese (blue lines) at T = 10 ◦C, and at frequencies of (a) ω = 1 rad s−1and (b) ω520
= 5 rad s−1. The elliptical shapes of the curves in Fig. 4(a) and (b) indicate that the material521
response is linearly viscoelastic for strain amplitudes γ0 ≤ 0.2. The trajectory of the ellipse522
{γ(t), σ(t)} is described by (Ng et al., 2011)523
σ2 − 2σγG′ + γ2(G′2 + G′′2) = G′′2γ02 (14)
We have shown previously that within the range of 1 rad s−1 < ω < 5 rad s−1, zero-524
fat cheese displays power-law relaxation, and the magnitude of the storage and loss moduli525
{G′(ω),G′′(ω)} that enter Eq. (14) are described by the powerlaw equation of state or ‘Scott526
Blair element’ (Faber et al., 2016b; Jaishankar and McKinley, 2013) such that:527
G′(ω) = Gωβ cos (πβ/2)
G′′(ω) = Gωβ sin (πβ/2)(15)
To compare this model with the data we need to determine the two material parame-528
ters G and β. By performing a strain-sweep of the first-harmonic dynamic moduli G′1(ω, γ0)529
and G′′1 (ω, γ0) at ω= 1 rad s−1, reading out the magnitude of the phase angle δ reported530
by the rheometer software in the linear viscoelastic regime, and using the relation tan(δ) =531
G′′(ω)/G′(ω) = tan (πβ/2) , we obtain the magnitude of β = 0.19. The magnitude of the532
quasi-property G = 1.4 ×10⁴ Pa sβ is readily obtained by reading out the magnitude of the533
17

first-harmonic complex modulus G∗(ω, γ0) in the linear viscoelastic regime, and using the534
relation |G∗(ω)| = Gωβ (Jaishankar and McKinley, 2013).535
Fig. 4(a) and (b) show that the model described by Eq. (14) and Eq. (15) (circles), correctly536
predicts the shape of the ellipses as a function of strain amplitude γ0 and frequency ω in the537
linear viscoelastic regime. In Fig. 4(c), the strain amplitude exceeds the yield strain amplitude538
of zero-fat cheese γ0 > γ0,y u 0.3 and the material response becomes elastoviscoplastic (EVP).539
The curvature of the Lissajous plot changes from the elliptical shape predicted by the model540
(dashed blue line), to a ‘banana-shaped’ curve (blue continuous line), which indicates a non-541
linear material response and is typical for damaged elastomers (Merabia et al., 2010). The542
‘banana-shape’ is also encountered when loading rubbery food materials like dough (Ng and543
McKinley, 2008) and Mozzarella cheese (Melito et al., 2013) in LAOStrain mode.544
In order to quantify the intra-cycle non-linearities such as those shown in Fig. 4(c), Cho545
et al. (2005) proposed additively decomposing the total stress into an elastic (′) and a viscous546
(′′) part:547
σTOT AL = σ′(x) + σ′′(y) (16)
where the arguments x and y are the normalized strain and normalized strain-rate respectively548
x ≡ γ(t)/γ0 = sinωt
y ≡ γ(t)/γ0 = cosωt(17)
The magnitude of the elastic stress σ′ and viscous stress σ′′ are related to the Fourier decom-549
position of the stress-signal in Eq. (8) by (Cho et al., 2005; Ewoldt et al., 2008)550
σ′ ≡σ(γ, γ) − σ(−γ, γ)
2= γ0
∑n:odd
G′n(ω, γ0) sin nωt
σ′′ ≡σ(γ, γ) − σ(γ,−γ)
2= γ0
∑n:odd
G′′n (ω, γ0) cos nωt(18)
The dashed red line in Fig. 4(c) shows the model prediction of the intra-cycle evolution of551
the elastic stress σ′, which is described by the linear relation σ′(ω, γ) = Gωβ cos (πβ/2) γ.552
The actual measured response of σ′(γ) (solid red line) shows positive curvature, a signature553
of non-linearity (Ewoldt and Bharadwaj, 2013). The predicted maximum in the elastic stress554
of the linear viscoelastic model is given by σ′max(ω, γ0) = Gωβ cos (πβ/2) γ0, (hollow square)555
and deviates from the measured magnitude of σ′max (filled square). This deviation is a second556
signature of non-linearity in the material response. The same two features of non-linearity557
are observed in Fig. 4(d) where we have plotted the measured stress against the imposed558
strain rate, to provide a ‘viscous perspective’ of the three-dimensional space curve σ(γ, γ)559
(Ewoldt et al., 2008). The predicted evolution of the viscous stress as a function of strain560
18

rate is given by σ′′(ω, γ) = G′′(ω)γ/ω = Gωβ−1 sin (πβ/2) γ and is plotted as a red dashed561
line. The predicted maximum in the viscous stress is given by σ′′max(ω, γ0) = G′′(ω)γ0 =562
Gωβ sin (πβ/2) γ0 and is plotted as an unfilled circle in Fig. 4(c) and (d). The actual value of563
the stress at a strain of γ = 0 (corresponding to the viscous stress in the cheese) is shown by564
the filled circle.565
Fig. 4(c) shows that in the elastoviscoplastic regime, the linear viscoelastic constitutive566
model over predicts the maximum in the elastic stress; the damage accumulating in the gel567
causes a loss of strength in the elastic network (Mari et al., 2014). In Fig. 5(a) we visualize568
the inter-cycle progression of damage in zero-fat cheese, by plotting the measured response569
σ′max(γ0) (squares), and compare these to the prediction of the linear viscoelastic constitutive570
model (solid line). The cycles denoted with roman numbers correspond to the cycles high-571
lighted in Fig. 3(b) and depicted in Fig. 6(a). Up to the yield point at cycle I, the maximum572
elastic stress grows with strain amplitude at a rate predicted by the fractional constitutive573
model: Gωβ cos (πβ/2) = F cos (πβ/2) (Eq. (15),(6)), where F is the frequency-dependent574
firmness measured in LAOStrain. For strain amplitudes below the yield strain amplitude γ0 <575
γ0,y(with γ0,y≡ R, the magnitude of the rubberiness measured in LAOStrain), all of the strain576
is recoverable, even though there is viscous dissipation as denoted by the circles. The rate577
of recovery is governed by the magnitude of the fractional exponent β, and the time-scale of578
the deformation ω (Faber et al., 2016a). Between cycle I and II, at strain amplitudes γ0 >579
γ0,y, the formation of microcracks result in a elastoviscoplastic response (Faber et al., 2016b;580
Leocmach et al., 2014), which leads to a decrease in the inter-cycle growth rate of the max-581
imum elastic stress σ′max(γ0) and an increase in the amount of irrecoverable strain. At cycle582
II a global maximum in σ′max(γ0) is reached, which we denote as the elastic failure stress σ′f583
of the material. The failure strain at this point has a value of γ0, f ≈ 0.7. Beyond the fail-584
ure point, the elastic stress declines. The most probable cause is microcracks in the protein585
network percolating into larger fractures (Leocmach et al., 2014).586
The response of the maximum elastic stress σ′(γ) in the full-fat cheese, an emulsion-filled587
gel, is remarkably different from the zero-fat cheese, an unfilled gel. Fig. 5(b) shows that588
the initial growth-rate of σ′max(γ0) is larger for the full-fat cheese than for zero-fat cheese,589
as a result of the higher firmness. However, since the magnitude of the rubberiness of full590
fat cheese is smaller, the material displays a elastoviscoplastic response prior to cycle I. The591
probable cause for the shift of the plastic response towards lower strain amplitudes is local-592
isation of strains in the gel phase, caused by the presence of the micron-sized spherical fat593
globules, which plasticize the matrix (Hall, 1991; Smit et al., 1999). Both zero-fat and full-fat594
cheese fail at similar strain amplitudes of γ0, f≈ 0.7. (Note that we have indicated the strain595
19

amplitudes γ0 at which mild slip is observed with filled symbols, both in Fig. 5(a) and both in596
Fig. 5(b)) However, full-fat cheese displays a broad plateau in the elastic stress prior to failure,597
and, as a result, the amount of plastic deformation accumulated prior to failure is significantly598
larger than in zero-fat cheese. According to Reiner and Scott Blair (1967) the amount of plas-599
tic deformation prior to failure is inversely correlated with brittleness, as they define ‘brittle’600
as “tending to break under the condition of minimal previous plastic deformation”. Shah et al.601
(1995) base their definition of ‘brittle’ on the stress-response to a deformation after the peak602
stress. In a brittle material, the stress suddenly drops to zero whereas in ‘ductile’ materials603
the stress is maintained at a constant level. In ‘quasi-brittle’ materials, like rock, concrete604
and clay, the stress gradually decreases after the peak stress is reached. Van den Berg et al.605
(2008) also correlated the extent of brittle failure of uniaxially compressed food gels to the606
rate of stress decrease after the peak stress. Using the definitions for ‘brittleness’ from Reiner607
and Scott Blair (1967) and Shah et al. (1995), the mode of failure in zero-fat cheese may be608
viewed as more brittle then in full-fat cheese. Fig. 5(a) and Fig. 5(b) show a correlation be-609
tween the magnitude of the elastic failure stress σ′f , or peak stress, and the rate of decline of610
the intracycle maximum in the elastic stress σ′max(γ0) after the preak stress is reached. This611
suggests that the magnitude of σ′f is a strong indicator for the brittleness of soft-solid gels.612
3.4. Quantifying and characterizing fluidization613
An alternative approach to characterizing the evolution of damage and the onset of flow614
in soft-solid gels, is through geometrically-defined dynamic moduli that quantify the non-615
linearity of the material’s response (Ewoldt et al., 2008). In Fig. 6(a) we have plotted the616
evolution in the elastic stress σ′(γ) for the cycles denoted I, II and III for-zero fat cheese at617
T = 25 ◦C (blue lines). The endpoint of each curve represents the maximum elastic stress618
σ′max(γ0) (squares, plotted for all cycles in Fig. 5(a)). The dashed lines represent the dynamic619
tangent modulus G′K at conditions corresponding to maximum strain (γ = γ0) and zero strain620
rate (γ = 0). In the linear viscoelastic regime, (cycle I in Fig. 6(a)), the magnitude of this621
tangent modulus is equal to the magnitude of the storage modulus i.e. G′K ≡ G′(ω), and the622
dashed line coincides with the (linear) blue curve for the elastic stress. In the non-linear623
regime, the tangent curves rotate clock-wise, indicating that the magnitude of G′K decreases.624
Both for zero-fat cheese, Fig. 6(a), and full-fat cheese, Fig. 6(b), we interpret the decline in625
G′K as a measure of damage accumulating in the gel phase, leading to a loss of strength in the626
gel at large strains.627
A major benefit of decomposing the oscillating stress response into elastic and viscous628
stress contributions, is that these two curves are single-valued functions of the strain or strain629
20

rate respectively. This facilitates the quantification of non-linearity of the material response,630
e.g. by fitting a polynomial function to the curve (Cho et al., 2005). Ewoldt et al. (2008)631
show that the Chebyshev polynomials of the first kind (Abramowitz and Stegun, 1964) are the632
most suitable choice of functions. These polynomials satisfy the criteria of orthogonality over633
a finite domain, rotational symmetry, rapid convergence, and a direct one-to-one correspon-634
dence to techniques of time-domain Fourier Transform rheology (Ewoldt et al., 2008). The635
Chebyshev basis functions Tn(x) are defined by the recurrence relation636
T0(x) = 1
T1(x) = x
Tn+1(x) = 2xTn(x) − Tn−1(x)
(19)
Expressions for the elastic stress σ′ and the viscous stress σ′′ are given in terms of these basis637
functions by638
σ′ = γ0
∑n:odd
en(ω, γ0)Tn(x)
σ′′ = γ0
∑n:odd
vn(ω, γ0)Tn(y)(20)
where en and vn are the n-th order material coefficients, that quantify the elastic and viscous639
stress response to the normalized strain x and strain rate y respectively. The relationship640
between the Chebyshev coefficients and the Fourier coefficients for odd values of n from641
Eq. (8) are (Ewoldt et al., 2008)642
en = G′n(−1)(n−1)/2
vn =G′′nω
(21)
The maximum strain elastic tangent modulus G′K is readily calculated from the magnitude of643
the individual elastic Chebyshev harmonic coefficients en:644
G′K =dσ′
dγ
∣∣∣∣∣γ=γ0
= e1 + 9e3 + 25e3 + ... (22)
Equations (22) and (21) show us that for cycle I in Fig. 6(a), for which the response is fully645
described by the first-harmonic n = 1, we have, G′K = e1 = G′1 = G′(ω). We use the elastic646
coefficients obtained by fitting the data in Fig. 6(a) and (b) to quantify the differences in the647
non-linear response of the zero-fat and full-fat cheese respectively.648
In Fig. 6(c) and (d) we also depict the full elastic Lissajous curves for cycle I, II and III for649
zero-fat cheese ((c), blue) and full-fat cheese ((d), red). The dynamic elastic tangent moduli650
G′M at minimum strain γ = 0, and maximum strain rate max{γ(t)} = γ0 = ωγ0 (dashed lines)651
are plotted through the maxima of the viscous stress σ′′max (shown by open circles). Again we652
21

see a clockwise rotation of the tangents, indicating an inter-cycle decrease of the minimum653
strain modulus. This modulus G′M is calculated from the elastic Chebyshev coefficients en by654
G′M =dσ′
dγ
∣∣∣∣∣γ=0
= e1 − 3e3 + 5e5 + ... (23)
Dimitriou et al. (2013) suggest that for yielding materials, like cheese, the decrease in the655
material function G′M is a measure for the onset of plastic flow in the material, as it probes656
the elastoplastic material response at maximum strain rate. In combination with G′K , which657
we interpret as a measure of the accumulation of damage in the elastic network, we thus have658
two material functions that together quantify the solid-fluid transition of soft-solid gels under659
dynamic loading. We quantify the level of fluidization, i.e. the extent to which the elastic660
solid gel has transitioned into a flowing fluid by a dimensionless fluidizing ratio661
Φ ≡G′K −G′M
G′K=
12e3 + 20e5 + ...
e1 + 9e3 + 25e5 + ...(24)
This ratio is defined in anology to the hardening ratio H introduced by Ewoldt et al. (2008),662
however we use the tangent modulus G′K instead of the secant modulus G′L to characterise663
the material response at maximum strain. A secant modulus averages the contribution of both664
large straining and rate of shearing to the material response, by contrast the tangent modulus665
at large strains (and zero strain rate) provides a more local measure of the residual elastic666
properties of the damaged gel.667
Visual inspection of Fig. 6(a)-(d) shows that the rate of decrease of the modulus G′M at668
maximum strain rate is larger than for G′K , which results in positive values of the fluidizing669
ratio Φ. In Fig. 7(a) we have plotted the evolution of Φ for zero-fat cheese (blue) and full-fat670
cheese (red) measured in a LAOStrain sweep at a temperature of T = 25 ◦C. The strain at671
which fluidization sets in is a measure for the rubberiness R of the cheese, the plot thus shows672
at a glance that zero-fat cheese is an order of magnitude more rubbery than full-fat cheese.673
The ultimate magnitude of Φ for both cheese types is comparable at large strains γ0 ≈ 1,674
suggesting that in full-fat cheese fluidization is ultimately dominated by structural changes in675
the gel phase (which is common to both materials).676
In analogy to this dimensionless function Φ that quantifies fluidization from an elastic per-677
spective, we define a thickening ratio Θ, which tracks the evolution of the solid-fluid transition678
from the viscous perspective:679
Θ ≡η′K − η
′M
η′K=
12v3 + 20v5 + ...
v1 + 9v3 + 25v5 + ...(25)
where η′K and η′M are the dynamic tangent viscosities at maximum strain rate, and zero strain680
rate (maximum strain) respectively. These viscosities are calculated from the Chebyshev har-681
monics vn by682
22

η′K =dσdγ
∣∣∣∣∣γ=γ0
= v1 + 9v3 + 25v5 + ...
η′M =dσdγ
∣∣∣∣∣γ=0
= v1 − 3v3 + 5v5 + ...
(26)
Also here we have taken the original definition of the thickening ratio T from Ewoldt et al.683
(2008) and replaced the dynamic secant viscosity by a tangent viscosity. We retain the term684
‘Thickening’ ratio however, and the use of the antonyms ‘thick’ and ‘thin’ to describe the685
resistance and propensity to flow respectively, as this terminology is common in the texture686
profiling of fluid food materials (Jowitt, 1974). By using the symbol Θ instead of T we indicate687
that this measure is calculated using only tangent viscosities.688
In Fig. 6(e) and (f) we show the Lissajous curves for cycle II for zero-fat cheese (blue)689
and full-fat cheese (red) from the viscous perspective. The black solid lines represent the690
viscous stress σ′′(γ). For full-fat cheese we need to retain information up to (at least) the fifth691
harmonic to describe the evolution in viscous stress with strain rate. By contrast, for zero-fat692
cheese, the leading order non-linearity is third-order and addition of the fifth harmonic which693
is very small (v5 ≈ v3/10) does not have a significant impact on the magnitude of η′Kor Φ.694
In Fig. 7(b) we show the evolution of the Thickening ratio Θ of zero-fat cheese (blue) and695
full-fat cheese (red) at a frequency of ω = 5 rad s−1. From the data in Fig. 7 it is possible to696
clearly differentiate between the responses of the different cheeses, and from the characteris-697
tics of the three regimes (denoted A, B and C), we can infer the sequence of physical processes698
(Rogers et al. (2011b)) by which the microstructure collapses in each case. To augment our699
physical interpretation of the mechanical response of the zero-fat cheese curve (blue), we can700
make use of the microrheological studies on unfilled, brittle protein gels from Leocmach et al.701
(2014); the three regimes A, B, C are analogues of the primary, secondary and tertiary creep702
identified in their controlled stress experiments. In regime A, the response of zero-fat cheese703
is predominantly linear viscoelastic and Θ ≈ 0. In this regime all deformations are recover-704
able and there is no plastic flow. In regime B, fluidization sets in as microcracks nucleate and705
propagate in the gel matrix. The progressive collapse of the microstructure results in strain706
softening and a shear thinning response. In regime C, the percolating cracks form sample-707
spanning fractures, which results in the ultimate failure of the gel. Again note that we have708
indicated the strain amplitudes γ0 at which mild slip is observed with filled symbols, both in709
Fig. 7(a) and both in Fig. 7(b).710
The response of the full-fat cheese (red curve) in Fig. 7(b) is remarkably different. First711
we observe mild inter-cycle shear thinning, starting at low strain amplitudes in regime A.712
We attribute this response to an increased rate of strain localization in the gel, induced by713
23

the present emulsion. In regime B, the softening is arrested, and the response changes to a714
local inter-cycle shear thickening analogous to the rubber toughening observed in brittle ther-715
moplastic composites (Hall, 1991; Wu, 1985). As the strain amplitude increases further, the716
process of crack propagation continues, which ultimately leads to the extreme shear thinning717
observed in regime C. Beyond cycle II the sample deformation becomes inhomogeneous and718
therefore we have connected the three points in this interval with a dashed line in Fig. 7(a)719
and Fig. 7(b).720
The comparison of the breakdown path of zero-fat and full-fat cheese demonstrates that721
the addition of the fat emulsion to the gel, also adds one level of complexity to the breakdown722
pathway for the cheese microstructure.723
3.5. Comparing formulations on of the basis of the evolution of Φ and Θ724
In this final section, we demonstrate that evaluating the fluidization ratio Φ, alongside our725
re-defined thickening ratio Θ, augments the capabilities of LAOS as an analytical tool for726
structure-texture engineering of soft-solid gels, thereby making reformulation studies more727
effective. In Fig. 8(a,b) we have plotted the magnitudes of (a) Φ, and (b) Θ, of zero-fat (blue),728
low-fat (green), and full-fat (red) cheese, at T = 10 ◦C. These cheese types contain a fat729
volume fraction of φ f = 0v/v%, φ f = 12v/v%, and φ f = 30v/v% respectively. The plots with730
the filled symbols represent a decrease of ∆T = 15◦C with respect to the measurements from731
Fig. 7 (which we have replotted in Fig. 8 for quantitative comparison using shaded and hollow732
symbols). All of the data in Fig. 8 are truncated such that only two of the three flow regimes733
discussed in the previous section are visible; regime A characterized by mild fluidization as734
a result of microcrack nucleation and propagation, and regime B corresponding to strong735
fluidization arising from flowing gel fragments.736
We define a critical strain amplitude γc as the strain amplitude for which the fluidizing737
ratio Φ > 0.1. The magnitude of the critical strain for full-fat cheese γc u 0.01 is a factor738
of 12 lower then for low-fat cheese (γc u 0.12), whereas the filler volume fraction of full-fat739
cheese is a factor of 2.5 higher. This data is consistent with a previously suggested relationship740
between the critical strain and the filler volume fraction γc ∝ 1/φ3f , motivated by arguments741
that the fluidization scales linearly with surface to surface inter-particle distance of the filler742
(Wu, 1985).743
The critical strain γc of full-fat cheese at T = 25 ◦C (red hollow symbols, γc u 0.04)744
is a factor of 4 higher then at T = 10 ◦C (red filled symbols). This is only partly explained745
by the temperature-induced increase in γc of the gel phase, which is only a factor of 1.25746
for the same temperature increase of ∆T = 15◦C (blue filled vs hollow symbols, γc u 0.20747
24

and γc u 0.25 respectively ). The remaining increase in the critical strain for full-fat cheese,748
must come from the melting of the fat particles. Using composite models, Yang et al. (2011)749
estimate that over the temperature range of T = 10 ◦C to T = 25 ◦C the melting of fat leads750
to a decrease in shear modulus of the fat particles by a factor of ∼ 200. This softening results751
in a significant fraction of the imposed macroscopic strain accumulating in the fat globules at752
T = 25 ◦C, whereas for the rigid particles at T = 10 ◦C this strain localization in the fat phase753
is negligible.754
In Fig. 8(c,d) the water content of the gel, expressed as the water / protein ratio w/p with755
units of g/g, is raised by 33% from w/p= 1.8 to w/p= 2.4. Fig. 8(c) shows that the hydra-756
tion of cheese does not affect the rate of sample softening or microcrack formation. However757
Fig. 8(d) demonstrates that hydration has a significant effect on the resulting fluid-like char-758
acteristics of the fluid properties of full-fat cheese (red) in non-linear regime B. The response759
of Θ changes from shear thickening (hollow symbols) to shear thinning (filled symbols). A760
probable cause is that in the hydrated samples the voided regions following crack formation,761
are rapidly invaded with water (as shown for diluted casein gels by Leocmach et al. (2014)),762
which acts as a low viscosity lubricant in the void spaces between the viscous fat droplets763
and the gel matrix. A second important factor is that hydration makes the protein gel matrix764
softer and therefore more pliable, which reduces frictional forces between two neighboring765
gel fragments. Additional evidence for the hypothesis that the gel firmness affects friction,766
comes from the change in the response of zero-fat cheese from thickening to thinning when767
increasing the temperature from T = 10 ◦C to T = 25 ◦C, which reduces the firmness F by a768
factor of 2.4.769
The plots of the thickening ratio Θ in Fig. 8(b,d), show that the emulsified fat phase770
plays a pivotal role in modulating the solid-fluid transition of cheese also. Full-fat cheese771
shows strong responses to an increase in shear (b,d), temperature (b), and degree of hydration772
(d), respectively, the three most important processes occurring in the mouth. Reduction of fat773
content significantly reduces the magnitude of these response functions. Our microrheological774
interpretation, supported by the strain sweeps of the fluidizing ratio Φ and thickening ratio Θ,775
show that alternative structuring routes for low fat cheeses with limited volumes of the fat776
filler, should be aimed at reducing the surface to surface average inter-particle distance, and777
enhancing the temperature-induced softening of the filled gel.778
25

4. Conclusions779
In this paper, we have used Large Amplitude Oscillatory Shear (LAOS) both in controlled-780
stress and controlled-strain mode (LAOStress and LAOStrain, respectively), to quantify and781
characterize the solid-fluid transition of semi-hard cheese, a soft-solid, enulsion-filled, gel.782
We defined quantitative measures for the firmness, rubberiness, softening, and fluidization of783
cheese and interpreted the magnitudes and evolution of these measured parameters in terms784
of physical processes that lead to the progressive collapse of the cheese microstructure.785
We defined firmness F as a resistance to deformation and quantified this texture attribute786
as the inverse of the magnitude of the complex creep compliance in LAOStress, 1/|J∗(ω)| , or787
the magnitude of the complex shear modulus in LAOStrain |G∗(ω)| , which are interchange-788
able measures. We defined rubberiness R as a resistance to flow, which is quantified as either789
the magnitude of the yield stress amplitude σ0,y in LAOStress, or the yield strain amplitude790
γ0,y in LAOStrain. The yield point is the point where the complex creep compliance, or com-791
plex shear modulus, departs measurably from its plateau value, and the material response792
changes from that of a linear viscoelastic solid to a non-linear elastoviscoplastic material. The793
LAOStrain protocol for measuring the firmness F and rubberiness R is preferred over the cor-794
responding LAOStress measures (F and R), since it results in rubberiness and firmness being795
two independent quantities. Furthermore LAOStrain allows for larger controlled loadings in796
the non-linear, fluidized, regime, while still retaining a homogeneous viscometric flow field.797
We proposed a set of definitions to distinguish between alternative routes for ‘softening’798
a cheese. We defined ‘softening’ as decreasing the firmness, by changing the intrinsic, linear799
viscoelastic material properties. ‘Fluidization’ is clearly demonstrated to be the load-induced800
transition of the cheese from a more solid-like to a more fluid-like state.801
Fluidization of a soft-solid gel can be abrupt or gradual, which we have visualized by802
plotting the magnitude of the intra-cycle maximum in the elastic stress σ′max(γ0) as a function803
of strain amplitude. We identified the peak in the elastic stress as the failure stress σ′f of the804
gel, and argued that the magnitude of σ′f is an indicator of the ’brittleness’ of the sample.805
We augmented the ontological framework for LAOS developed by Ewoldt et al. (2008)806
to quantify the progression of damage and onset of flow in soft-solid gels. We have defined807
two ratios based on local tangency conditions to the elastic and viscous Lissajous curves, that808
highlight the changes in the materials modulus and viscosity at zero and maximum strain /809
strain-rate respectively. The first is the fluidization ratio Φ which quantifies the extent and rate810
of fluidization in the material’s elastic properties. The second is the redefined thickening ratio811
Θ that characterizes the non-linearities in the viscous response of the resulting fluid.812
26

Our LAOS-based measures for firmness, rubberiness, softening, fluidization and rate thick-813
ening unambiguously quantify the texture profile of soft-solid food gels in multiple dimen-814
sions. These rheological measures also provide insight into the structure parameters that need815
to be controlled for an optimal texture profile. Our measurements on semi-hard cheese show816
that the fat particles emulsified in the water/protein gel phase, have a pivotal role in increas-817
ing the sensitivity of the appropriate material response functions of cheese to temperature and818
shear, i.e. in increasing the propensity of the food material to soften and fluidize. From our819
data we inferred that the inter-particle surface to surface distance and the temperature sensi-820
tivity of the emulsified filler, as well as the water-protein ratio of the gel, are the key structure821
parameters that largely control the softening and fluidizing properties of semi-hard cheese.822
This new suite of material measures, tested on a wide range of formulations of semi-hard823
cheese, have illustrated how to augment the capabilities of LAOS, so that is can serve as an824
analytical tool for structure-texture engineering of soft-solid food gels.825
Acknowledgments826
The authors thank Prof. H. Meijer, Dr. A. Jaishankar, and Dr. H. Luyten for useful827
discussions and guidance, and Anne van de Pijpekamp for technical assistance. We also thank828
FrieslandCampina for funding this research.829
References830
Abramowitz, M. and Stegun, A. (1964). Handbook of Mathematical Functions. U.S. National831
Bureau of Standards, Washington.832
Aguilera, J. M. (2005). Why food micro structure? Journal of Food Engineering, 67(1-2):3–833
11.834
Almeida-Rivera, C., Jain, P., Bruin, S., and Bongers, P. (2007). Integrated product and process835
design approach for rationalization of food products. Computer Aided Chemical Engineer-836
ing, 24:449–454.837
Andrade, E. N. D. C. (1910). On the viscous flow in metals and allied phenomena. Proceed-838
ings of the Royal Society of London. Series A, 84(567):1–12.839
Barnes, H. A. (1999). The yield stress - a review or ‘παντα ρει’ - everything flows? Journal840
of Non-Newtonian Fluid Mechanics, 81(1-2):133–178.841
Bot, A., Foster, T. J., and Lundin, L. (2014). Modelling acidified emulsion gels as Matryoshka842
composites: Firmness and syneresis. Food Hydrocolloids, 34:88–97.843
27
Chakrabarti, S. (2006). Ingredient Interactions effects on food quality, chapter Probing ingre-844
dient functionalities in food systems using rheological methods., pages 49–87. CRC Press,845
Taylor and Francis group, 2nd edition.846
Charalambides, M., Williams, J., and Chakrabarti, S. (1995). A study of the influence of847
ageing on the mechanical properties of cheddar cheese. J Mater Sci, 30(16):3959–3967.848
Childs, J. L. and Drake, M. (2009). Consumer perception of fat reduction in cheese. Journal849
of Sensory Studies, 24(6):902–921.850
Cho, K. S., Hyun, K., Ahn, K. H., and Lee, S. J. (2005). A geometrical interpretation of large851
amplitude oscillatory shear response. Journal of Rheology, 49(3):747–758.852
Davis, J. G. (1937). 162. The rheology of cheese, butter and other milk products. (the mea-853
surement of “body” and “texture”). Journal of Dairy Research, 8:245–264.854
Dickinson, E. (2012). Emulsion gels: The structuring of soft solids with protein-stabilized oil855
droplets. Food Hydrocolloids, 28(1):224–241.856
Dimitriou, C. J., Ewoldt, R. H., and McKinley, G. H. (2013). Describing and prescribing the857
constitutive response of yield stress fluids using Large Amplitude Oscillatory Shear stress858
(LAOStress). Journal of Rheology, 57(1):27–70.859
Drake, M. A. (2007). Invited review: Sensory analysis of dairy foods. Journal of Dairy860
Science, 90(11):4925–4937.861
Duizer, L. M., James, B., Corrigan, V. K., Feng, J., Hedderley, D. I., and Harker, F. R. (2011).862
Use of a panel knowledgeable in material science to study sensory perception of texture.863
Journal of Texture Studies, 42(4):309–318.864
Essick, G. K., McGlone, F., Dancer, C., Fabricant, D., Ragin, Y., Phillips, N., Jones, T., and865
Guest, S. (2010). Quantitative assessment of pleasant touch. Neuroscience and Biobehav-866
ioral Reviews, 34(2):192–203.867
Ewoldt, R. H. (2013a). Defining nonlinear rheological material functions for oscillatory shear.868
Journal of Rheology, 57(1):177–195.869
Ewoldt, R. H. (2013b). Extremely soft: Design with rheologically complex fluids. Soft870
Robotics, 1(1):12–20.871
Ewoldt, R. H. and Bharadwaj, N. A. (2013). Low-dimensional intrinsic material functions for872
nonlinear viscoelasticity. Rheologica Acta, 52(3):201–219.873
Ewoldt, R. H., Hosoi, A. E., and McKinley, G. H. (2008). New measures for character-874
izing nonlinear viscoelasticity in large amplitude oscillatory shear. Journal of Rheology,875
52(6):1427–1458.876
Faber, T. J., Jaishankar, A., and McKinley, G. H. (2016a). Describing the firmness, springi-877
ness and rubberiness of food gels using fractional calculus. Part I: Theoretical framework.878
28

submitted to Food Hydrocolloids.879
Faber, T. J., Jaishankar, A., and McKinley, G. H. (2016b). Describing the firmness, springiness880
and rubberiness of food gels using fractional calculus. Part II: Measurements on semi-hard881
cheese. submitted to Food Hydrocolloids.882
Ferry, J. D. (1980). Viscoelastic properties of polymers. Wiley, New York.883
Hall, R. (1991). Computer modelling of rubber-toughened plastics: random placement of884
monosized core-shell particles in a polymer matrix and interparticle distance calculations.885
Journal of Materials Science, 26(20):5631–5636.886
Helgeson, M. E., Wagner, N., and Vlassopoulos, D. (2007). Viscoelasticity and shear melting887
of colloidal star polymer glasses. Journal of Rheology, 51(2):297–316.888
Hutchings, J. B. and Lillford, P. J. (1988). The perception of food texture - the philosophy of889
the breakdown path. Journal of Texture Studies, 19(2):103–115.890
Hyun, K., Wilhelm, M., Klein, C. O., Cho, K. S., Nam, J. G., Ahn, K. H., Lee, S. J., Ewoldt,891
R. H., and McKinley, G. H. (2011). A review of nonlinear oscillatory shear tests: Anal-892
ysis and application of Large Amplitude Oscillatory Shear (LAOS). Progress In Polymer893
Science, 36(12):1697–1753.894
Jaishankar, A. and McKinley, G. H. (2013). Power-law rheology in the bulk and at the in-895
terface: Quasi-properties and fractional constitutive equations. Proceedings of the Royal896
Society A: Mathematical, Physical and Engineering Sciences, 469(2149).897
Jowitt, R. (1974). The terminology of food texture. Journal of Texture Studies, 5(3):351–358.898
Kunii, D. and Levenspiel, O. (1991). Fluidization engineering. Butterworth-Heinemann,899
Boston.900
Laeuger, J. and Stettin, H. (2010). Differences between stress and strain control in the non-901
linear behavior of complex fluids. Rheologica Acta, 49(9):909–930.902
Laurati, M., Egelhaaf, S., and Petekidis, G. (2014). Plastic rearrangements in colloidal gels903
investigated by LAOS and LS-Echo. Journal of Rheology, 58(5):1395–1417.904
Leocmach, M., Perge, C., Divoux, T., and Manneville, S. (2014). Creep and fracture of a905
protein gel under stress. Physical Review Letters, 113:038303.906
Lucey, J. A., Mishra, R., Hassan, A., and Johnson, M. E. (2005). Rheological and calcium907
equilibrium changes during the ripening of cheddar cheese. International Dairy Journal,908
15(6-9):645–653.909
Luyten, H. (1988). The rheological and fracture properties of Gouda cheese. PhD thesis,910
Dairy Science, Wageningen University.911
Mari, R., Seto, R., Morris, J., and Denn, M. (2014). Shear thickening, frictionless and fric-912
tional rheologies in non-Brownian suspensions. Journal of Rheology, 58(6):1693–1724.913
29

cited By 24.914
McMahon, D. J., Paulson, B., and Oberg, C. J. (2005). Influence of calcium, pH, and moisture915
on protein matrix structure and functionality in direct-acidified nonfat mozzarella cheese.916
Journal of Dairy Science, 88(11):3754–3763.917
Melito, H., Daubert, C., and Foegeding, E. (2013). Relationships between nonlinear viscoelas-918
tic behavior and rheological, sensory and oral processing behavior of commercial cheese.919
Journal of Texture Studies, 44(4):253–288.920
Mellema, M., Van Opheusden, J., and Van Vliet, T. (2002). Categorization of rheological921
scaling models for particle gels applied to casein gels. Journal of Rheology, 46(1):11–29.922
Merabia, S., Sotta, P., and Long, D. (2010). Unique plastic and recovery behavior of nanofilled923
elastomers and thermoplastic elastomers (Payne and Mullins effects). Journal of Polymer924
Science, Part B: Polymer Physics, 48(13):1495–1508.925
Mezzenga, R., Schurtenberger, P., Burbidge, A. S., and Michel, M. (2005). Understanding926
foods as soft materials. Nature Materials, 4(10):729–740.927
Min Kim, J., Eberle, A. P. R., Kate Gurnon, A., Porcar, L., and Wagner, N. J. (2014). The928
microstructure and rheology of a model, thixotropic nanoparticle gel under steady shear929
and large amplitude oscillatory shear (laos). Journal of Rheology, 58(5):1301–1328.930
Ng, T. S.-K. and McKinley, G. H. (2008). Power law gels at finite strains: The nonlinear931
rheology of gluten gels. Journal of Rheology, 52(2):417–449.932
Ng, T. S.-K., McKinley, G. H., and Ewoldt, R. H. (2011). Large amplitude oscillatory shear933
flow of gluten dough: A model power-law gel. Journal of Rheology, 55(3):627–654.934
Norton, I. T., Fryer, P., and Moore, S. (2006). Product/process integration in food manufac-935
ture: Engineering sustained health. AIChE Journal, 52(5):1632–1640.936
O’Mahony, J. A., McSweeney, P. L. H., and Lucey, J. A. (2006). A model system for studying937
the effects of colloidal calcium phosphate concentration on the rheological properties of938
cheddar cheese. Journal of Dairy Science, 89(3):892–904.939
Pal, R. (2008). A new linear viscoelastic model for emulsions and suspensions. Polymer940
Engineering and Science, 48(7):1250–1253.941
Palierne, J. (1990). Linear rheology of viscoelastic emulsions with interfacial tension. Rheo-942
logica Acta, 29(3):204–214.943
Palierne, J. (1991). Erratum. Rheologica Acta, 30(5):497.944
Ptaszek, P., Kabzinski, M., Ptaszek, A., Kaczmarczyk, K., Kruk, J., and Bienczak, A. (2016).945
The analysis of the influence of xanthan gum and apple pectins on egg white protein foams946
using the large amplitude oscillatory shear method. Food Hydrocolloids, 54:293–301.947
Reiner, M. and Scott Blair, G. W. (1967). Rheological terminology. In Eirich, F. R., editor,948
30
Rheology - Theory and Application, volume 4, pages 461–488. Academic Press, New York.949
Renard, D., van de Velde, F., and Visschers, R. W. (2006). The gap between food gel structure,950
texture and perception. Food Hydrocolloids, 20(4):423–431.951
Rogers, N., Drake, M., Daubert, C., McMahon, D., Bletsch, T., and Foegeding, E. (2009).952
The effect of aging on low-fat, reduced-fat, and full-fat cheddar cheese texture. J.Dairy953
Sci., 92(10):4756–4772.954
Rogers, S. A., Erwin, B. M., Vlassopoulos, D., and Cloitre, M. (2011a). Oscillatory yielding955
of a colloidal star glass. Journal of Rheology, 55(4):733–752.956
Rogers, S. A., Erwin, B. M., Vlassopoulos, D., and Cloitre, M. (2011b). A sequence of957
physical processes determined and quantified in LAOS: Application to a yield stress fluid.958
Journal of Rheology, 55(2):435–458.959
Sahin, S. and Sumnu, S. G. (2006). Physical Properties of Foods. Springer.960
Scott Blair, G. W. and Coppen, F. M. V. (1940). Subjective judgments of ‘firmness’ in elastic961
and viscous materials. Nature, 145(3672):425–426.962
Shah, S., Swartz, S. E., and Ouyang, C. (1995). Fracture mechanics of concrete: applications963
of fracture mechanics to concrete, rock and other quasi-brittle materials. John Wiley &964
Sons.965
Sherman, P. (1970). Industrial rheology with particular reference to foods, pharmaceuticals,966
and cosmetics. Academic Press, London.967
Smit, R., Brekelmans, W., and Meijer, H. (1999). Prediction of the large-strain mechanical968
response of heterogeneous polymer systems: Local and global deformation behaviour of969
a representative volume element of voided polycarbonate. Journal of the Mechanics and970
Physics of Solids, 47(2):201–221.971
Stokes, J. R. and Frith, W. J. (2008). Rheology of gelling and yielding soft matter systems.972
Soft Matter, 4(6):1133–1140.973
Sun, W.-X., Huang, L.-Z., Yang, Y.-R., Liu, X.-X., and Tong, Z. (2014). Large amplitude974
oscillatory shear studies on the strain-stiffening behavior of gelatin gels. Chinese Journal975
of Polymer Science, 33(1):70–83.976
Tariq, S., Giacomin, A. c., and Gunasekaran, S. (1998). Nonlinear viscoelasticity of cheese.977
Biorheology, 35(3):171–191.978
Tunick, M. and Van Hekken, D. (2002). Torsion gelometry of cheese. J.Dairy Sci.,979
85(11):2743–2749.980
Van den Berg, L., Carolas, A., van Vliet, T., Van Der Linden, E., van Boekel, M., and981
van de Velde, F. (2008). Energy storage controls crumbly perception in whey pro-982
teins/polysaccharide mixed gels. Food Hydrocolloids, 22(7):1404–1417.983
31

Van der Sman, R. G. M. and Van der Goot, A. J. (2009). The science of food structuring. Soft984
Matter, 5(3):501–510.985
Van der Vaart, K., Depypere, F., Graef, V. D., Schall, P., Fall, A., Bonn, D., and Dewettinck, K.986
(2013). Dark chocolate’s compositional effects revealed by oscillatory rheology. European987
Food Research and Technology, 236(6):931–942.988
Van Vliet, T., van Dijk, H. J. M., Zoon, P., and Walstra, P. (1991). Relation between syneresis989
and rheological properties of particle gels. Colloid & Polymer Science, 269(6):620–627.990
Van Vliet, T. and Walstra, P. (1994). Water in casein gels; how to get it out or keep it in.991
Journal of Food Engineering, 22(1-4):75–88.992
Visser, F. M. W. (1977). Contribution of enzymes from rennet, starter bacteria and milk to993
proteolysis and flavour development in gouda cheese. 3. protein breakdown: Analysis of the994
soluble nitrogen and amino acid nitrogen fractions. Netherlands Milk and Dairy Journal,995
31:210–239.996
Wu, S. (1985). Phase structure and adhesion in polymer blends: A criterion for rubber tough-997
ening. Polymer, 26(12):1855–1863.998
Yang, X., Rogers, N. R., Berry, T. K., and Foegeding, E. A. (2011). Modeling the rheological999
properties of cheddar cheese with different fat contents at various temperatures. Journal of1000
Texture Studies, 42(5):331–348.1001
Yates, M. D. and Drake, M. A. (2007). Texture properties of Gouda cheese. Journal of Sensory1002
Studies, 22(5):493–506.1003
32

List of Figures1004
1 (a) Semi-hard cheese belongs to the material class of soft solids. It is pre-1005
dominantly solid at rest and shows a transition to a fluid when manipulated1006
or masticated. ‘Firmness’, ‘rubberiness’ and ‘smoothness’ are the typical tex-1007
tural terms used to assess the solidity and (lack of) fluidity of the cheese by1008
hand or in-mouth. (b) In previous work (Faber et al., 2016a,b), we have de-1009
fined linear viscoelastic rheological measures quantifying firmness and rub-1010
beriness that can be determined from creep / recovery experiments in shear.1011
Firmness is a linear viscoelastic property, whereas rubberiness is a measure of1012
the non-linear elastoviscoplasticity of the material. (c) For the simultaneous1013
measurement of firmness and rubberiness in one test run, the Large Amplitude1014
Oscillatory Shear protocol is more suitable then the creep / recovery experi-1015
ment. Experiments may be performed with either a sinusoidal strain input (of1016
amplitude γ0) or a stress input (of amplitude σ0 ). . . . . . . . . . . . . . . 361017
2 Stress-controlled texture measurement of zero-fat (blue) and full-fat (red) soft-1018
solid gel. The microstructure of full-fat cheese can be characterized as emulsion-1019
filled gel. CSLM images of (a) zero-fat cheese and (b) full-fat cheese. (c)1020
Creep / recovery curves of zero-fat (blue) and full-fat cheese (red) at a stress1021
amplitude σ0 = 1000 Pa and two temperatures of T = 10 ◦C (filled squares)1022
and T = 25 ◦C (hollow squares). Firmness is defined as the inverse of the1023
maximum compliance F ≡ 1/J(t f ) (circles) at t f = 100 s. Rubberiness is de-1024
fined as the extent to which the material recovers from the strain at the end of1025
the experiment R ≡ 1 − J(tr)/J(t f ) at tr = 200 s. (triangles on the right-hand1026
ordinate axis). . . . . . . . . . . . . . . . . . . . . . . . . . . . . . . . . . . 371027
3 (a) Strain-sweep of the first-harmonic complex shear modulus G∗1(ω, γ0) mea-1028
sured using LAOStrain, of samples from the same zero-fat cheese (blue) and1029
full-fat cheese (red) as in Fig. 2(c), and measured at the same temperatures of1030
T = 10 ◦C (filled symbols) and T = 25 ◦C (open symbols) at ω = 5 rad s−1.1031
The magnitudes of the firmness F of the samples are equal to the plateau1032
values of the magnitude of the first-harmonic complex shear moduli and are1033
plotted as circles on the ordinate axis. The rubberiness R is defined as the1034
magnitude of the yield strain amplitude R ≡ γ0,y and plotted as triangles on the1035
abscissa. (b,c) The LAOStrain and LAOStress experiments measure the same1036
ratios of maxima in the stress and maxima in strain, defined by σmax/γ0 and1037
σ0/γmax respectively. However the LAOStrain measurements more readily1038
allow probing the material response deeper into the fluid regime. The roman1039
numerals along the curves in (b) and (c) correspond to the specific LAOStrain1040
cycles examined in more detail in Fig. 6. . . . . . . . . . . . . . . . . . . . . 381041
33
4 (a,b) Measurements (blue line) and model prediction (circles) of the oscilla-1042
tory stress response of zero fat cheese subjected to LAOStrain loading. Our1043
model is based on a fractional constitutive framework, with only two mate-1044
rial properties: a fractional exponent of β = 0.19, quantifying the frequency1045
dependency of the response and a ‘quasi-property’ G= 1.4 ×10⁴ Pa sβ, which1046
quantifies the scale of the stress in the material. Our model correctly predicts1047
the shape of the ellipse as a function of the strain amplitude γ0 and frequency1048
ω. (c) In the non-linear regime, the Bowditch-Lissajous curve becomes in-1049
creasingly ‘banana-shaped’ (solid blue line) and the elastic stress contribution1050
(solid red line) becomes curved, a characteristic typical for damaged elas-1051
tomers. The linear viscoelastic model (dashed line, hollow symbols) cannot1052
not predict this curvature and over predicts both the maximum of the elastic1053
stress (squares) and viscous stress (circles). (d) Same data as in (c), plotted1054
from a ‘viscous’ perspective. . . . . . . . . . . . . . . . . . . . . . . . . . . 391055
5 (a,b) Evolution of the intra-cycle maxima of the elastic stress σ′max(γ0) (hol-1056
low squares) and viscous stress σ′′max(γ0) (hollow circles) as a function of the1057
strain amplitude γ0 for zero-fat (blue) and full-fat (red) cheese measured at1058
T = 25 ◦C and a frequency ω = 5 rad s−1. The continuous and dashed line rep-1059
resent the predictions of the linear viscoelastic constitutive model. Both zero-1060
fat and full-fat cheese display an inter-cycle maximum of the elastic stress σ′f1061
(indicated by the numeral II) at a failure strain amplitude γ f ≈ 0.7. We define1062
this inter-cycle maximum as the failure criterion for the food gel. The full-fat1063
cheese curve (b) displays a broad plateau in the maximum elastic stress σ′max1064
and a small decrease beyond the failure point. By contrast, the zero-fat cheese1065
shown in (a), displays a more clearly pronounced peak in the σ′max curve. (c)1066
Magnitude of the elastic stress of zero-fat cheese, at a frequency of ω = 51067
rad s−1(hollow) and ω = 0.2 rad s−1(filled). The magnitude of σ′max(γ0) is1068
normalized by the factor ωβ cos (πβ/2). . . . . . . . . . . . . . . . . . . . . . 401069
6 The solid-fluid transition of zero-fat (blue) and full-fat (red) cheese at T =1070
25 ◦C and ω = 5 rad s−1 depicted using the Lissajous representation. (a,b).1071
The continuous lines represent the intra-cycle evolution of the elastic stress1072
σ′. The hollow squares are the intra-cycle maxima σ′max of the elastic stress1073
as a function of strain amplitude γ0. The dashed lines indicate the tangent1074
modulus G′K to the curve of the elastic stress at γ = γ0 and provide a measure1075
of the loss of strength of the elastic network. (c,d) Lissajous curves of the1076
total stress response at three strain amplitudes γ0 = 0.2, 0.6, 1.0. The hollow1077
circles show the intra-cycle maxima in the viscous stress σ′′max. The dashed1078
line through these points are the tangent modulus G′M at maximum strain rate1079
γ = γ0. The slope of these tangents represent the resistance of the material1080
to plastic flow. (e,f) Lissajous plots of cycle II from the viscous perspective1081
(blue and red curves) with the viscous stress σ′′(ω) plotted as black contin-1082
uous lines. The dashed lines represent the minimum and maximum strain1083
rate dynamic viscosity η′M and η′K respectively. (f) Full-fat cheese displays a1084
more pronounced (fifth-order) non-linearity. Truncating the description of η′K1085
at third-order over-predicts its magnitude as shown by the dot-dashed line. . . 411086
34

7 Strain sweeps showing the evolution in (a) the Fluidizing ratio Φ, and (b) the1087
Thickening ratio Θ, of zero-fat cheese (blue) and full-fat cheese (red) mea-1088
sured at a temperature T = 25 ◦C and ω = 5 rad s−1. (a) Both cheese formula-1089
tions show comparable ultimate magnitudes of the Fluidizing ratio, however1090
the rise of Φ of full-fat cheese is more gradual and sets in at lower strains. (b)1091
The non-Newtonian fluid properties of full-fat and zero-fat cheese are char-1092
acterized by the evolution of the Thickening ratio, which reveals three flow-1093
regimes A, B and C. Zero-fat cheese displays continuous inter-cycle thinning,1094
whereas full-fat cheese shows some initial thinning, followed by thickening1095
and thinning. Beyond cycle II the sample of full-fat cheese is no longer ho-1096
mogeneous, indicated with a dotted line in (a) and (b)). The strain(-rate)1097
amplitudes at which mild slip is observed are indicated using filled symbols. . 421098
8 Evolution in the Fluidizing ratio Φ (a,c) and Thickening ratio Θ (b,d) of1099
cheese varying with temperature (a,b) and degree of hydration (c,d). Three1100
different cheeses are depicted: 0 v/v% (blue), 12v/v% (green), 30v/v%(red).1101
For comparison, the measurements from Fig. 7 are replotted using shaded1102
and hollow symbols. (a,b) Temperature decrease from T = 25◦C (hollow)1103
to T = 10◦C (filled). (a) Both a temperature reduction and increase of fat1104
content increase the rate of fluidization with increasing strain. (b) Tempera-1105
ture reduction changes the response of zero-fat cheese from shear thinning to1106
weakly shear thickening, and closer to that of full-fat cheese. (c) Increasing1107
the water / protein ratio from w/p= 1.8 (hollow) to w/p= 2.4 (filled) does not1108
have a significant effect on the rate of fluidization in regime A. (d) However1109
it changes the fluid characteristics of full-fat cheese from shear thickening to1110
shear thinning. . . . . . . . . . . . . . . . . . . . . . . . . . . . . . . . . . . 431111
A.9 Values for the first-harmonic creep compliance J∗1(ω,σ0) in a stress-sweep1112
of samples of the same test material as used for Fig. 2(c). The firmness is1113
defined as the inverse of the magnitude of the complex creep compliance1114
F ≡ 1/|J∗(ω)| , and are plotted as circles. In a LAOStress measurement1115
the appropriate measure of rubberiness is the amplitude of the yield stress1116
R ≡ σ0,y, and is indicated here for each material by the triangles. The gra-1117
dient of the shaded area to the left denotes schematically the transition from1118
firm to soft, which we define as ‘softening’. The white arrow indicates a1119
temperature-induced softening. The gradient of the shaded area at the bottom1120
indicates schematically the transition from rubbery to moldable, which we de-1121
fine as ‘plasticizing’. The dashed arrow indicates a stress-induced transition1122
from solid to fluid-like behaviour, which we denote as ‘fluidizing’. . . . . . . 481123
35

At rest, t<0
Shear stress suddenly removed
Constant shear stress applied
(b) Creep Recovery (a) Human senses
σt = σ0
σ = 0
Creep, 0 < t < tcreep
Recovery, tcreep < t < trecover
γ = 0
γt= xt / y0
γt = (xtcreep-xt) / y0
σt = 0x
x
y0
y0
y0
x0
Touch - handsSight - eyes
Touch - mouth
At rest, t<0
Oscillatory shear stress applied
Oscillatory shear strain applied
(c) LAOS
σ = 0
LAOStrain
LAOStress
γ = 0
σ(t) = σ0 cos ωt
y0
x0
γ(t,σ0,ω)
Oscillatory shear strain rate applied
γ(t) = γ0 sin ωt, σ(t,γ0,ω)
FirmnessRubberinessSmoothness
Figure 1: (a) Semi-hard cheese belongs to the material class of soft solids. It is predominantly solid at rest and showsa transition to a fluid when manipulated or masticated. ‘Firmness’, ‘rubberiness’ and ‘smoothness’ are the typicaltextural terms used to assess the solidity and (lack of) fluidity of the cheese by hand or in-mouth. (b) In previous work(Faber et al., 2016a,b), we have defined linear viscoelastic rheological measures quantifying firmness and rubberinessthat can be determined from creep / recovery experiments in shear. Firmness is a linear viscoelastic property, whereasrubberiness is a measure of the non-linear elastoviscoplasticity of the material. (c) For the simultaneous measurementof firmness and rubberiness in one test run, the Large Amplitude Oscillatory Shear protocol is more suitable then thecreep / recovery experiment. Experiments may be performed with either a sinusoidal strain input (of amplitude γ0)or a stress input (of amplitude σ0 ).
36

50 μm
(a) zero-fat cheese
(b) full-fat cheese0 50 100 150 200
0
0.5
1
1.5
2
2.5
3
3.5x 10
−4
time , t [s]
com
plia
nce,
J(t
) [1
/Pa]
rubb
erin
ess,
R [-
]
1
0
(c) LAOStrain, ω = 5 rad s−1
Figure 2: Stress-controlled texture measurement of zero-fat (blue) and full-fat (red) soft-solid gel. The microstructureof full-fat cheese can be characterized as emulsion-filled gel. CSLM images of (a) zero-fat cheese and (b) full-fatcheese. (c) Creep / recovery curves of zero-fat (blue) and full-fat cheese (red) at a stress amplitude σ0 = 1000 Pa andtwo temperatures of T = 10 ◦C (filled squares) and T = 25 ◦C (hollow squares). Firmness is defined as the inverseof the maximum compliance F ≡ 1/J(t f ) (circles) at t f = 100 s. Rubberiness is defined as the extent to which thematerial recovers from the strain at the end of the experiment R ≡ 1 − J(tr)/J(t f ) at tr = 200 s. (triangles on theright-hand ordinate axis).
37

10−2
100
103
104
105
106
strain amplitude, γ0 [−]fir
st−
harm
onic
com
plex
mod
ulus
, G* 1 [P
a]
‘Soft’
‘Solid’
‘Fluid’
‘Firm’
‘Rubbery’‘Moldable’
(a) LAOStrain, ω= 5 rad s−1
10−1 100103
104
maximum strain, γ0, γm [−]
max
imum
str
ess,
σm, σ
0 [Pa]
LAOStress
LAOStrain
II
IIII
(b) Zero fat
10−1 100103
104
maximum strain, γ0, γm [−]
max
imum
str
ess,
σm, σ
0 [Pa]
LAOStress
LAOStrain
II IIII
(c) Full fat
Figure 3: (a) Strain-sweep of the first-harmonic complex shear modulus G∗1(ω, γ0) measured using LAOStrain, ofsamples from the same zero-fat cheese (blue) and full-fat cheese (red) as in Fig. 2(c), and measured at the sametemperatures of T = 10 ◦C (filled symbols) and T = 25 ◦C (open symbols) at ω = 5 rad s−1. The magnitudes ofthe firmness F of the samples are equal to the plateau values of the magnitude of the first-harmonic complex shearmoduli and are plotted as circles on the ordinate axis. The rubberiness R is defined as the magnitude of the yieldstrain amplitude R ≡ γ0,y and plotted as triangles on the abscissa. (b,c) The LAOStrain and LAOStress experimentsmeasure the same ratios of maxima in the stress and maxima in strain, defined by σmax/γ0 and σ0/γmax respectively.However the LAOStrain measurements more readily allow probing the material response deeper into the fluid regime.The roman numerals along the curves in (b) and (c) correspond to the specific LAOStrain cycles examined in moredetail in Fig. 6.
38
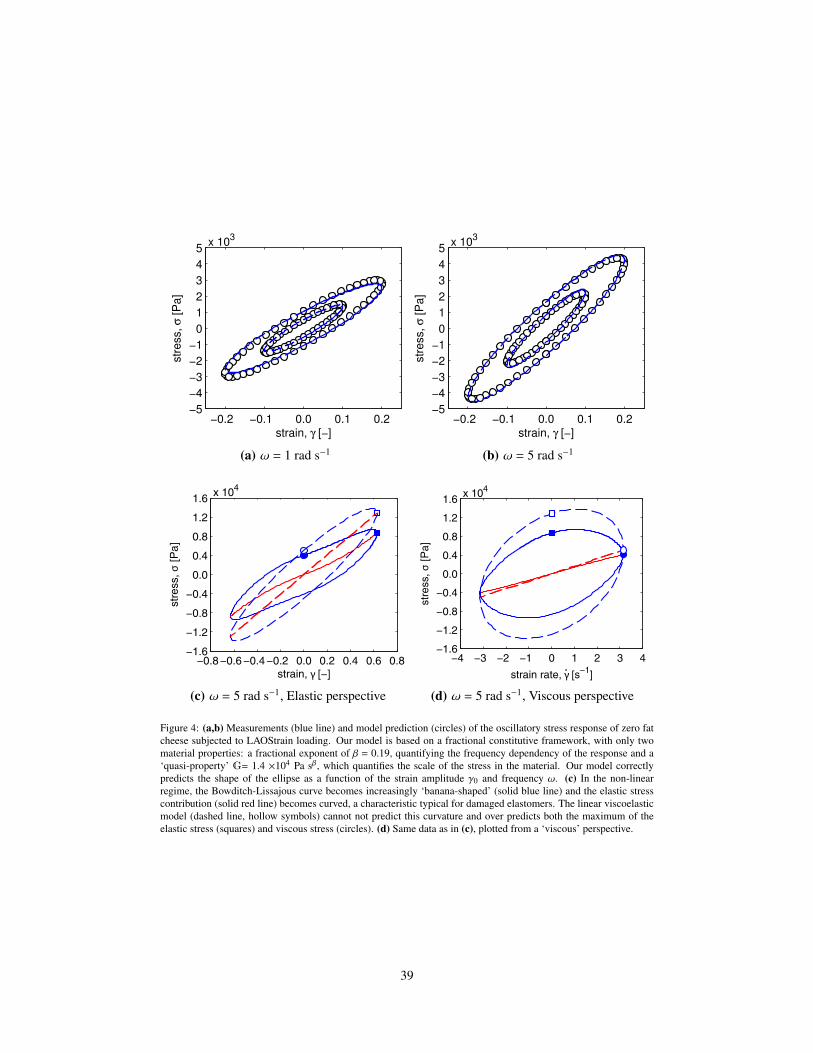
−0.2 −0.1 0.0 0.1 0.2−5
−4
−3
−2
−1
0
1
2
3
4
5
strain, γ [−]
str
ess,
σ [P
a]
x 103
(a) ω = 1 rad s−1
−0.2 −0.1 0.0 0.1 0.2−5
−4
−3
−2
−1
0
1
2
3
4
5
strain, γ [−]
str
ess,
σ [P
a]
x 103
(b) ω = 5 rad s−1
−0.8−0.6 −0.4 −0.2 0.0 0.2 0.4 0.6 0.8−1.6
−1.2
−0.8
−0.4
0.0
0.4
0.8
1.2
1.6
strain, γ [−]
stre
ss, σ
[Pa]
x 104
(c) ω = 5 rad s−1, Elastic perspective
−4 −3 −2 −1 0 1 2 3 4−1.6
−1.2
−0.8
−0.4
0.0
0.4
0.8
1.2
1.6
strain rate, γ [s−1]
stre
ss, σ
[Pa]
x 104
.
(d) ω = 5 rad s−1, Viscous perspective
Figure 4: (a,b) Measurements (blue line) and model prediction (circles) of the oscillatory stress response of zero fatcheese subjected to LAOStrain loading. Our model is based on a fractional constitutive framework, with only twomaterial properties: a fractional exponent of β = 0.19, quantifying the frequency dependency of the response and a‘quasi-property’ G= 1.4 ×10⁴ Pa sβ, which quantifies the scale of the stress in the material. Our model correctlypredicts the shape of the ellipse as a function of the strain amplitude γ0 and frequency ω. (c) In the non-linearregime, the Bowditch-Lissajous curve becomes increasingly ‘banana-shaped’ (solid blue line) and the elastic stresscontribution (solid red line) becomes curved, a characteristic typical for damaged elastomers. The linear viscoelasticmodel (dashed line, hollow symbols) cannot not predict this curvature and over predicts both the maximum of theelastic stress (squares) and viscous stress (circles). (d) Same data as in (c), plotted from a ‘viscous’ perspective.
39
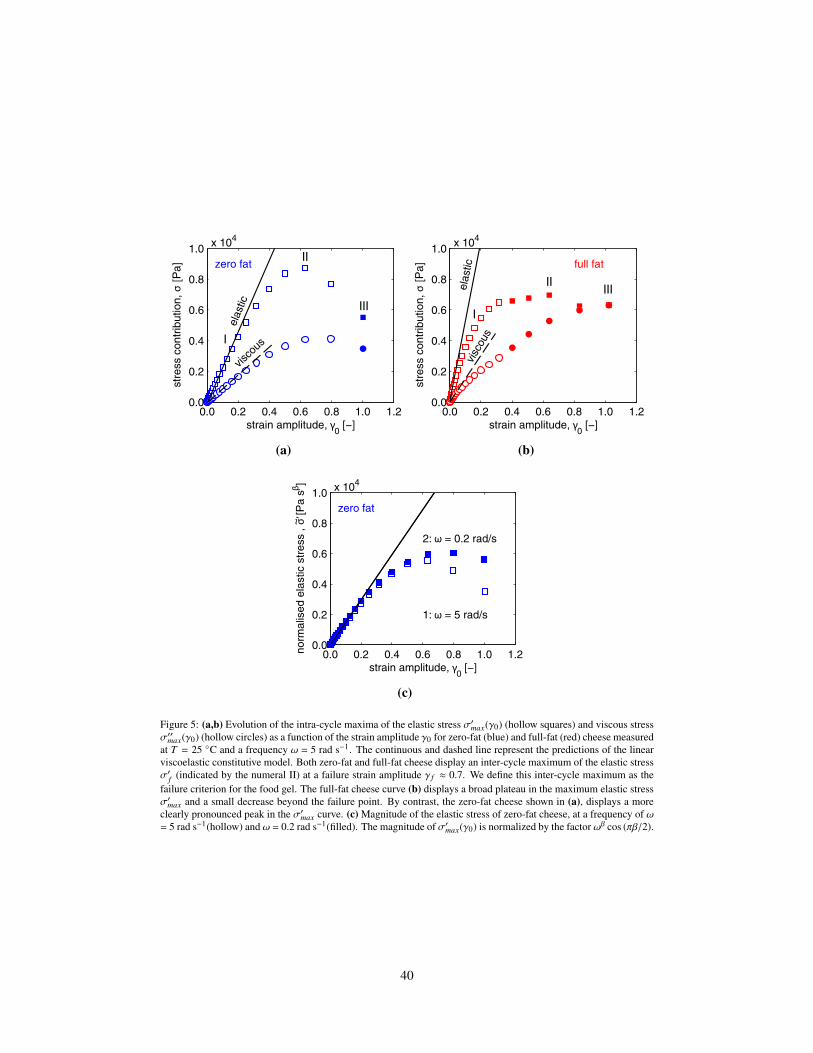
0.0 0.2 0.4 0.6 0.8 1.0 1.20.0
0.2
0.4
0.6
0.8
1.0
strain amplitude, γ0 [−]
stre
ss c
ontr
ibut
ion,
σ [P
a] zero fat
visco
us
elas
ticx 104
II
III
I
(a)
0.0 0.2 0.4 0.6 0.8 1.0 1.20.0
0.2
0.4
0.6
0.8
1.0
strain amplitude, γ0 [−]
stre
ss c
ontr
ibut
ion,
σ [P
a] full fat
visc
ous
elas
tic
x 104
II III
I
(b)
0.0 0.2 0.4 0.6 0.8 1.0 1.20.0
0.2
0.4
0.6
0.8
1.0
strain amplitude, γ0 [−]
norm
alis
ed e
last
ic s
tres
s , σ
’ [P
a sβ
]
zero fat
2: ω = 0.2 rad/s
1: ω = 5 rad/s
x 104
~
(c)
Figure 5: (a,b) Evolution of the intra-cycle maxima of the elastic stress σ′max(γ0) (hollow squares) and viscous stressσ′′max(γ0) (hollow circles) as a function of the strain amplitude γ0 for zero-fat (blue) and full-fat (red) cheese measuredat T = 25 ◦C and a frequency ω = 5 rad s−1. The continuous and dashed line represent the predictions of the linearviscoelastic constitutive model. Both zero-fat and full-fat cheese display an inter-cycle maximum of the elastic stressσ′f (indicated by the numeral II) at a failure strain amplitude γ f ≈ 0.7. We define this inter-cycle maximum as thefailure criterion for the food gel. The full-fat cheese curve (b) displays a broad plateau in the maximum elastic stressσ′max and a small decrease beyond the failure point. By contrast, the zero-fat cheese shown in (a), displays a moreclearly pronounced peak in the σ′max curve. (c) Magnitude of the elastic stress of zero-fat cheese, at a frequency of ω= 5 rad s−1(hollow) and ω = 0.2 rad s−1(filled). The magnitude of σ′max(γ0) is normalized by the factor ωβ cos (πβ/2).
40
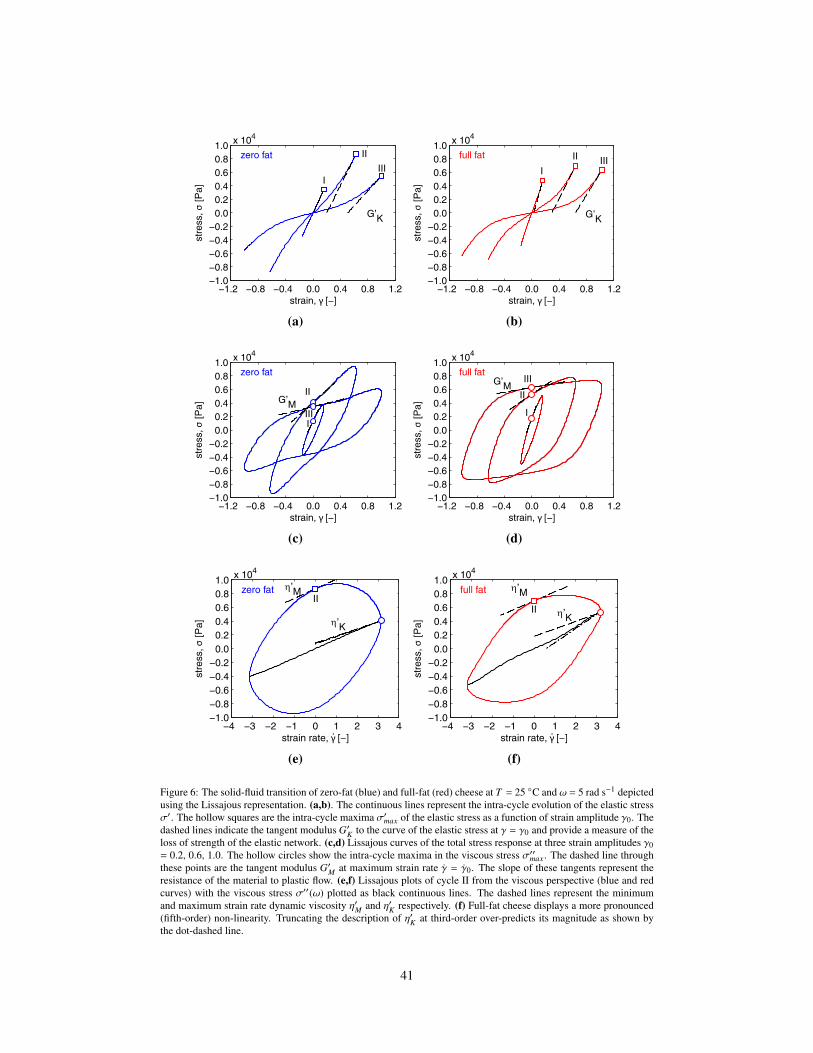
−1.2 −0.8 −0.4 0.0 0.4 0.8 1.2−1.0−0.8−0.6−0.4−0.2
0.00.20.40.60.81.0
strain, γ [−]
stre
ss, σ
[Pa]
x 104
zero fat
G’K
II
IIII
(a)
−1.2 −0.8 −0.4 0.0 0.4 0.8 1.2−1.0−0.8−0.6−0.4−0.2
0.00.20.40.60.81.0
strain, γ [−]
stre
ss, σ
[Pa]
x 104
full fat
G’K
II
IIII
(b)
−1.2 −0.8 −0.4 0.0 0.4 0.8 1.2−1.0−0.8−0.6−0.4−0.2
0.00.20.40.60.81.0
strain, γ [−]
stre
ss, σ
[Pa]
x 104
zero fat
II
IIII
G’M
(c)
−1.2 −0.8 −0.4 0.0 0.4 0.8 1.2−1.0−0.8−0.6−0.4−0.2
0.00.20.40.60.81.0
strain, γ [−]
stre
ss, σ
[Pa]
x 104
full fat
II
I
IIIG’M
(d)
−4 −3 −2 −1 0 1 2 3 4−1.0−0.8−0.6−0.4−0.2
0.00.20.40.60.81.0
strain rate, γ [−]
stre
ss, σ
[Pa]
x 104
zero fatII
η’K
η’M
.
(e)
−4 −3 −2 −1 0 1 2 3 4−1.0−0.8−0.6−0.4−0.2
0.00.20.40.60.81.0
strain rate, γ [−]
stre
ss, σ
[Pa]
x 104
full fat
II η’K
η’M
.
(f)
Figure 6: The solid-fluid transition of zero-fat (blue) and full-fat (red) cheese at T = 25 ◦C and ω = 5 rad s−1 depictedusing the Lissajous representation. (a,b). The continuous lines represent the intra-cycle evolution of the elastic stressσ′. The hollow squares are the intra-cycle maxima σ′max of the elastic stress as a function of strain amplitude γ0. Thedashed lines indicate the tangent modulus G′K to the curve of the elastic stress at γ = γ0 and provide a measure of theloss of strength of the elastic network. (c,d) Lissajous curves of the total stress response at three strain amplitudes γ0= 0.2, 0.6, 1.0. The hollow circles show the intra-cycle maxima in the viscous stress σ′′max. The dashed line throughthese points are the tangent modulus G′M at maximum strain rate γ = γ0. The slope of these tangents represent theresistance of the material to plastic flow. (e,f) Lissajous plots of cycle II from the viscous perspective (blue and redcurves) with the viscous stress σ′′(ω) plotted as black continuous lines. The dashed lines represent the minimumand maximum strain rate dynamic viscosity η′M and η′K respectively. (f) Full-fat cheese displays a more pronounced(fifth-order) non-linearity. Truncating the description of η′K at third-order over-predicts its magnitude as shown bythe dot-dashed line.
41

10−2
10−1
100
−0.2
0
0.2
0.4
0.6
0.8
1
strain amplitude, γ0 [−]
Flu
idiz
ing
ratio
, Φ [−
]
II
I
III
A B C
zero fatfull fat
(a) Fluidizing ratio, Φ ≡ (G′K −G′M)/G′K
10−1
100
101
−1.2
−1
−0.8
−0.6
−0.4
−0.2
0
0.2
0.4
strain rate amplitude, γ0 [s−1]
Thi
cken
ing
ratio
, Θ [−
]
A B C
III
III
.
(b) Thickening ratio, Θ ≡ (η′K − η′M)/η′K
Figure 7: Strain sweeps showing the evolution in (a) the Fluidizing ratio Φ, and (b) the Thickening ratio Θ, of zero-fat cheese (blue) and full-fat cheese (red) measured at a temperature T = 25 ◦C and ω = 5 rad s−1. (a) Both cheeseformulations show comparable ultimate magnitudes of the Fluidizing ratio, however the rise of Φ of full-fat cheese ismore gradual and sets in at lower strains. (b) The non-Newtonian fluid properties of full-fat and zero-fat cheese arecharacterized by the evolution of the Thickening ratio, which reveals three flow-regimes A, B and C. Zero-fat cheesedisplays continuous inter-cycle thinning, whereas full-fat cheese shows some initial thinning, followed by thickeningand thinning. Beyond cycle II the sample of full-fat cheese is no longer homogeneous, indicated with a dotted line in(a) and (b)). The strain(-rate) amplitudes at which mild slip is observed are indicated using filled symbols.
42

10−2
10−1
100
−0.2
0
0.2
0.4
0.6
0.8
1
strain amplitude, γ0 [−]
Flu
idiz
ing
ratio
, Φ [−
]
A
B
zero fatlow fatfull fat
(a) Temperature effect
10−1
100
101
−1
−0.8
−0.6
−0.4
−0.2
0
0.2
0.4
0.6
strain rate amplitude, γ0 [s−1]
Thi
cken
ing
ratio
, Θ [−
].
(b) Temperature effect
10−2
10−1
100
−0.2
0
0.2
0.4
0.6
0.8
1
strain amplitude, γ0 [−]
Flu
idiz
ing r
atio,
Φ [−
]
(c) Hydration effect
10−1
100
101
−1
−0.8
−0.6
−0.4
−0.2
0
0.2
0.4
0.6
strain rate amplitude, γ0 [s−1]
Thi
cken
ing
ratio
, Θ [−
]
.
(d) Hydration effect
Figure 8: Evolution in the Fluidizing ratio Φ (a,c) and Thickening ratio Θ (b,d) of cheese varying with temper-ature (a,b) and degree of hydration (c,d). Three different cheeses are depicted: 0 v/v% (blue), 12v/v% (green),30v/v%(red). For comparison, the measurements from Fig. 7 are replotted using shaded and hollow symbols. (a,b)Temperature decrease from T = 25◦C (hollow) to T = 10◦C (filled). (a) Both a temperature reduction and increaseof fat content increase the rate of fluidization with increasing strain. (b) Temperature reduction changes the responseof zero-fat cheese from shear thinning to weakly shear thickening, and closer to that of full-fat cheese. (c) Increasingthe water / protein ratio from w/p= 1.8 (hollow) to w/p= 2.4 (filled) does not have a significant effect on the rate offluidization in regime A. (d) However it changes the fluid characteristics of full-fat cheese from shear thickening toshear thinning.
43
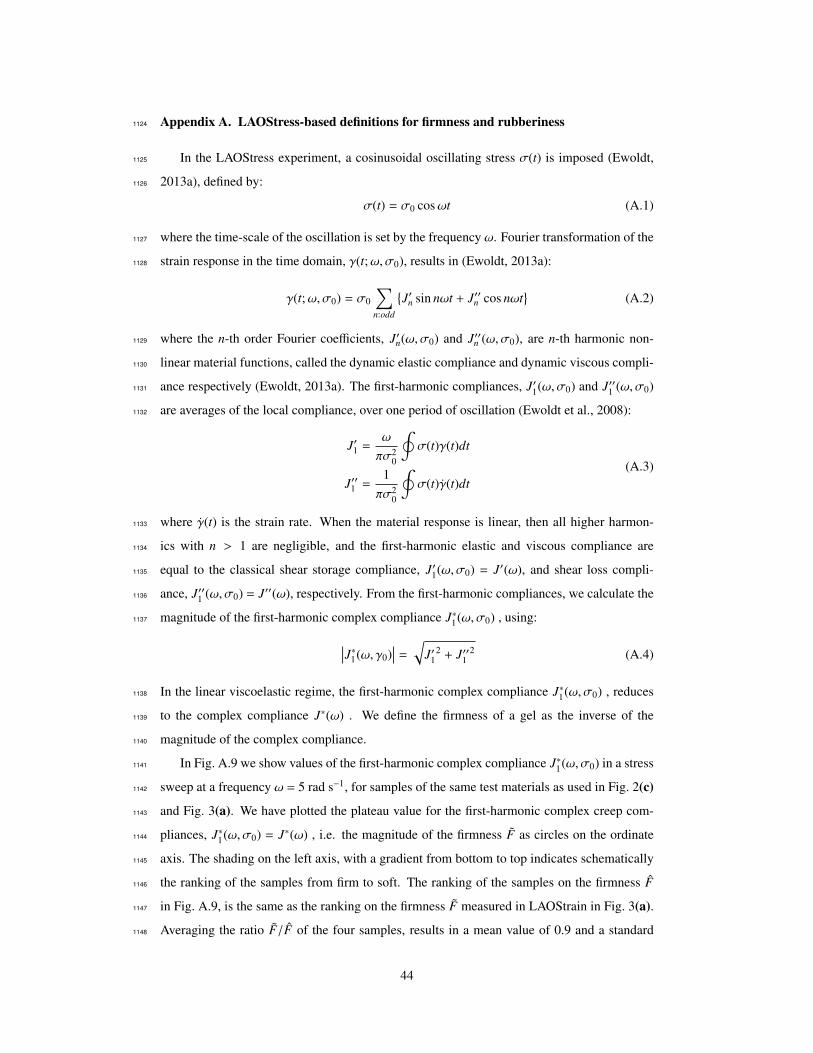
Appendix A. LAOStress-based definitions for firmness and rubberiness1124
In the LAOStress experiment, a cosinusoidal oscillating stress σ(t) is imposed (Ewoldt,1125
2013a), defined by:1126
σ(t) = σ0 cosωt (A.1)
where the time-scale of the oscillation is set by the frequency ω. Fourier transformation of the1127
strain response in the time domain, γ(t;ω,σ0), results in (Ewoldt, 2013a):1128
γ(t;ω,σ0) = σ0
∑n:odd
{J′n sin nωt + J′′n cos nωt
}(A.2)
where the n-th order Fourier coefficients, J′n(ω,σ0) and J′′n (ω,σ0), are n-th harmonic non-1129
linear material functions, called the dynamic elastic compliance and dynamic viscous compli-1130
ance respectively (Ewoldt, 2013a). The first-harmonic compliances, J′1(ω,σ0) and J′′1 (ω,σ0)1131
are averages of the local compliance, over one period of oscillation (Ewoldt et al., 2008):1132
J′1 =ω
πσ20
∮σ(t)γ(t)dt
J′′1 =1πσ2
0
∮σ(t)γ(t)dt
(A.3)
where γ(t) is the strain rate. When the material response is linear, then all higher harmon-1133
ics with n > 1 are negligible, and the first-harmonic elastic and viscous compliance are1134
equal to the classical shear storage compliance, J′1(ω,σ0) = J′(ω), and shear loss compli-1135
ance, J′′1 (ω,σ0) = J′′(ω), respectively. From the first-harmonic compliances, we calculate the1136
magnitude of the first-harmonic complex compliance J∗1(ω,σ0) , using:1137
∣∣∣J∗1(ω, γ0)∣∣∣ =
√J′1
2 + J′′12 (A.4)
In the linear viscoelastic regime, the first-harmonic complex compliance J∗1(ω,σ0) , reduces1138
to the complex compliance J∗(ω) . We define the firmness of a gel as the inverse of the1139
magnitude of the complex compliance.1140
In Fig. A.9 we show values of the first-harmonic complex compliance J∗1(ω,σ0) in a stress1141
sweep at a frequency ω = 5 rad s−1, for samples of the same test materials as used in Fig. 2(c)1142
and Fig. 3(a). We have plotted the plateau value for the first-harmonic complex creep com-1143
pliances, J∗1(ω,σ0) = J∗(ω) , i.e. the magnitude of the firmness F as circles on the ordinate1144
axis. The shading on the left axis, with a gradient from bottom to top indicates schematically1145
the ranking of the samples from firm to soft. The ranking of the samples on the firmness F1146
in Fig. A.9, is the same as the ranking on the firmness F measured in LAOStrain in Fig. 3(a).1147
Averaging the ratio F/F of the four samples, results in a mean value of 0.9 and a standard1148
44

deviation of 0.1, showing that the LAOStress and LAOStrain measure of firmness indeed are1149
interchangeable as predicted by Eq. (6).1150
To allow for the quantitative measurement of rubberiness in LAOStress, we need a mea-1151
sure for the resistance to yield obtained from the experiment. For the stress sweep of the1152
first-harmonic complex creep compliance J∗(ω,σ0) in Fig. A.9, there is no inflection point1153
from which we can derive an unambiguous definition of the yield point such as in Fig. 2(c).1154
Instead we use a generic criterion for transition from the linear viscoelastic, to the non-linear1155
elastoviscoplastic response, which is1156 ∣∣∣∣∣∣ |J∗1(ω,σ0)| − |J∗(ω)||J∗(ω)|
∣∣∣∣∣∣ > y (A.5)
where y is the arbitrarily chosen measure for non-linearity. In this paper we use y = 0.01. We1157
define the maximum of the range of stress amplitudes that satisfies this criterion as the yield1158
stress amplitude σ0,y, and define rubberiness as1159
R ≡ σ0,y (A.6)
which, like firmness, has units of Pa. Note that the dimensionality of R differs from the units1160
of rubberiness R measured in the creep recovery experiment and defined in Eq. (11), which are1161
dimensionless. In Fig. A.9 we have plotted the magnitude of the rubberiness R, as triangles1162
on the stress amplitude axis. This measure of rubberiness clearly discriminates full-fat cheese1163
from zero-fat cheese, irrespective of measurement temperature; the full-fat cheese (red) and1164
zero-fat (blue) at T = 10 ◦C(filled triangles), differ in rubberiness by over a factor of ten.1165
Since we use a very small value for y, the material response of the material is still almost1166
linear at the yield point, and the magnitude of the non-linear compliance is approximated1167
by the magnitude of the complex shear compliance, J∗(ω,σ0,y) ≈ J∗(ω), The magnitude of1168
the yield strain γy measured in LAOStress, is calculated from the yield stress amplitude σ0,y,1169
using1170
γy ≈σ0,y
|J∗(ω)|=
RF
(A.7)
Fig. 3(b) and (c) show that at the yield point the magnitude of the yield strain measured1171
in LAOStress is approximated by the magnitude of the yield strain amplitude measured in1172
LAOStrain, which is equal to the LAOStrain definition of the rubberiness1173
γy ≈ γy,0 = R (A.8)
Substituting Eq. (A.8) in Eq. (A.7)), gives:1174
R = R/F (A.9)
45

In words this relationships states that the magnitude of the material rubberiness R measured1175
using LAOStrain, is equal to the magnitude of the rubberiness R measured using LAOStress,1176
normalized by the firmness of the material. This is what we predict when we normalize the1177
magnitudes of the rubberiness R (triangles), to the corresponding magnitudes of the firmness1178
F (circles) from Fig. A.9 and compare these normalized values to the magnitude of the rub-1179
beriness measured in LAOStrain (triangles in Fig. 3(a)).1180
46

List of Figures1181
47
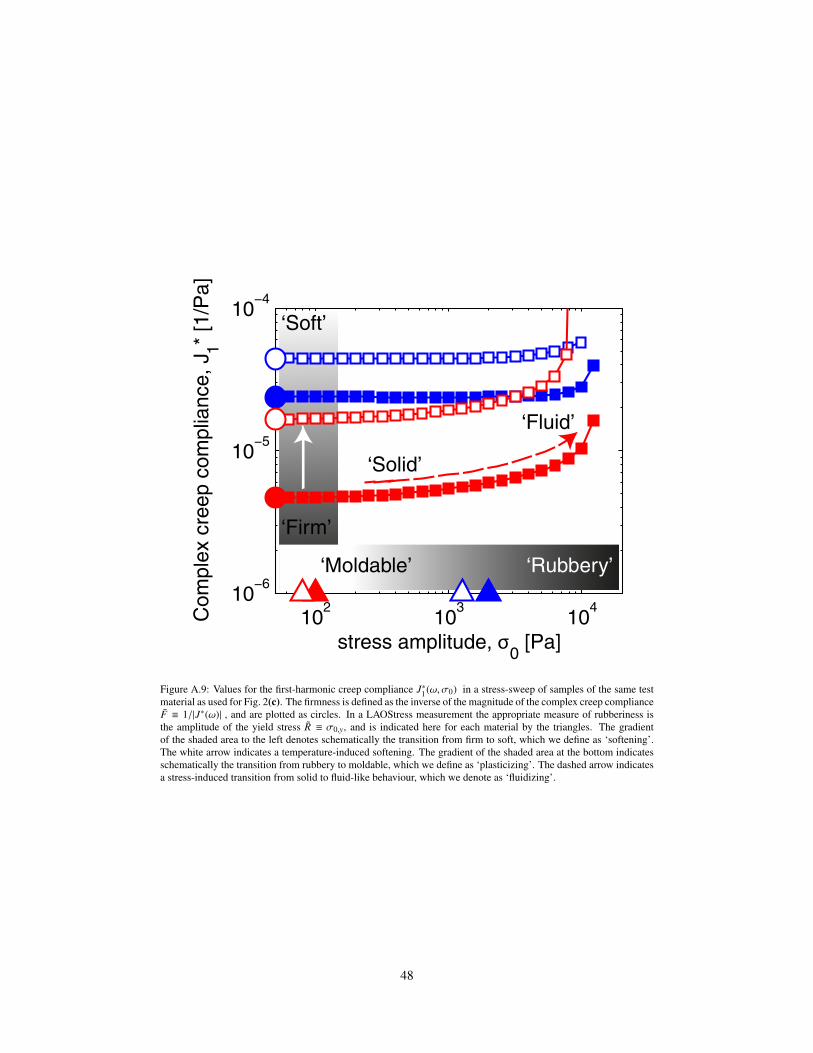
102
103
104
10−6
10−5
10−4
stress amplitude, σ0 [Pa]
Com
plex
cre
ep c
ompl
ianc
e, J
1* [1
/Pa]
‘Soft’
‘Rubbery’‘Moldable’
‘Solid’
‘Fluid’
‘Firm’
Figure A.9: Values for the first-harmonic creep compliance J∗1(ω,σ0) in a stress-sweep of samples of the same testmaterial as used for Fig. 2(c). The firmness is defined as the inverse of the magnitude of the complex creep complianceF ≡ 1/|J∗(ω)| , and are plotted as circles. In a LAOStress measurement the appropriate measure of rubberiness isthe amplitude of the yield stress R ≡ σ0,y, and is indicated here for each material by the triangles. The gradientof the shaded area to the left denotes schematically the transition from firm to soft, which we define as ‘softening’.The white arrow indicates a temperature-induced softening. The gradient of the shaded area at the bottom indicatesschematically the transition from rubbery to moldable, which we define as ‘plasticizing’. The dashed arrow indicatesa stress-induced transition from solid to fluid-like behaviour, which we denote as ‘fluidizing’.
48