1 executive summary - montgomery county, maryland in the full report, they would be higher if the...
TRANSCRIPT
7055 Samuel Morse Drive, Suite 100, Columbia, Maryland 21446
Tel (443) 741-3500 www.sabra-wang.com Fax (443) 741-3700
MEMORANDUM
To: Joana Conklin, Darcy Buckley, Montgomery County DOT
From: James A. Bunch, Senior Transportation Planner, SWAI
Subject: US 29 Bus Rapid Transit Improvements, Montgomery County MD, TIGER VIII Grant
Benefit Cost Analysis
Date: September 7, 2016
CC: Gary Erenrich, MCDOT, Paul Silberman: SWAI
1 Executive Summary
A benefit-cost analysis (BCA) was conducted for the US29 Bus Rapid Transit Improvements project for submission to the US DOT as a requirement of a discretionary grant application for the TIGER VIII program. The analysis was conducted in accordance with the benefit-cost methodology as recommended by the US DOT in the Federal Register (81 FR 9935)(18), and the 2016 Benefit-Cost Analysis Guidance for TIGER and Grant Applications (16) and the 2016 Tiger Benefit-Cost Analysis (BCA) 2016 TIGER and Fast Lane BCA Resource Guide (17). As recommended, the BCA was conducted for a period of more than 20 years starting when operations begin in 2020 and ending in 2040 (21 years). The BCA provides conservative estimates of both benefits and costs. Full life-cycle costs including replacement of assets at the end of their economic life, operations and maintenance of the system, and recovery of remaining useful life at the end of the analysis period were incorporated into the analysis. Sensitivity analyses using discount rates of 7% and 3% along with various assumptions on the methods and inputs for estimating the benefits measures (travel time savings, user cost savings, air quality, etc.) were also performed. This memorandum provides additional detail on the assumptions, methods, and results discussed in the main grant submittal. All calculations and assumptions can also be found the accompanying Excel Workbook: E_BCA-spreadsheet.xlsx.
Table 1 provides the Project Benefit Summary Matrix summarizing the existing conditions, changes, impacts, affected populations, results, and location in the Excel Workbook.
1.1 Summary of Results
Table 2 provides a summary of the Benefit Analysis results. As shown, the project enhances the mobility and travel options within the US 29 corridor resulting in net benefits over the 21-year analysis period of $1,106,324,787 in undiscounted 2015$, and Net Present Value (NPV) of $368,660,501 when a 7% discount rate is applied to future costs and benefits, or $695,251,648 when a 3% discount rate is applied.
The $66.57 million initial capital costs funded in part by the TIGER Grant increase to $195.53 million in undiscounted 2015$ ($65.45 million NPV at 7% discount and $99.65 million NPV at a 3% discount rate) over the 21-year life of the project primarily due to the replacement of the different components at the end of their economic life (vehicles at 12 years, bicycle stations and bikes at 10 years, passenger information displays at 5 years, and many other assets at 20 years). Note that the assets replaced at 20 years such as the Bus On Shoulder lane improvements are in service for only 1 year before the end of the analysis. All remaining value for these and other assets that have not reached the end of their economic value is subtracted in the Residual Capital Recovery calculations.

7055 Samuel Morse Drive, Suite 100, Columbia, Maryland 21446
Tel (443) 741-3500 www.sabra-wang.com Fax (443) 741-3700
Table 1 Project Benefit Summary Matrix
Current Status/Baseline & Problem to be
Addressed
In main narrative
$150,727,346 Safety NPV
Reduction in parallel service
provided by WMATA Metrobus
Z Express Lines, and Ride On
Service to White Oak
$721,199 Air Quality NPV
Auto users on roadway after
BRT implementation
Monetized value of accident
costs
Savings in Ride On Operations
and Maintenance Costs
Qualitative at this time In main narrative
New transit riders that divert
from using autos
All auto users
Monetized value of emission
reductions
US 29 BRT Riders, and all
residents, workers within
corridor.
Qualitative at this time
Monetized value of travel time
savings
$342,409,393 Travel Time NVP
New transit riders that divert
from using autos
Monetized value of User Cost
Savings
$43,796,093 User Cost NPV
Existing transit users will
divert to the new Rideon Plus
service
New transit users will divert to
the BRT service
Economic Benefit
Summary of Results
(7% Discount, 20 years)
Page Reference in BCA
(Spreadsheet)
Nobuild Transit Users that
change route
Nobuild Auto Users that
change mode
Input into other impacts
(below)
Travellers changing to transit from autos
increases from 4,500 in 2020 to 6,100 in 2040
(37%).
US 29 BRT Dailiy Boardings increase from
17,000 to 22,956 in 2040.
Savings in Regional VMT is 29,800 in 2020
and 34,100 in 2040.
Demand Analysis
& Travel time NVP
Population Affected By
ImpactsType of Impact
Change in system use
(transit riders, road volumes,
etc.)
Change to Baseline/Alternative
* Regional 2014 Constrained Long Range Plan
assumptions and networks for 2014/2015 and
2040 prorated over 21 year analysis period (2020
to 2040).
* Severe congestion exists north of the beltway on
the US 29 corridor and is forecast to exacerbate in
the future 2040 condition. This leads to extremely
slow general purpose lane speeds in the peak
period with transit vehicles caught in the general
flow.
* The study area has a strong transit market,
including an average weekday daily Metrorail
ridership of approximately 13,000 for Silver Spring
Station and more than 15,000 boardings for the
Metrobus Z line buses, Ride On buses, and MTA
commuter buses.
* Two regional activity centers, Silver Spring and
White Oak/FDA, serve as an engine for activities
and travel in the study area.
* Strong employment growth in these two regional
activity centers is forecasted for 2040, with a
growth of almost 80% over current levels.
* Intra-study-area trips represent a significant
share of travel market for the study area, with
approximately 40% of total trips in 2014 and are
expected to increase by nearly 30% in 2040.
* DC-bound commuting trips were a major out-
flow of trips from the study area, with
approximately 20,000 residents living in the study
area and commuting to DC.
* Another major DC-bound commuting flow of
approximately 10,000 was from Howard County.
Good Repair savings
Quality of Life due to lower
congestion, increased bike
use, healthier users
* US 29 BRT service from
Burtonsville to Silver Spring
* 14 miles with 12 station
locations
* Bus on Shoulder, Managed
Lane and mixed flow ROW
* Frequent (6 min. peak, 10 min.
offpeak headways)
* All Day service in both
directions
* 10 Bike Share Facilities
* ADA pedestrian improvements
* 17 covered bike racks
* Improved station amenities
(canopies, seating, passenger
information, bike parking, etc.)
* Outreach and Marketing
* Transit Signal Priority
* Specialty BRT Vehicles
* Service revisions to the
WMATA Express Lines that run
dupliate service.
* Implementation of feeder and
circulator service to BRT stations.
Air Quality reduction in
emissions
Reduced accidents on
roadways due to lower VMT
Travel Time Savings
User Cost Savings

7055 Samuel Morse Drive, Suite 100, Columbia, Maryland 21446
Tel (443) 741-3500 www.sabra-wang.com Fax (443) 741-3700
Table 2 Benefit-Cost Analysis Summary (2015$)
The operation and maintenance (O&M) costs of $145,230,733 in undiscounted 2015$ ($103.55 million NPV at 7% discount and $125.28 million NPV at a 3% discount rate) is significant and driven by the additional $5.1 million annual cost to operate the US 29 BRT service. Other significant annual expenses include the maintenance of way at $1 million per year, signing and marking at $275 thousand, stations at $200 thousand, fare equipment at $127 thousand and bikeshare stations at $125 thousand. The additional costs for the service operations are likely to be high since the concomitant savings from the service reductions of parallel service on the Express Z line routes in the corridor were not included, since they are operated by the Washington Metropolitan Area Transit Authority (WMATA) and could not be used to offset Montgomery County costs. While the specific reduction in parallel service has not been calculated at this time, benefits can be realized by assuming reductions in parallel route service of up to 10% per route since the ridership estimation and forecasts predicted a noticeable shift in existing riders to the new US 29 service.
After the remaining life at the end of the 21-year analysis period of all capital cost items is valued and subtracted, this results in a total cost over the 21 years of $340,764,663 in undiscounted 2015$ ($169.0 million NPV at 7% discount and $224.9 million NPV at a 3% discount rate).
The benefits that were quantified and valued for the cost-benefit analysis include those for Economic Competiveness (travel time savings and user cost savings), Sustainability (reduction in emissions), and Safety (reduction in accidents). The benefits are the result of the improved transit travel times along the corridor, the institution of service in both directions throughout the day, and a reduction in wait times due to the more frequent service. On an average weekday, these lead to 4,460 new riders shifting from autos in 2020 and approximately 17,000 boardings throughout the day (the difference is due to existing riders changing to the new service). In 2040, this grows to 6,088 new riders and 23,000 boardings.
Consequently, the most significant benefits are shown to be from user travel time savings of $941,701,154 in undiscounted 2015$ ($342.4 million NPV at 7% and $593.0 million NPV at 3%). These benefits are conservative based upon the average time on the US 29 service and actual travel times. As explained in the full report, they would be higher if the travel-forecast door-to-door times accounting
No Discount 7% 3%
Benefits
Good Repair Qualitative at this time
User Time Savings $941,701,154 $342,409,393 $593,044,481
User Cost Savings $116,613,017 $43,796,093 $74,495,028
Quality of Life Qualitative at this time
SustainabilityGreenhouse Gas & Emissions Cost
Reductions$1,738,364 $721,199 $1,161,357
Safety Accident Reduction $387,036,916 $150,727,346 $251,480,268
Total Benefits 1,447,089,450$ 537,654,030$ 920,181,135$
Costs
Capital Costs $195,533,930 $65,446,024 $99,652,180
O&M Costs $145,230,733 $103,547,506 $125,277,306
Total Costs $340,764,663 $168,993,530 $224,929,487
$1,106,324,787 $368,660,501 $695,251,648Benefits - Costs
Economic
Competitveness
Discount Rate
US 29 BRT BCA Analysis September 7, 2016 Page 4
7055 Samuel Morse Drive, Suite 100, Columbia, Maryland 21446
Tel (443) 741-3500 www.sabra-wang.com Fax (443) 741-3700
for the full trip, or the perceived times accounting for the additional inconvenience that travelers attribute to waiting or transferring, were used.
Travelers that switch from automobile to transit also can receive benefits due to the reduced out-of-pocket costs of their new transit trip versus driving a car and parking. These changes in user costs result in $116,613,017 in undiscounted 2015$ ($43.8 million NPV at 7% and $74.5 million NPV at 3%).
The air quality and safety benefits from reduced auto travel on the roads within the region and primarily along the corridor are also quantified for the cost-benefit analysis. The value of the air quality savings is $1,738,364 in undiscounted 2015$ (0.72 million NPV at 7% and 1.16 million at 3%). This will be higher increase due to service reductions in the parallel Z line service. Last are the safety benefits due to the reduction in auto travel. These are mostly due to injury only accidents and sum to $387,036,916 in undiscounted 2015$ ($150.7 million NPV at 7% and $251.5 million at 3%).
Overall this results in a positive net benefit – costs over the 21-year life of the project.

US 29 BRT BCA Analysis September 7, 2016 Page 5
7055 Samuel Morse Drive, Suite 100, Columbia, Maryland 21446
Tel (443) 741-3500 www.sabra-wang.com Fax (443) 741-3700
2 Methodologies and Assumptions
This section describes the basic methodologies and assumptions that were used to develop the inputs and carry out the Benefit-Cost Analysis. Throughout, general best practices in conducting economic assessments were used (see, 1, 13, 16, and 17) and will not be discussed here.
2.1 Travel Demand Analysis Model
This section summarizes the methods used to forecast the change in system usage due to the US 29 BRT Build alternative (transit ridership, transit boardings, auto vehicles miles traveled, etc. between the No-Build and the Build US 29 BRT Alternative, and how these change over time). The travel demand analysis model that was developed and calibrated for the Montgomery County US 29 BRT Corridor System Planning Study (see reference Error! Reference source not found. for a full description) was chosen as a base model for the TIGER Grant analysis. It was based on the adopted regional travel forecasting model, MWCOG V 2.3.57 Regional Travel Demand Model with the 2014 CLRP networks and Round 8.3 Cooperative Land Use Forecasts (8, 10, 12). The regional model was last updated and adopted with the constrained long ranged plan networks and demographics in October 2014. It is a traditional trip-based, "four-step" travel model utilizing 4 feedback iterations with additional features including estimation of motorized and non-motorized trips, time-of-day modeling, and incorporation of detailed transit schedules from General Transit Feed Specification (GTFS) data. It was calibrated to the most recent transit ridership and other data in 2012 (9), and validated to the 2010 U.S. Census data in 2013 (11). (See
http://www.mwcog.org/transportation/activities/models/current.asp for more). For the US 29 BRT
Figure 1 US 29 BRT Corridor and Traffic Analysis Zones (TAZs)

US 29 BRT BCA Analysis September 7, 2016 Page 6
7055 Samuel Morse Drive, Suite 100, Columbia, Maryland 21446
Tel (443) 741-3500 www.sabra-wang.com Fax (443) 741-3700
Corridor System Planning Study (ongoing) carried out in coordination with Montgomery County, and the Maryland State Highway and Maryland Transit Administrations, additional Land Use reflecting the recently adopted White Oak Science Gateway Master Plan was incorporated in the land use forecasts along with additional network detail. This model was validated to 2014/2015 conditions and a No-Build 2040 land use and travel forecast scenario developed.
The US 29 BRT Corridor, study area, and Traffic Analysis Zones (TAZs) used are shown in Figure 1 (Error! Reference source not found.). The 2014/2015 to 2040 Household and Employment Growth input into the models is shown in Figure 2 and Figure 3 (Error! Reference source not found.).

US 29 BRT BCA Analysis September 7, 2016 Page 7
7055 Samuel Morse Drive, Suite 100, Columbia, Maryland 21446
Tel (443) 741-3500 www.sabra-wang.com Fax (443) 741-3700
Figure 2 Household Growth 2014/2015 to 2040

US 29 BRT BCA Analysis September 7, 2016 Page 8
7055 Samuel Morse Drive, Suite 100, Columbia, Maryland 21446
Tel (443) 741-3500 www.sabra-wang.com Fax (443) 741-3700
Figure 3 2014/2015 Employment Growth
For this analysis a pivot point approach was chosen for carrying out the forecasts. In this approach, the trip generation and trip distribution (person trips) from the baseline regional model runs remain fixed and the last iteration skims (highway and transit), mode choice, and assignments (highway and transit) are rerun with the new transit inputs. This approach was warranted because it is unlikely that a single new transit line should impact regional trip productions and overall travel patterns, and using the person trip distribution from a no-build alternative is recommended by the FTA for transit alternative analyses. The results of the travel demand analysis are shown in Table 3 (see the “Travel Demand” tab in the accompanying Excel Workbook). The change was distributed by year from 2015 to 2040 using a straight line allocation (see the Travel NVP TAB rows 56-83).
Table 3 Summary of Travel Demand Results
Year VHT Occ APHT
Model 2015 No Build 1159626 16681291 165465035 9.92 32.28 5126358 1.41 7228165
US 29 1163679 15530 16677965 165436241 9.92 32.29 5123837 1.41 7224610Change 4053 -3326 -28794 -2521 -3555
Model 2040 No Build 1583928 20452069 207777313 10.16 27.59 7531933 1.43 10770664
US 29 1590016 22956 20447671 207743184 10.16 27.60 7527600 1.43 10764468Change 6088 -4398 -34129 -4333 -6196
% change 2015-2040 Nobuild 36.59% 22.60% 25.57% 0.02 -0.15 0.47 0.49
% change 2015-2040 BRT 36.64% 47.82% 22.60% 25.57% 0.02 -0.15 0.47 0.49
Trip Generation and Trip Distribution Fixed
Final iteration
Veh Trips VMT VMT/Trip Ave Spd
Source: US 29 BRT Study Model (MWCOG V 2.3.57 Regional Travel Demand Model 2014 CLRP and Round 8.3 Cooperative Forecasts with White Oak Science Gateway Land
Use) pivot analyses.
AutoRegional
Linked Transit
Trips
US 29 BRT
Brdings
US 29 BRT BCA Analysis September 7, 2016 Page 9
7055 Samuel Morse Drive, Suite 100, Columbia, Maryland 21446
Tel (443) 741-3500 www.sabra-wang.com Fax (443) 741-3700
2.2 Alternatives (No-Build and US 29 BRT)
Key to any economic analysis is the careful definition of the No-Build and US 29 BRT Build service to capture all of the potential impacts and costs that may be caused by a project’s implementation. If too narrow a corridor or system is defined then impacts or costs may be overlooked. Consequently, the following was assumed for the No-Build and Build (US29 BRT) service:
No-Build Alternatives (2014/2015 and 2040): – MWCOG 2014 CLRP system plus US 29 BRT Corridor current and 2040 No-Build network
changes – Regional Round 8.3 cooperative land use forecasts with White Oak Science Gateway Master
Plan growth in the White Oak Area. – Current transit service for 2014/2015 and 2040. All inputs and outputs prorated for the
analysis of the years of operation (2020-2040). – Current Transit Service schedule run times (degraded in model for future years by forecast
congestion factor) (10).
Build US29 BRT Alternative. – The 2014/2015 and 2040 No-Build transit service as background service with the following
changes (see reference 1 for service configuration details). – 6 minute peak and 10 minute off peak headways – Station Dwell at BRT Stops of 30 seconds (reflects off board fare payment, multi-door
boarding, etc.) – Transit Signal Priority on all Vehicles with TSP at 15 signals along corridor. Travel time
savings due to TSP in the peak are assumed to be 7.5% and for the off peak 5 seconds per intersection) (Error! Reference source not found.).
US 29 BRT BCA Analysis September 7, 2016 Page 10
7055 Samuel Morse Drive, Suite 100, Columbia, Maryland 21446
Tel (443) 741-3500 www.sabra-wang.com Fax (443) 741-3700
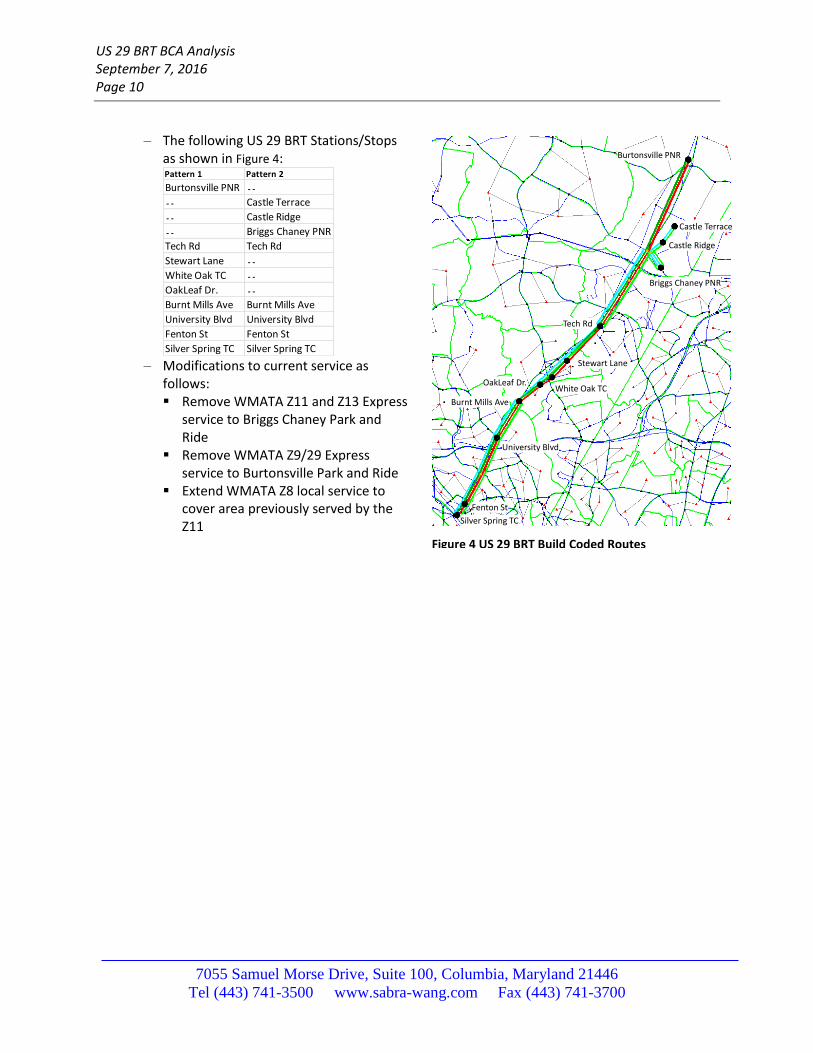
– The following US 29 BRT Stations/Stops as shown in Figure 4:
– Modifications to current service as
follows: Remove WMATA Z11 and Z13 Express
service to Briggs Chaney Park and Ride
Remove WMATA Z9/29 Express service to Burtonsville Park and Ride
Extend WMATA Z8 local service to cover area previously served by the Z11
Pattern 1 Pattern 2
Burtonsville PNR - -
- - Castle Terrace
- - Castle Ridge
- - Briggs Chaney PNR
Tech Rd Tech Rd
Stewart Lane - -
White Oak TC - -
OakLeaf Dr. - -
Burnt Mills Ave Burnt Mills Ave
University Blvd University Blvd
Fenton St Fenton St
Silver Spring TC Silver Spring TC
Figure 4 US 29 BRT Build Coded Routes
Silver Spring TC
Fenton St
University Blvd
Burnt Mills Ave
OakLeaf Dr.White Oak TC
Stewart Lane
Briggs Chaney PNR
Castle Ridge
Castle Terrace
Tech Rd
Burtonsville PNR

US 29 BRT BCA Analysis September 7, 2016 Page 11
7055 Samuel Morse Drive, Suite 100, Columbia, Maryland 21446
Tel (443) 741-3500 www.sabra-wang.com Fax (443) 741-3700
Extend the WMATA Z6 local peak service to cover area previously served by the Z9/Z29 Create new feeder service from South
Laurel to Burtonsville (previously Z9/Z29) Terminate Ride-On 21 and 22 at the
White Oak Transit Center Extend the WMATA Express Service from
FDA to the White Oak Transit Center Add a White Oak Science Center
circulator/Shuttle to and from the Tech Road BRT Station.
– Incorporate BRT ROW Road Changes to reflect recommended priority treatments shown in Figure 5 US 29 BRT ROW Treatments: Bus on Shoulder = 20 mph above parallel
Roadway. In 2015 ~ 45 mph Managed Lanes = Free flow of general
purpose lanes. In 2015 varies from 20 to 30 mph
Mixed Use = Congested speeds. In 2015 varies from 15 to 25 mph
Reverse direction in mixed flow
2.3 General Assumptions
The general assumptions used throughout the Benefit-Cost Analysis are as follows:
All input dollar values are expressed in 2015$ constant dollars.
The analysis period begins in 2017 with a 3 year start up (2017, 2018, 2019), and 21 years of operation (2020 – 2040).
No construction or startup costs or significant user impacts are anticipated.
A constant 7 percent real discount rate is used throughout the analysis. Sensitivity analyses are also provided for both 3 and 0 percent real discount rates.
Standard formulas for discounting and converting life cycles of costs and benefits to Net Present Value are used throughout (17, 13)
Average Weekday Annualization factor of 290. This is in between the current ratio of average weekday to annual boardings for Montgomery County Ride On of 302, and a focused peak period service provided only on weekdays (~290). New Starts Projects for the FTA often use values ranging from 280 to 300, with special justification requested for values approaching 300.
3 Benefits (Impacts)
The analyses and their major assumptions that were used to estimate the quantifiable benefits (impacts) from the US 29 BRT Service are described in this section. This includes User Time Savings, User Cost Savings, Greenhouse Gas and Emissions Cost Reductions, and Accident Cost Savings. All are documented in the accompanying Excel Workbook.
Figure 5 US 29 BRT ROW Treatments

US 29 BRT BCA Analysis September 7, 2016 Page 12
7055 Samuel Morse Drive, Suite 100, Columbia, Maryland 21446
Tel (443) 741-3500 www.sabra-wang.com Fax (443) 741-3700
3.1 User Time Savings
The User Time Savings benefits are due to the improved transit travel times along the corridor (from mixed flow service along US 29 to a mixture of Bus on Shoulder at 20 mph above the parallel general traffic lanes, managed lane service at free flow speeds, and small segments of mixed flow), institution of 2 way service throughout the day, and a reduction in wait times caused by BRT headways of 6 minutes in the peak and 10 minutes in the off-peak periods. On an average weekday, these lead to 4,460 new riders shifting from autos in 2020 and approximately 17,000 boardings throughout the day (the difference is due to existing riders changing to the new service). In 2040, this grows to 6,088 new riders and 23,000 boardings.
Time savings are calculated first by estimating difference in Auto Passenger Hours Traveled from the Vehicle Hours Traveled from the highway assignments between the No-Build and US 29 BRT Build alternatives. Second, hours saved by those using the US 29 BRT Service are estimated from the change in wait time plus the time saved due to the faster speeds for those boarding the system (see the Demand Analysis and Travel Time NVP Tabs). These time savings are then multiplied by the average $13.45 per hour value of time in 2015 grown by 1.2 % a year for urban areas as recommended in the 2016 TIGER CBA Resource Guide (17).
The User Time Saving Calculations are calculated in the Travel Time NVP tab and shown in Table 4. The Net Present Value (NPV) of the savings across the 21 year analysis period is $941,701,154 in undiscounted 2015$ ($342.4 million NPV at 7% and $593.0 million NPV at 3%). These benefits are conservative based upon the average time on the US 29 BRT service and actual travel times. They would be higher if the travel-forecast door-to-door times accounting for the full trip, or the perceived times accounting for the additional inconvenience that travelers attribute to waiting or transferring, were used. The time savings from these alternative methods are also shown in the Travel Time NVP tab.

US 29 BRT BCA Analysis September 7, 2016 Page 13
7055 Samuel Morse Drive, Suite 100, Columbia, Maryland 21446
Tel (443) 741-3500 www.sabra-wang.com Fax (443) 741-3700
Table 4 User Value of Time NPV
3.2 User Cost Savings
Travelers that switch from automobile to transit also can receive benefits due to the reduced out-of-pocket costs of their new transit trip versus driving a car and parking. These benefits are estimated from the new transit trips that use the US 29 BRT Service. This is provided from the change in Vehicle Miles Travelled from the travel demand model. The change in VMT is multiplied by the 2015 total cost of driving a car of $0.54 per mile provided by the Internal Revenue Service (14). The potential cost of parking is also added assuming an average $5.00 in 2015$ and 25% pay for parking currently and 50% pay for parking in 2040. The increased percentage is due to the additional development and densification in the activity centers along the corridor (Silver Spring, White Oak) and the implementation of travel demand management strategies to meet reduction in drive alone vehicle trips. An average US 29 BRT fare is also incorporated.
The User Cost Savings are calculated in the User Cost NPV tab and also shown in Table 5. These changes in user costs result in $116,613,017 in undiscounted 2015$ ($43.8 million NPV at 7% and $74.5 million NPV at 3%).
Year
Transit Time
Savings
(Hours)
Auto Time
Savings
(Hours)
Ave. Wk. day
Time Savings
(Hrs)
Annualization
Factor
Annual
Time Savings
(Hrs)
VOT (All
Trips)
(2015$)/hr
Total
2015 $
NPV
7%
NPV
3%
2015 $13.45
2016 $13.61
Startup 2017 $13.77
2018 $13.94 2019 $14.11
1 2020 3482 4083 7564 290 2193695 $14.28 31,318,506$ 22,329,662$ 27,015,618$
2 2021 3570 4189 7758 290 2249924 $14.45 32,506,723$ 21,660,602$ 27,223,869$
3 2022 3658 4294 7952 290 2306153 $14.62 33,718,949$ 20,998,467$ 27,416,591$
4 2023 3746 4400 8146 290 2362382 $14.80 34,955,586$ 20,344,470$ 27,594,263$
5 2024 3834 4506 8340 290 2418612 $14.97 36,217,048$ 19,699,674$ 27,757,351$
6 2025 3923 4611 8534 290 2474841 $15.15 37,503,751$ 19,065,005$ 27,906,313$
7 2026 4011 4717 8728 290 2531070 $15.34 38,816,119$ 18,441,259$ 28,041,590$
8 2027 4099 4823 8922 290 2587299 $15.52 40,154,584$ 17,829,116$ 28,163,617$
9 2028 4187 4928 9116 290 2643529 $15.71 41,519,582$ 17,229,151$ 28,272,815$
10 2029 4276 5034 9310 290 2699758 $15.89 42,911,559$ 16,641,842$ 28,369,595$
11 2030 4364 5140 9503 290 2755987 $16.09 44,330,963$ 16,067,581$ 28,454,358$
12 2031 4452 5245 9697 290 2812216 $16.28 45,778,255$ 15,506,679$ 28,527,495$
13 2032 4540 5351 9891 290 2868446 $16.47 47,253,897$ 14,959,374$ 28,589,385$
14 2033 4629 5457 10085 290 2924675 $16.67 48,758,363$ 14,425,840$ 28,640,399$
15 2034 4717 5562 10279 290 2980904 $16.87 50,292,131$ 13,906,193$ 28,680,900$
16 2035 4805 5668 10473 290 3037133 $17.07 51,855,689$ 13,400,495$ 28,711,238$
17 2036 4893 5774 10667 290 3093363 $17.28 53,449,530$ 12,908,761$ 28,731,756$
18 2037 4981 5879 10861 290 3149592 $17.49 55,074,156$ 12,430,962$ 28,742,789$
19 2038 5070 5985 11055 290 3205821 $17.70 56,730,077$ 11,967,033$ 28,744,662$
20 2039 5158 6091 11248 290 3262050 $17.91 58,417,808$ 11,516,873$ 28,737,691$
21 2040 5246 6196 11442 290 3318280 $18.12 60,137,877$ 11,080,354$ 28,722,185$
Total 941,701,154$ 342,409,393$ 593,044,481$

US 29 BRT BCA Analysis September 7, 2016 Page 14
7055 Samuel Morse Drive, Suite 100, Columbia, Maryland 21446
Tel (443) 741-3500 www.sabra-wang.com Fax (443) 741-3700
Table 5 User Cost Savings NPV
3.3 Greenhouse Gas & Emissions Cost Reductions
The Greenhouse Gas & Emissions Cost Reductions are estimated from the change in auto vehicle miles traveled from the No-Build and US 29 BRT Build alternative highway assignments, multiplied by the emissions rates recommended by the Federal Transit Administration for New Starts Analyses (3) and the valuation of emissions savings from the 2016 TIGER CBA Resource Guide (17).
The Greenhouse Gas & Emissions Cost Reductions are calculated in the Air Quality NPV tab and also shown in Table 6 Air Quality NPV. The value of the air quality savings is $1,738,364 in undiscounted 2015$ ($.72 million NPV at 7% and $1.16 million at 3%).
Table 6 Air Quality NPV
Year
Change in
Transit Person
Trips
Avg weekday
change in
Auto VMT
Avg weekday
change in
mile costs
Avg Weekday
change in
Parking Costs
Avg Weekday
Fares Paid
($1.75/Trip)
Avg Weekday
Cost Savings
Annual Auto
Cost Savings
Total
2015 $
NPV
7%
NPV
3%
2015
2016
Startup 2017
20182019
1 2020 4460 29861 $16,125 $7,097 $7,805 $15,417 $4,470,913 4,470,913$ 3,187,699$ 3,856,648$
2 2021 4541 30074 $16,240 $7,503 $7,947 $15,796 $4,580,804 4,580,804$ 3,052,383$ 3,836,351$
3 2022 4623 30288 $16,355 $7,909 $8,090 $16,175 $4,690,695 4,690,695$ 2,921,129$ 3,813,965$
4 2023 4704 30501 $16,471 $8,315 $8,232 $16,554 $4,800,587 4,800,587$ 2,793,985$ 3,789,628$
5 2024 4786 30715 $16,586 $8,722 $8,375 $16,933 $4,910,478 4,910,478$ 2,670,975$ 3,763,473$
6 2025 4867 30928 $16,701 $9,128 $8,517 $17,312 $5,020,370 5,020,370$ 2,552,101$ 3,735,627$
7 2026 4948 31141 $16,816 $9,534 $8,660 $17,691 $5,130,261 5,130,261$ 2,437,350$ 3,706,210$
8 2027 5030 31355 $16,932 $9,940 $8,802 $18,069 $5,240,153 5,240,153$ 2,326,690$ 3,675,338$
9 2028 5111 31568 $17,047 $10,346 $8,945 $18,448 $5,350,044 5,350,044$ 2,220,078$ 3,643,120$
10 2029 5193 31782 $17,162 $10,752 $9,087 $18,827 $5,459,936 5,459,936$ 2,117,457$ 3,609,661$
11 2030 5274 31995 $17,277 $11,159 $9,229 $19,206 $5,569,827 5,569,827$ 2,018,762$ 3,575,060$
12 2031 5355 32208 $17,393 $11,565 $9,372 $19,585 $5,679,718 5,679,718$ 1,923,917$ 3,539,413$
13 2032 5437 32422 $17,508 $11,971 $9,514 $19,964 $5,789,610 5,789,610$ 1,832,842$ 3,502,809$
14 2033 5518 32635 $17,623 $12,377 $9,657 $20,343 $5,899,501 5,899,501$ 1,745,450$ 3,465,335$
15 2034 5600 32849 $17,738 $12,783 $9,799 $20,722 $6,009,393 6,009,393$ 1,661,647$ 3,427,073$
16 2035 5681 33062 $17,853 $13,189 $9,942 $21,101 $6,119,284 6,119,284$ 1,581,339$ 3,388,099$
17 2036 5762 33275 $17,969 $13,595 $10,084 $21,480 $6,229,176 6,229,176$ 1,504,427$ 3,348,489$
18 2037 5844 33489 $18,084 $14,002 $10,227 $21,859 $6,339,067 6,339,067$ 1,430,811$ 3,308,312$
19 2038 5925 33702 $18,199 $14,408 $10,369 $22,238 $6,448,959 6,448,959$ 1,360,388$ 3,267,634$
20 2039 6007 33916 $18,314 $14,814 $10,512 $22,617 $6,558,850 6,558,850$ 1,293,055$ 3,226,520$
21 2040 6088 34129 $18,430 $14,002 $10,654 $21,777 $6,315,391 6,315,391$ 1,163,606$ 3,016,266$
$0.540 Total 116,613,017$ 43,796,093$ 74,495,028$
290
Avg Fare = $1.75
Total Auto Cost Per mile =
Annualization Factor =
Current Year = 2015
Year
Avg Weekday
Savings in Auto
VMT
Annual Savings
in Auto VMT
Change in CO
(Metric Tons)
Change in Nox
(Metric Tons)
Change in VOC
(Metric Tons)
Change in PM2.5
(Metric Tons)
Value of CO
2015$
Value of Nox
2015$
Value of VOC
2015$
Value of PM2.5
2015$
Total Value
Emissions
(2015$)
Total
2015 $
NPV
7%
NPV
3%
2015
2016
Startup 2017
20182019
1 2020 29861 8659690 133.94808 6.65064 4.52036 0.08660 6,162$ 53,272$ 9185.36782 31,730$ 100,349$ 100,349$ 71,547$ 86,562$
2 2021 30074 8721576 132.63424 6.45048 4.41661 0.08722 6,234$ 51,668$ 8974.54357 31,957$ 98,834$ 98,834$ 65,857$ 82,772$
3 2022 30288 8783462 131.28816 6.24680 4.31092 0.08783 6,171$ 50,037$ 8759.79584 32,184$ 97,151$ 97,151$ 60,501$ 78,993$
4 2023 30501 8845348 129.90986 6.03960 4.20331 0.08845 6,236$ 48,377$ 8541.12464 32,411$ 95,565$ 95,565$ 55,620$ 75,440$
5 2024 30715 8907234 128.49932 5.82889 4.09376 0.08907 6,425$ 46,689$ 8318.52996 32,637$ 94,070$ 94,070$ 51,168$ 72,097$
6 2025 30928 8969120 127.05655 5.61467 3.98229 0.08969 6,480$ 44,973$ 8092.01182 32,864$ 92,410$ 92,410$ 46,976$ 68,761$
7 2026 31141 9031006 125.58156 5.39693 3.86888 0.09031 6,530$ 43,229$ 7861.57020 33,091$ 90,712$ 90,712$ 43,097$ 65,532$
8 2027 31355 9092892 124.07433 5.17567 3.75355 0.09093 6,576$ 41,457$ 7627.20510 33,318$ 88,978$ 88,978$ 39,507$ 62,407$
9 2028 31568 9154778 122.53487 4.95090 3.63628 0.09155 6,617$ 39,657$ 7388.91653 33,544$ 87,207$ 87,207$ 36,188$ 59,384$
10 2029 31782 9216664 120.96319 4.72262 3.51708 0.09217 6,653$ 37,828$ 7146.70449 33,771$ 85,399$ 85,399$ 33,119$ 56,459$
11 2030 31995 9278550 119.35927 4.49082 3.39595 0.09279 6,565$ 35,971$ 6900.56898 33,998$ 83,435$ 83,435$ 30,241$ 53,554$
12 2031 32208 9340436 117.72312 4.25550 3.27289 0.09340 6,592$ 34,087$ 6650.50999 34,225$ 81,554$ 81,554$ 27,625$ 50,822$
13 2032 32422 9402322 116.05474 4.01667 3.14790 0.09402 6,731$ 32,174$ 6396.52753 34,451$ 79,753$ 79,753$ 25,248$ 48,252$
14 2033 32635 9464208 114.35413 3.77433 3.02098 0.09464 6,747$ 30,232$ 6138.62159 34,678$ 77,796$ 77,796$ 23,017$ 45,697$
15 2034 32849 9526094 112.62129 3.52847 2.89212 0.09526 6,757$ 28,263$ 5876.79219 34,905$ 75,802$ 75,802$ 20,960$ 43,229$
16 2035 33062 9587980 110.85622 3.27909 2.76134 0.09588 6,762$ 26,266$ 5611.03930 35,132$ 73,771$ 73,771$ 19,064$ 40,845$
17 2036 33275 9649866 109.05893 3.02620 2.62862 0.09650 6,762$ 24,240$ 5341.36295 35,358$ 71,701$ 71,701$ 17,317$ 38,543$
18 2037 33489 9711752 107.22940 2.76979 2.49398 0.09712 6,755$ 22,186$ 5067.76312 35,585$ 69,595$ 69,595$ 15,708$ 36,321$
19 2038 33702 9773638 105.36764 2.50987 2.35740 0.09774 6,744$ 20,104$ 4790.23982 35,812$ 67,450$ 67,450$ 14,228$ 34,176$
20 2039 33916 9835524 103.47365 2.24643 2.21889 0.09836 6,726$ 17,994$ 4508.79304 36,039$ 65,267$ 65,267$ 12,867$ 32,107$
21 2040 33489 9711752 99.64258 1.94235 2.03947 0.09712 6,277$ 15,558$ 4144.19881 35,585$ 61,565$ 61,565$ 11,343$ 29,404$
Total 1,738,364$ 721,199$ 1,161,357$

US 29 BRT BCA Analysis September 7, 2016 Page 15
7055 Samuel Morse Drive, Suite 100, Columbia, Maryland 21446
Tel (443) 741-3500 www.sabra-wang.com Fax (443) 741-3700
Note, that the air quality benefits assume that the US29 BRT service will use Clean Diesel or CNG vehicles with a zero net impact in emissions when the current service that is being reduced is taken into account.
3.4 Accident Reductions
The savings due to accident reductions are estimated based on the savings in auto vehicle mile traveled from No-Build and US 29 BRT Build alternative highway assignments multiplied by the Montgomery County accident rates obtained from the Maryland State Highway Administration (Error! Reference source not found.). These produce estimated changes in Property Damage Only (PDO), Injury, and Fatal crashes which are then multiplied by the recommended values described in the 2016 TIGER BCA Resource Guide (17).
The Accident Reduction cost savings are calculated in the Safety NPV tab and shown in Table 7. These are mostly due to injury only accidents and sum to $387,036,916 in undiscounted 2015$ ($150.7 million NPV at 7% and $251.5 million at 3%).
Table 7 Accident Reduction NPV
4 Costs
The cost items used for the Benefit-Cost Analysis are provided in the Cost Items tab and shown in Table 8. All items were provided based upon current experience by the Montgomery County Department of Transportation and Ride On. Note, that the costs assume that the US 29 BRT service will be implemented with reductions in the Z 29 express current transit service routes that provide parallel service and some Ride On service into White Oak. Since these services are provided by WMATA and it would be difficult to offset the savings to Montgomery County the savings were not included in the analysis. This leads to a conservative overall benefits-costs assessment.
Current Year = 2015
Year
Avg Weekday
Savings in VMT
Annual Savings
in VMT
Annual
Change
PDO Crashes
Annual
Change
Inj Crashes
Annual Change
Fatal Crashes
Value PDO
Crashes
(2015$)
Value Inj
Crashes
(2014$)
Value Fatal
Crashes
(2015$)
Total Value
Crashes (2015$)
Total
2015 $
NPV
7%
NPV
3%
2015
2016
Startup 2017
20182019
1 2020 29861 8659690 6.86756 4.02641 0.03468 28,830$ 16,839,322$ 332,913$ 17,201,065$ 17,201,065$ 12,264,121$ 14,837,789$
2 2021 30074 8721576 6.91664 4.05518 0.03493 29,036$ 16,959,663$ 335,292$ 17,323,991$ 17,323,991$ 11,543,707$ 14,508,570$
3 2022 30288 8783462 6.96572 4.08396 0.03517 29,242$ 17,080,005$ 337,671$ 17,446,918$ 17,446,918$ 10,865,063$ 14,185,941$
4 2023 30501 8845348 7.01480 4.11273 0.03542 29,448$ 17,200,346$ 340,050$ 17,569,844$ 17,569,844$ 10,225,809$ 13,869,797$
5 2024 30715 8907234 7.06387 4.14151 0.03567 29,654$ 17,320,687$ 342,429$ 17,692,771$ 17,692,771$ 9,623,695$ 13,560,035$
6 2025 30928 8969120 7.11295 4.17028 0.03592 29,860$ 17,441,029$ 344,808$ 17,815,697$ 17,815,697$ 9,056,597$ 13,256,552$
7 2026 31141 9031006 7.16203 4.19906 0.03617 30,066$ 17,561,370$ 347,187$ 17,938,623$ 17,938,623$ 8,522,511$ 12,959,243$
8 2027 31355 9092892 7.21111 4.22783 0.03641 30,272$ 17,681,711$ 349,567$ 18,061,550$ 18,061,550$ 8,019,544$ 12,668,008$
9 2028 31568 9154778 7.26019 4.25661 0.03666 30,478$ 17,802,052$ 351,946$ 18,184,476$ 18,184,476$ 7,545,911$ 12,382,744$
10 2029 31782 9216664 7.30927 4.28538 0.03691 30,684$ 17,922,394$ 354,325$ 18,307,403$ 18,307,403$ 7,099,926$ 12,103,350$
11 2030 31995 9278550 7.35835 4.31415 0.03716 30,890$ 18,042,735$ 356,704$ 18,430,329$ 18,430,329$ 6,680,000$ 11,829,727$
12 2031 32208 9340436 7.40743 4.34293 0.03740 31,096$ 18,163,076$ 359,083$ 18,553,256$ 18,553,256$ 6,284,630$ 11,561,776$
13 2032 32422 9402322 7.45650 4.37170 0.03765 31,302$ 18,283,418$ 361,462$ 18,676,182$ 18,676,182$ 5,912,401$ 11,299,397$
14 2033 32635 9464208 7.50558 4.40048 0.03790 31,508$ 18,403,759$ 363,841$ 18,799,109$ 18,799,109$ 5,561,978$ 11,042,495$
15 2034 32849 9526094 7.55466 4.42925 0.03815 31,714$ 18,524,100$ 366,221$ 18,922,035$ 18,922,035$ 5,232,100$ 10,790,972$
16 2035 33062 9587980 7.60374 4.45803 0.03840 31,920$ 18,644,441$ 368,600$ 19,044,962$ 19,044,962$ 4,921,580$ 10,544,734$
17 2036 33275 9649866 7.65282 4.48680 0.03864 32,127$ 18,764,783$ 370,979$ 19,167,888$ 19,167,888$ 4,629,296$ 10,303,684$
18 2037 33489 9711752 7.70190 4.51558 0.03889 32,333$ 18,885,124$ 373,358$ 19,290,815$ 19,290,815$ 4,354,191$ 10,067,731$
19 2038 33702 9773638 7.75098 4.54435 0.03914 32,539$ 19,005,465$ 375,737$ 19,413,741$ 19,413,741$ 4,095,268$ 9,836,782$
20 2039 33916 9835524 7.80005 4.57312 0.03939 32,745$ 19,125,807$ 378,116$ 19,536,668$ 19,536,668$ 3,851,588$ 9,610,746$
21 2037 34129 9897410 7.84913 4.60190 0.03963 32,951$ 19,246,148$ 380,495$ 19,659,594$ 19,659,594$ 4,437,429$ 10,260,195$
290 Total 387,036,916$ 150,727,346$ 251,480,268$ Annualization Factor =

US 29 BRT BCA Analysis September 7, 2016 Page 16
7055 Samuel Morse Drive, Suite 100, Columbia, Maryland 21446
Tel (443) 741-3500 www.sabra-wang.com Fax (443) 741-3700
The economic life of each capital asset is also an important input for carrying out full life cycle costing in a BCA. The values shown in Table 8 are those recommended by the Federal Transit Administration for transit assets (1) and for technology components from the USDOT ITS Cost database (4).
Table 8 Cost Items
4.1 Capital Costs
The life cycle capital costs are shown in the Capital Cost NPV tab and also shown in
Starting
Year
Economic
Life a
Units Capital Annual
O&M
Capital Annual
O&M
Planning/Design
Planning, Engineering, Design 2017 - 1 6,500,000$ 6,500,000$
Vehicles
Bus - BRT Articulated (including CAD/AVL and Fare Collection Technology)2020 12 13 1,000,000$ See US29 BRT
Service
13,000,000$ See US29 BRT
Service
TSP OnBoard Purchase & Install (w Engineering) 2020 10 12 20,000$ 417$ 240,000$ 5,000$
Stops/Stations
Concreate Pad 2020 20 16 45,000$ 2,250$ 720,000$ 36,000$
Canopy/Shelter Add/Upgrade 2020 30 16 248,624$ 12,431$ 3,977,984$ 198,899$
RTPI Signs 2020 5 17 21,300$ 1,000$ 362,100$ 17,000$
Right-of-way and Easements 2020 125 16 50,000$ 800,000$ -$
Off Board Fare Collection Equipment 2020 25 16 106,500$ 7,988$ 1,704,000$ 127,800$
Benches 2020 30 16 6,800$ 108,800$ -$
Trash Recepticles 2020 30 16 3,200$ 51,200$ -$
Bike Racks 2020 30 16 1,600$ 50$ 25,600$ 800$
Bicycle Parking (Covered) 2020 30 13 15,000$ 500$ 195,000$ 6,500$
Bicycle Share Station (Bikes & Docks) 2020 10 10 80,000$ 12,500$ 800,000$ 125,000$
ADA Sidewalk upgrades (feet total) 2020 25 6500 200$ -$ 1,300,000$ -$
Roadside/Right of Way
TSP Field Hardware & Install (w Engineering) 2020 10 15 35,000$ 1,200$ 525,000$ 18,000$
Signing and Marking of BAT and HOV Lanes (lane mi les ) 2020 20 22 250,000$ 12,500$ 5,500,000$ 275,000$
Signal changes for BAT Lane 2020 20 15 500,000$ 250$ 7,500,000$ 3,750$
Bus on Shoulder Burtonsville to Tech Road (lane mi les ) 2020 20 10 2,000,000$ 100,000$ 20,000,000$ 1,000,000$
Central Facilities & Systems
TSP Traffic System Software 2020 20 1 75,000$ 2,000$ 75,000$ 2,000$
Grant Overhead and Administration (3% of Total) 2017 to
2020
- 1 1,939,041$ - 1,939,041$
US 29 BRT Service
Marketing & Startup 2019 - 1 1,250,000$ - 1,250,000$
Operations 2020 - 1 5,100,000$ -$ 5,100,000$
Subtotal 66,573,725$
Other
Contingency
Total 66,573,725$
a
Unit Cost (2015$)
Element
Total Cost (2015$)
Economic Life:
ITS from the ITS Joint Program Office Cost Database(5/12/2015): http://www.itscosts.its.dot.gov/its/benecost.nsf/AdjustedUnitCosts
Transit Structures, Sidewalks, vehicles, from FTA New Starts/Small Starts Evaluation of Alternatives (5/12/2015): http://www.fta.dot.gov/12304_9718.html
7055 Samuel Morse Drive, Suite 100, Columbia, Maryland 21446
Tel (443) 741-3500 www.sabra-wang.com Fax (443) 741-3700
Table 9. As shown each asset is replaced at the end of its economic life. For those that extend beyond the 21 year analysis period a residual capital value is estimated for the remaining years of useful life. Note, that this leads to a higher overall life cycle cost than the initial $66.57 million. The life cycle capital costs increase to $195,533,930 in undiscounted 2015$ ($65.4 million NPV at 7% discount and $99.6 million NPV at a 3% discount rate) over the 21 year life of the project. This is primarily due to the replacement of the different components at the end of their economic life (vehicles at 12 years, bicycle stations and bikes at 10 years, passenger information displays at 5 years, and many other assets at 20 years). Note that the assets replaced at 20 years such as the Bus On Shoulder lane improvements are in service for only 1 year, before the end of the analysis. All remaining value for these and other assets that have not reached the end of their economic value is subtracted in the Residual Capital Recovery calculations.

US 29 BRT BCA Analysis September 7, 2016 Page 18
7055 Samuel Morse Drive, Suite 100, Columbia, Maryland 21446
Tel (443) 741-3500 www.sabra-wang.com Fax (443) 741-3700
Table 9 Capital Cost NPV
Central BRT
Vehicles TSP
Concreate
Pad Station Upgrades
RTPI
Signs
ROW &
Easements
Off Board
Fare Equip.
Benchs, Trash
Cans, Bike Racks &
Bike Parking
Bicycle Share
Stations
ADA Sidewalk
Upgrades
TSP Field
Equip
Signing &
Marking Signal Changes Bus On Shoulder
TSP
Software Grant Admin
Marketing &
Startup
RideOn +
O&M Current Year = 2015
Life
Year -- 12 10 20 30 5 125 25 30 10 25 10 20 20 20 20 - - -
Total
2015 $
NPV
7%
NPV
3%
2015
2016 -$ -$ -$ 2017 2,166,667$ 484,760$ 484,760$ 423,408$ 456,933$
2018 2,166,667$ 484,760$ 484,760$ 395,709$ 443,624$
Startup 2019 2,166,667$ 13,000,000$ 240,000$ 720,000$ 3,977,984$ 362,100$ 800,000$ 1,704,000$ 380,600$ 800,000$ 1,300,000$ 525,000$ 5,500,000$ 7,500,000$ 20,000,000$ 75,000$ 484,760$ 625,000$ 57,994,444$ 44,243,684$ 51,527,313$
1 2020 484,760$ 625,000$ 1,109,760$ 791,244$ 957,289$
2 2021 -$ -$ -$
3 2022 -$ -$ -$
4 2023 -$ -$ -$
5 2024 -$ -$ -$
6 2025 362,100$ 362,100$ 184,073$ 269,436$
7 2026 -$ -$ -$
8 2027 -$ -$ -$
9 2028 -$ -$ -$
10 2029 -$ -$ -$
11 2030 240,000$ 362,100$ 800,000$ 525,000$ 1,927,100$ 698,470$ 1,236,932$
12 2031 -$ -$ -$
13 2032 13,000,000$ 13,000,000$ 4,115,467$ 7,865,214$
14 2033 -$ -$ -$
15 2034 -$ -$ -$
16 2035 362,100$ 362,100$ 93,574$ 200,486$
17 2036 -$ -$ -$
18 2037
19 2038
20 2039
21 2040 240,000$ 720,000$ 362,100$ 800,000$ 525,000$ 5,500,000$ 7,500,000$ 20,000,000$ 75,000$ 35,722,100$ 6,581,768$ 17,061,074$
7% 4,295,286$ 222,629$ 702,437$ 2,088,597$ 299,134$ 799,466$ 495,282$ 199,830$ 742,098$ 377,856$ 487,002$ 5,365,839$ 7,317,053$ 19,512,141$ 73,171$ 42,977,822$ 7,918,628$
3% 3,694,187$ 219,065$ 693,205$ 1,580,220$ 293,897$ 782,461$ 363,744$ 151,190$ 730,216$ 277,505$ 479,204$ 5,295,314$ 7,220,882$ 19,255,686$ 72,209$ 41,108,983$ 19,633,879$
Total 195,533,930$ 65,446,024$ 99,652,180$
Roadside
ROWVehicles Stops/Stations
Residual
Cap Value
Plan, Eng,
Design
US 29 BRT BCA Analysis September 7, 2016 Page 19
7055 Samuel Morse Drive, Suite 100, Columbia, Maryland 21446
Tel (443) 741-3500 www.sabra-wang.com Fax (443) 741-3700
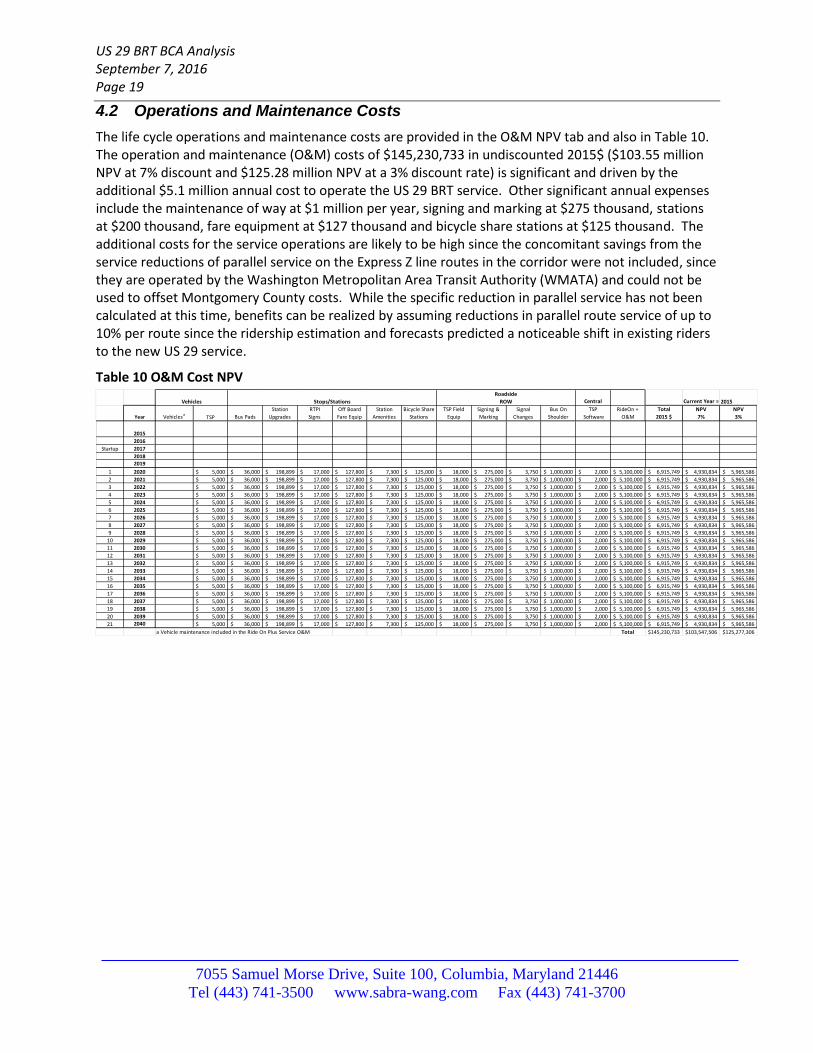
4.2 Operations and Maintenance Costs
The life cycle operations and maintenance costs are provided in the O&M NPV tab and also in Table 10. The operation and maintenance (O&M) costs of $145,230,733 in undiscounted 2015$ ($103.55 million NPV at 7% discount and $125.28 million NPV at a 3% discount rate) is significant and driven by the additional $5.1 million annual cost to operate the US 29 BRT service. Other significant annual expenses include the maintenance of way at $1 million per year, signing and marking at $275 thousand, stations at $200 thousand, fare equipment at $127 thousand and bicycle share stations at $125 thousand. The additional costs for the service operations are likely to be high since the concomitant savings from the service reductions of parallel service on the Express Z line routes in the corridor were not included, since they are operated by the Washington Metropolitan Area Transit Authority (WMATA) and could not be used to offset Montgomery County costs. While the specific reduction in parallel service has not been calculated at this time, benefits can be realized by assuming reductions in parallel route service of up to 10% per route since the ridership estimation and forecasts predicted a noticeable shift in existing riders to the new US 29 service.
Table 10 O&M Cost NPV
Central Current Year = 2015
Year VehiclesaTSP Bus Pads
Station
Upgrades
RTPI
Signs
Off Board
Fare Equip
Station
Amenities
Bicycle Share
Stations
TSP Field
Equip
Signing &
Marking
Signal
Changes
Bus On
Shoulder
TSP
Software
RideOn +
O&M
Total
2015 $
NPV
7%
NPV
3%
2015
2016
Startup 2017
20182019
1 2020 5,000$ 36,000$ 198,899$ 17,000$ 127,800$ 7,300$ 125,000$ 18,000$ 275,000$ 3,750$ 1,000,000$ 2,000$ 5,100,000$ 6,915,749$ 4,930,834$ 5,965,586$
2 2021 5,000$ 36,000$ 198,899$ 17,000$ 127,800$ 7,300$ 125,000$ 18,000$ 275,000$ 3,750$ 1,000,000$ 2,000$ 5,100,000$ 6,915,749$ 4,930,834$ 5,965,586$
3 2022 5,000$ 36,000$ 198,899$ 17,000$ 127,800$ 7,300$ 125,000$ 18,000$ 275,000$ 3,750$ 1,000,000$ 2,000$ 5,100,000$ 6,915,749$ 4,930,834$ 5,965,586$
4 2023 5,000$ 36,000$ 198,899$ 17,000$ 127,800$ 7,300$ 125,000$ 18,000$ 275,000$ 3,750$ 1,000,000$ 2,000$ 5,100,000$ 6,915,749$ 4,930,834$ 5,965,586$
5 2024 5,000$ 36,000$ 198,899$ 17,000$ 127,800$ 7,300$ 125,000$ 18,000$ 275,000$ 3,750$ 1,000,000$ 2,000$ 5,100,000$ 6,915,749$ 4,930,834$ 5,965,586$
6 2025 5,000$ 36,000$ 198,899$ 17,000$ 127,800$ 7,300$ 125,000$ 18,000$ 275,000$ 3,750$ 1,000,000$ 2,000$ 5,100,000$ 6,915,749$ 4,930,834$ 5,965,586$
7 2026 5,000$ 36,000$ 198,899$ 17,000$ 127,800$ 7,300$ 125,000$ 18,000$ 275,000$ 3,750$ 1,000,000$ 2,000$ 5,100,000$ 6,915,749$ 4,930,834$ 5,965,586$
8 2027 5,000$ 36,000$ 198,899$ 17,000$ 127,800$ 7,300$ 125,000$ 18,000$ 275,000$ 3,750$ 1,000,000$ 2,000$ 5,100,000$ 6,915,749$ 4,930,834$ 5,965,586$
9 2028 5,000$ 36,000$ 198,899$ 17,000$ 127,800$ 7,300$ 125,000$ 18,000$ 275,000$ 3,750$ 1,000,000$ 2,000$ 5,100,000$ 6,915,749$ 4,930,834$ 5,965,586$
10 2029 5,000$ 36,000$ 198,899$ 17,000$ 127,800$ 7,300$ 125,000$ 18,000$ 275,000$ 3,750$ 1,000,000$ 2,000$ 5,100,000$ 6,915,749$ 4,930,834$ 5,965,586$
11 2030 5,000$ 36,000$ 198,899$ 17,000$ 127,800$ 7,300$ 125,000$ 18,000$ 275,000$ 3,750$ 1,000,000$ 2,000$ 5,100,000$ 6,915,749$ 4,930,834$ 5,965,586$
12 2031 5,000$ 36,000$ 198,899$ 17,000$ 127,800$ 7,300$ 125,000$ 18,000$ 275,000$ 3,750$ 1,000,000$ 2,000$ 5,100,000$ 6,915,749$ 4,930,834$ 5,965,586$
13 2032 5,000$ 36,000$ 198,899$ 17,000$ 127,800$ 7,300$ 125,000$ 18,000$ 275,000$ 3,750$ 1,000,000$ 2,000$ 5,100,000$ 6,915,749$ 4,930,834$ 5,965,586$
14 2033 5,000$ 36,000$ 198,899$ 17,000$ 127,800$ 7,300$ 125,000$ 18,000$ 275,000$ 3,750$ 1,000,000$ 2,000$ 5,100,000$ 6,915,749$ 4,930,834$ 5,965,586$
15 2034 5,000$ 36,000$ 198,899$ 17,000$ 127,800$ 7,300$ 125,000$ 18,000$ 275,000$ 3,750$ 1,000,000$ 2,000$ 5,100,000$ 6,915,749$ 4,930,834$ 5,965,586$
16 2035 5,000$ 36,000$ 198,899$ 17,000$ 127,800$ 7,300$ 125,000$ 18,000$ 275,000$ 3,750$ 1,000,000$ 2,000$ 5,100,000$ 6,915,749$ 4,930,834$ 5,965,586$
17 2036 5,000$ 36,000$ 198,899$ 17,000$ 127,800$ 7,300$ 125,000$ 18,000$ 275,000$ 3,750$ 1,000,000$ 2,000$ 5,100,000$ 6,915,749$ 4,930,834$ 5,965,586$
18 2037 5,000$ 36,000$ 198,899$ 17,000$ 127,800$ 7,300$ 125,000$ 18,000$ 275,000$ 3,750$ 1,000,000$ 2,000$ 5,100,000$ 6,915,749$ 4,930,834$ 5,965,586$
19 2038 5,000$ 36,000$ 198,899$ 17,000$ 127,800$ 7,300$ 125,000$ 18,000$ 275,000$ 3,750$ 1,000,000$ 2,000$ 5,100,000$ 6,915,749$ 4,930,834$ 5,965,586$
20 2039 5,000$ 36,000$ 198,899$ 17,000$ 127,800$ 7,300$ 125,000$ 18,000$ 275,000$ 3,750$ 1,000,000$ 2,000$ 5,100,000$ 6,915,749$ 4,930,834$ 5,965,586$
21 2040 5,000$ 36,000$ 198,899$ 17,000$ 127,800$ 7,300$ 125,000$ 18,000$ 275,000$ 3,750$ 1,000,000$ 2,000$ 5,100,000$ 6,915,749$ 4,930,834$ 5,965,586$
a Vehicle maintenance included in the Ride On Plus Service O&M Total 145,230,733$ 103,547,506$ 125,277,306$
Roadside
ROWVehicles Stops/Stations
US 29 BRT BCA Analysis September 7, 2016 Page 20
7055 Samuel Morse Drive, Suite 100, Columbia, Maryland 21446
Tel (443) 741-3500 www.sabra-wang.com Fax (443) 741-3700
References
1. Bell, Chris, AECOM, “US 29 Configuration.docx”, US 29 Transit Service Operations Plan provided in an email from Darcy Buckley, RE:TIGER grant Info, March 11, 2016
2. Federal Transit Administration, 2009, FTA New Starts/Small Starts Evaluation of Alternatives (accessed 5/12/2015): http://www.fta.dot.gov/12304_9718.html"
3. Federal Transit Administration, August 2013, New and Small Starts Evaluation and Rating Process Final Policy Guidance, US Department of Transportation, Washington D.C.
4. Intelligent Transportation System Joint Program Office, 2015, ITS Joint Program Office Cost Database (accessed 5/12/2015): http://www.itscosts.its.dot.gov/its/benecost.nsf/AdjustedUnitCosts, US Department of
Transportation, Washington D.C. 5. Kittelson Associates, et.al., 2007, TCRP Report 118: Bus Rapid Transit Practitioner’s Guide,
Transportation Research Board, Washington D.C. 6. Liu, Feng, Cambridge Systematics Inc., September 2015, Regional Demand Model Presentation
to the Montgomery County Rapid Transit US 29 US 29 South Corridor Advisory Committee Technical Meeting, Silver Spring Maryland, September 10, 2015, http://www.montgomerycountymd.gov/BRT/Resources/Files/2015-09-10_FINAL_US29_CAC4_South.pdf
7. Maryland State Highway Administration, May 2015, email correspondence from Kevin Brown to John B Thomas , Accident Rates by Functional Class, Maryland State Highway Administration, Hanover Maryland.
8. Milone, Ronald, et.al., January 20, 2012, Calibration Report for the TPB Travel Forecasting Model, Version 2.3, on the 3,722-Zone Area System. Final Report: National Capital Region Transportation Planning Board, Washington, D.C.
9. Milone, Ronald, et.al., March 18, 2014, Highway and Transit Networks for the Version 2.3.52 Travel Model, based on the 2013 CLRP and FY 2013-2018 TIP Final Report, Metropolitan Washington Council of Governments, National Capital Region Transportation Planning Board, Washington D.C.
10. Milone, Ronald, et.al., October 17, 2014, User's Guide for the MWCOG/NCRTPB Travel Forecasting Model, Version 2.3, Build 57: Volume 1 of 2: Main Report and Appendix A (Flowcharts). Metropolitan Washington Council of Governments, National Capital Region Transportation Planning Board, Washington, D.C.
11. Milone, Ronald, June 30, 2013, Memorandum to Files. 2010 Validation of the Version 2.3 Travel Demand Model. Metropolitan Washington Council of Governments, Washington D.C.
12. National Capital Region Transportation Planning Board, October 2014, TPB Resolution R5-2015: Approved the air quality conformity (AQC) analysis of the 2014 Constrained Long-Range Transportation Plan (CLRP) and the FY 2015-2020 Transportation Improvement Plan (TIP), TPB
Resolution R6-2015: Approved the 2014 CLRP. Associated Networks, Round 8.3 Forecasts and MWCOG Travel Model Version 2.3 Build 57 transmitted October 17, 2014., Metropolitan Washington Council of Governments, National Capital Region Transportation Planning Board, Washington D.C.
13. Thuesen, H.G. et.al., 1977, Engineering Economy, Printice-Hall Inc. Englewood Cliffs, New Jersey
14. US Internal Revenue Service, 2015, 2016 Standard Mileage Rates Notice 2014-79, US Internal Revenue Service, Washington D.C., http://www.irs.gov/pub/irs-drop/n-16-01.pdf

US 29 BRT BCA Analysis September 7, 2016 Page 21
7055 Samuel Morse Drive, Suite 100, Columbia, Maryland 21446
Tel (443) 741-3500 www.sabra-wang.com Fax (443) 741-3700
15. US Department of Transportation Policy Office, June 2015, Guidance on Treatment of the Economic Value of a Statistical Life in U.S. Department of Transportation Analyses, US
Department of Transportation, Washington D.C.
16. USDOT, February 2016, Benefit-Cost Analysis Guidance for TIGER Grant Applications, US Department of Transportation, Washington DC., https://www.transportation.gov/policy-initiatives/tiger/2016-tiger-benefit-cost-analysis-guidance .
17. USDOT, March 2016, 2015 Tiger Benefit-Cost Analysis (BCA) Resource Guide, US Department of Transportation, Washington DC. https://www.transportation.gov/policy-initiatives/tiger/tiger-benefit-cost-analysis-bca-resource-guide
18. USDOT, February 26, 2016, Notice of Funding Opportunity for the Department of Transportation's National Infrastructure Investments Under the Consolidated Appropriations Act, 2016, Federal Register Notice 81-FR-9935, US Department of Transportation, Washington DC,
https://federalregister.gov/a/2016-04217