1 environmental issues in eritrea: opportunities and challenges asmerom m. gilau february 19, 2003
Post on 19-Dec-2015
216 views
TRANSCRIPT
11
ENVIRONMENTAL ISSUES IN ERITREA: ENVIRONMENTAL ISSUES IN ERITREA: Opportunities and ChallengesOpportunities and Challenges
Asmerom M. GilauAsmerom M. Gilau
February 19, 2003February 19, 2003

22
ObjectiveObjective
To share Eritrea’s environmental To share Eritrea’s environmental experience -- Challenges and experience -- Challenges and
Opportunities Opportunities & &
ask how those that failed could have ask how those that failed could have been performed for best results. been performed for best results.

33
I. THE COUNTRY: SOME FACTSI. THE COUNTRY: SOME FACTS
Located in the Horn of Africa. Located in the Horn of Africa. Won independence in 1991.Won independence in 1991. 3.5 m population, growing 3.5 m population, growing
at about 3% per annum at about 3% per annum GDP per capita: USD 200.00GDP per capita: USD 200.00 Elevation ranging from 0 - Elevation ranging from 0 -
over 2300 m.a.s.l over 2300 m.a.s.l 1900 km coast line1900 km coast line About 360 islandsAbout 360 islands Agriculture – 80% of the population
depend on agriculture.(19% of GDP,
1992-1997). High potential in Fisheries with
catch of 70,000 tons/year. Industry/Mining: At its infant stage
with good prospects in future. Tourism: Very high potential.Tourism: Very high potential.ERITREA

44
Towers with Dual Counterweights
1,620 cars, each car could hold about 300 kg (660 lbs.). It had the capacity
of transporting goods a rate of around 30 metric tons per hour in each
direction.
……SOME FACTS (cont.)SOME FACTS (cont.)
The Legacy of Engineering…..the ropeway was the longest (75km) in the World
“Asmara, the first town in the world to use electric power driven trucks? Ethiopian officials didn’t like them. If they are real trucks they have to take fuel and make noise, they reasoned. “
Asmara, world capital city of Art Deco!
Malta Agreement…
Etc……
Source: Society and Culture, Amanuel Sahle.

55
II. ENVIRONMNT and SUSTAINABLE DEVELOPMENTII. ENVIRONMNT and SUSTAINABLE DEVELOPMENT
Environment should be taken into account in any investment opportunity . Environment should be taken into account in any investment opportunity .
Success:Success:
EnergyEnergy -- -- Oil Exploration in the red sea by “Anadarko”Oil Exploration in the red sea by “Anadarko” – – Full EIA conducted.Full EIA conducted.
MiningMining -- -- Mineral exploration companies usually consider environmental issues.Mineral exploration companies usually consider environmental issues.
Failures/Setbacks:Failures/Setbacks:
AgricultureAgriculture -- -- Irrigation… “HIDCO”. They deforested very large landscape Irrigation… “HIDCO”. They deforested very large landscape without ensuring the availability of water. without ensuring the availability of water.
What makes them do this? The results were unsuccesful.What makes them do this? The results were unsuccesful.
Industry -- Allowing of asbestos plant without prior environmental impact assessment.
A. Macro Policy, 1994:A. Macro Policy, 1994:

66
Water Resources: Very scarce, over 80% of Eritrean land had less than 400mm of rain per annum, the minimum required for rain-fed agriculture
Forestry and green area: Reduced by almost 80% in the last 100 years. It is now estimated that only 0.3% of Eritrean land is covered by disturbed forest.
Natural hazards: The region is prone to periodic desert locust infestation. Draught is widespread. Starvation has taken its toll repeatedly during the last 5 decades. Eritrea suffers from desertfication and draught.
B. National Environmental Management Plan for Eritrea (NEMP-E) – 1995
The NEMP-E has been described as the blue print for sustainable development and environmental protection for Eritrea.
Environmental Challenges:

77
The UNIQUE FEATURES OF NEMP-E :The UNIQUE FEATURES OF NEMP-E :
1.1. Consensus Building:Consensus Building: Environmental priorities identified and Environmental priorities identified and agreed upon through a consultative process with all stakeholders agreed upon through a consultative process with all stakeholders including, the people, the Government, experts and academia. including, the people, the Government, experts and academia.
2.2. A self-reliant approach :A self-reliant approach : It was perceived and prepared entirely It was perceived and prepared entirely by Eritreans with some exceptions in case of coastal zone by Eritreans with some exceptions in case of coastal zone management. International experts and donors commented on the management. International experts and donors commented on the draft document in national and international conferences. draft document in national and international conferences.
NEMP-E – 1995 (Cont.)
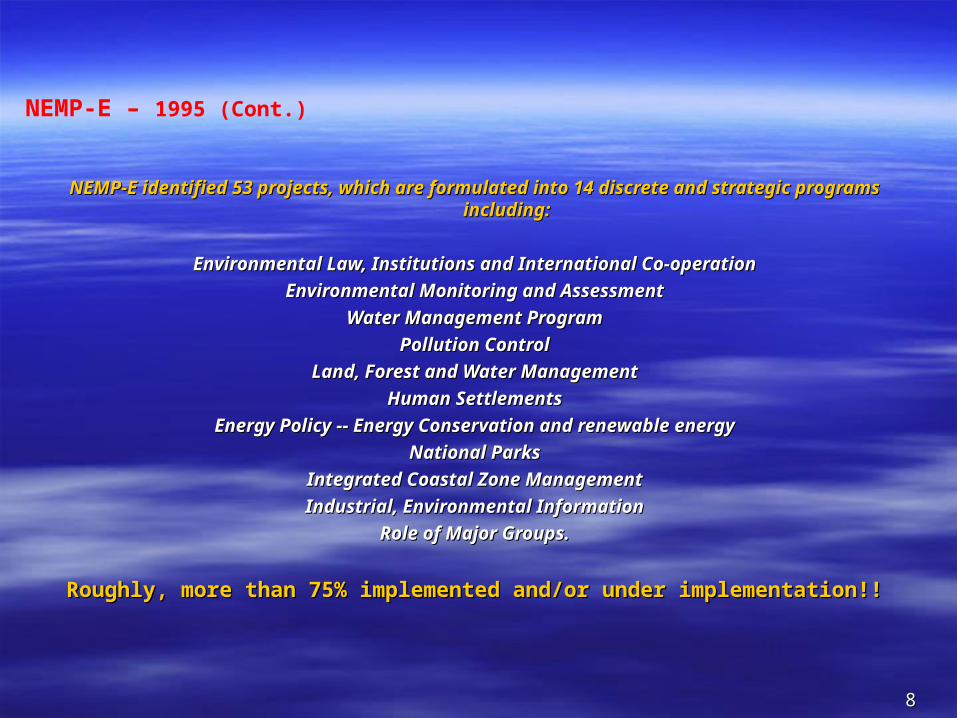
88
NEMP-E identified 53 projects, which are formulated into 14 discrete and strategic programs NEMP-E identified 53 projects, which are formulated into 14 discrete and strategic programs including:including:
Environmental Law, Institutions and International Co-operationEnvironmental Law, Institutions and International Co-operation
Environmental Monitoring and AssessmentEnvironmental Monitoring and Assessment
Water Management ProgramWater Management Program
Pollution ControlPollution Control
Land, Forest and Water ManagementLand, Forest and Water Management
Human SettlementsHuman Settlements
Energy Policy -- Energy Conservation and renewable energyEnergy Policy -- Energy Conservation and renewable energy
National ParksNational Parks
Integrated Coastal Zone ManagementIntegrated Coastal Zone Management
Industrial, Environmental InformationIndustrial, Environmental Information
Role of Major Groups.Role of Major Groups.
Roughly, more than 75% implemented and/or under implementation!!Roughly, more than 75% implemented and/or under implementation!!
NEMP-E – 1995 (Cont.)

99
Environmental awareness:Environmental awareness:
Annual Green Week Celebration :Annual Green Week Celebration :
Clean-up campaign:Clean-up campaign: After continued awareness for several years, After continued awareness for several years, administrative regions, cities, and towns are now organizing and administrative regions, cities, and towns are now organizing and implementing it by themselves. implementing it by themselves.
- Banning of plastic bags. - Banning of plastic bags. ““Car-free”Car-free” day. day. Student completionStudent completion – cycling, art, poetry and essay writing, and – cycling, art, poetry and essay writing, and poster making competition. poster making competition.
- Every summer—during vacation, students plant trees. - Every summer—during vacation, students plant trees. Annual Environmental Student Conference:Annual Environmental Student Conference: Quotes, “Each year, Quotes, “Each year,
every Eritrean should plant a tree in order to be entitled to citizenship every Eritrean should plant a tree in order to be entitled to citizenship at the age of 18.”at the age of 18.”
1010
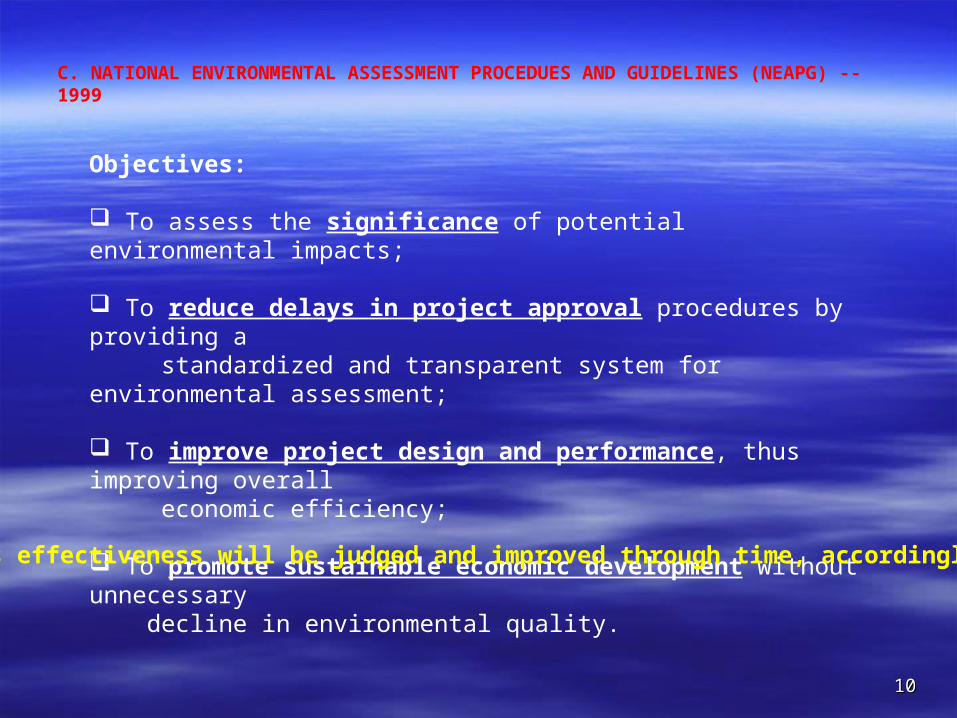
C. NATIONAL ENVIRONMENTAL ASSESSMENT PROCEDUES AND GUIDELINES (NEAPG) -- 1999
Objectives:
To assess the significance of potential environmental impacts;
To reduce delays in project approval procedures by providing a standardized and transparent system for environmental assessment;
To improve project design and performance, thus improving overall economic efficiency;
To promote sustainable economic development without unnecessary decline in environmental quality.
Its effectiveness will be judged and improved through time, accordingly.
1111
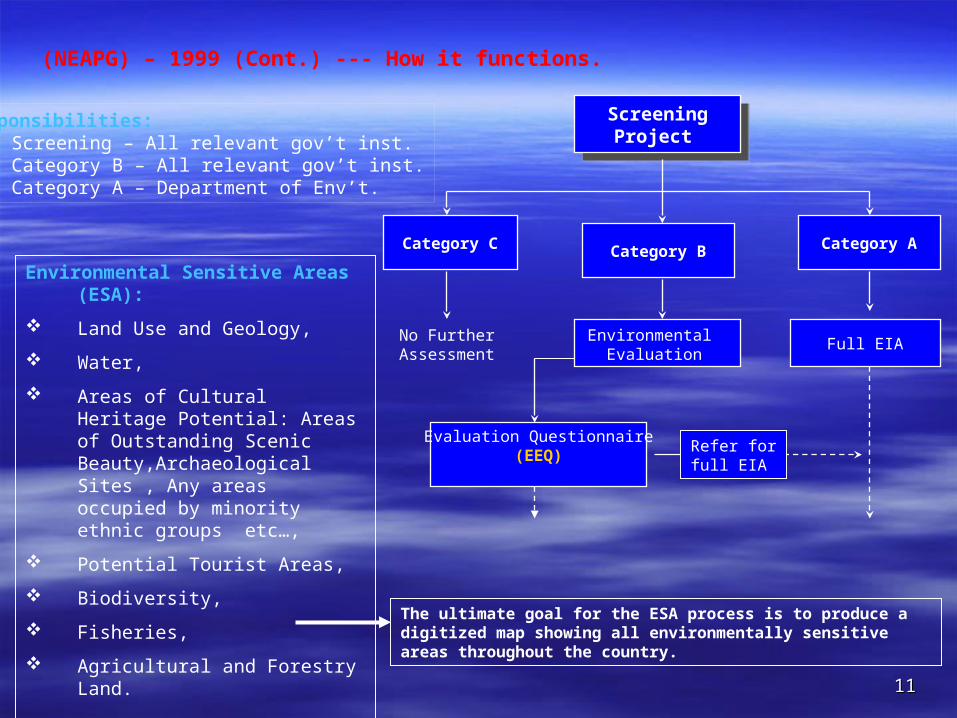
(NEAPG) – 1999 (Cont.) --- How it functions.
Category C Category B Category A
ScreeningProject
ScreeningProject
No FurtherAssessment
Refer forfull EIA
Environmental Evaluation
Responsibilities:1. Screening – All relevant gov’t inst.2. Category B – All relevant gov’t inst.3. Category A – Department of Env’t.
Environmental Sensitive Areas (ESA):
Land Use and Geology,
Water,
Areas of Cultural Heritage Potential: Areas of Outstanding Scenic Beauty,Archaeological Sites , Any areas occupied by minority ethnic groups etc…,
Potential Tourist Areas,
Biodiversity,
Fisheries,
Agricultural and Forestry Land. The ultimate goal for the ESA process is to produce a digitized map showing all environmentally sensitive areas throughout the country.
Full EIA
Evaluation Questionnaire(EEQ)
1212
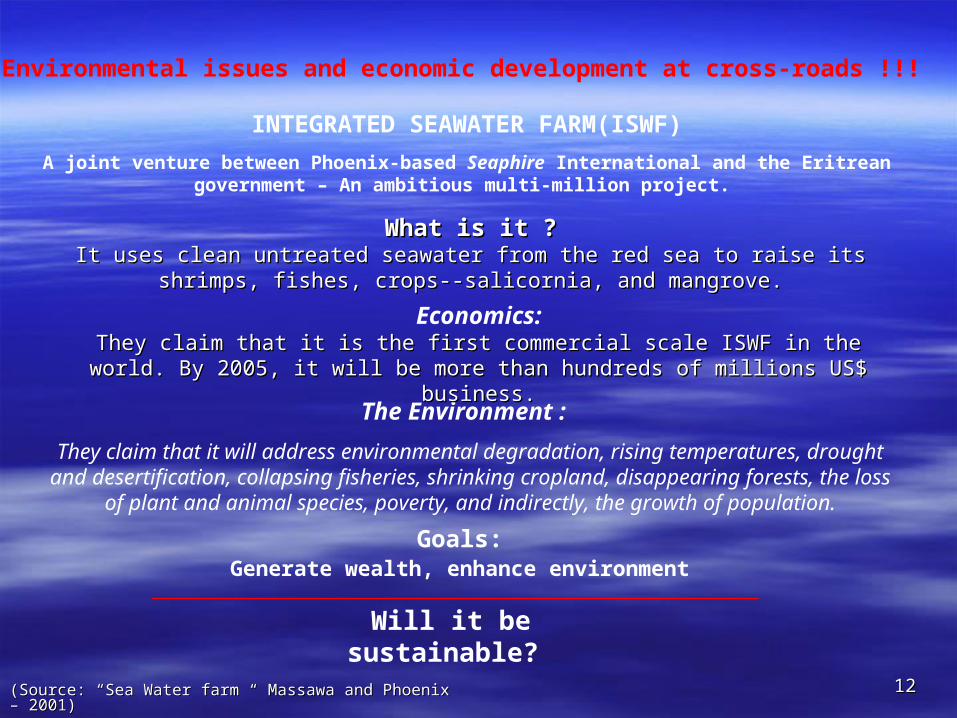
INTEGRATED SEAWATER FARM(ISWF)
A joint venture between Phoenix-based Seaphire International and the Eritrean government – An ambitious multi-million project.
The Environment :
They claim that it will address environmental degradation, rising temperatures, drought and desertification, collapsing fisheries, shrinking cropland, disappearing forests, the loss
of plant and animal species, poverty, and indirectly, the growth of population.
Economics:They claim that it is the first commercial scale ISWF in the world. By 2005, it will be more They claim that it is the first commercial scale ISWF in the world. By 2005, it will be more
than hundreds of millions US$ business.than hundreds of millions US$ business.
(Source: “Sea Water farm “ Massawa and Phoenix – 2001)(Source: “Sea Water farm “ Massawa and Phoenix – 2001)
What is it ?What is it ?It uses clean untreated seawater from the red sea to raise its shrimps, fishes, crops--It uses clean untreated seawater from the red sea to raise its shrimps, fishes, crops--
salicornia, and mangrove.salicornia, and mangrove.
Environmental issues and economic development at cross-roads !!!
Will it be sustainable?
Goals: Generate wealth, enhance environment

1313
Salicornia
(Source: “Sea Water farm “ Massawa and Phoenix – 2001)(Source: “Sea Water farm “ Massawa and Phoenix – 2001)
Shrimp PondsSea Water
Utilized & Excess
Unutilized Sea water
Excess waste water from
shrimp ponds and salicornia plant irrigation
FACTS Salicornia grows in the higher soil salinity of 40-75ppt. If >75ppt, they never grow or decrease yields.
Due to evaporation salinity might increase. If the soil salinity of salicornia cultivation lands exceed above 90ppt the cultivation lands has to be abandoned.
In the wetland, the mangrove—Avicenia, has salt excreting glands. As the salinity increases, they need more energy to eliminate the excess salts from their cells.
Possibility of eutrophication in the surrounding coastal waters, which induces plankton bloom.
Wetland -- Birds,
Mangroves…
Will it be sustainable?
Seawater Gardenparks
ISWF, cont…
Could further “Ecological Treatment” be a solution????

1414
III. CLIMATE CHANGE STUDY
1. Agro-ecological zones of Eritrea.
Source: FAO, Ministry of Agriculture 1997

1515
2. Construction of Climatic scenarios for Vulnerability Assessment2. Construction of Climatic scenarios for Vulnerability Assessment
Four of them were tested to see how close they predict the 1XCO2 against the measured meteorological data.
These Models were applied to 7 stations in Eritrea, namely,
• A. 3 stations located in the Moist Highland-above 1600m.a.s.l, • B. 2 stations located in the Arid Lowland-below 1600 m.a.s.l, & • C. 2 stations located in the Semi-Desert-100-135 m.a.s.l.
Out of the 7 stations, 5 stations ( B & C, A-2 ) gave UK89 as the best estimator, & 2 stations (A-1) CCCM as their best estimators.
Challenges encountered in construction of scenario :
– Application of GCMs--GFD3, CCCM, and GISS in high topographic variations
Source: ERITREAN National Communications, Dec. 2001.

1616
An increase of 4.1o C for doubling of CO2 over the next century has been predicted. Rainfall expected to increase slightly.
Results
UK89 was taken as the best model for vulnerability assessment. From this finding it could be argued that the UK89 model has good application in elevations lower than
1600 m.a.s.l and the CCCM higher for elevations than 1600 m.a.s.l.
Instead of using different models for different climatic zones, it was agreed to use one model -- UK89, for a country.
Source: ERITREAN National Communications, Dec. 2001.
Any Opinions ?
2. …Climatic scenarios (Cont.)2. …Climatic scenarios (Cont.)

1717
Baseline data, 1994.
Revised 1996 IPCC guideline and adopting IPCC default values.
• Inventory taken for CO2, CH4, N2O, CO and NMVOCs.
• Six sectors: energy, transport, industry, agriculture, LUCF and municipal solid waste.
• CO2 constitutes by far the greatest share of GHG, being the main source LUCF (70%) and fossil fuel combustion for energy use (28%).
3. National Inventory of Greenhouse Gases (GHG)
Source: ERITREAN National Communications, Dec. 2001.

1818
Limitations
Lack of country specific emission factors and emission ratios Lack of time series data
Uncertainties not assessed
Current Mitigation Activities:
i. Afforestation/reforestation programs ii. Enhancement of natural vegetation
3.…GHG (Conti…)
Source: ERITREAN National Communications, Dec. 2001.

1919
iii. Increasing efficiency of traditional stoves: Efficiency of traditional stoves has increased from 10% to 21%. Initial calculations suggest that CO2 reduction potential per improved stove is around 0.6 tons per year.
Current Mitigation Activities (Cont.)
- Indoor pollution substantially decreases health improvement - Less fuel wood usage – prevent soil erosion, deforestation, desertification- Etc…..
2020
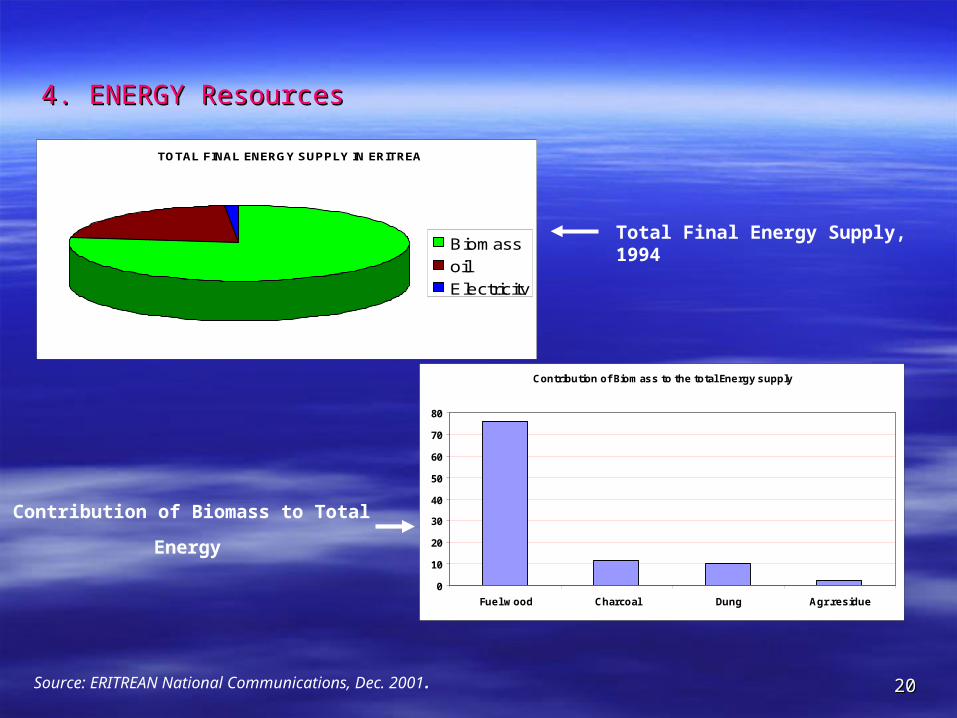
4. ENERGY Resources4. ENERGY Resources
TOTAL FINAL ENERGY SUPPLY IN ERITREA
Biomass
oil
Electricity
Contribution of Biomass to the total Energy supply
0
10
20
30
40
50
60
70
80
Fuel wood Charcoal Dung Agr.residue
Total Final Energy Supply, 1994
Contribution of Biomass to Total Energy
Source: ERITREAN National Communications, Dec. 2001.

2121
- Study and implementation of wind energy in progress.
Source: South Red Sea Wind Maps, by Robert Van Buskirk, Karina Garbesi, & Karen Rosen, 1999.
Primary source of data: From ship observations collected in the Comprehensive Ocean-Atmosphere
Data Set (COADS) available from the National Center for Atmospheric Research (NCAR).
Mean annual wind speeds in the South Red Sea from Scatterometry data:
(Red = 2 m/s, Yellow = 4 m/s, Green = 6 m/s)
Mean annual wind speeds in the South Red Sea from COADS data.
WIND ENERGY :
4. ENERGY Resources ( conti…)4. ENERGY Resources ( conti…)
2222
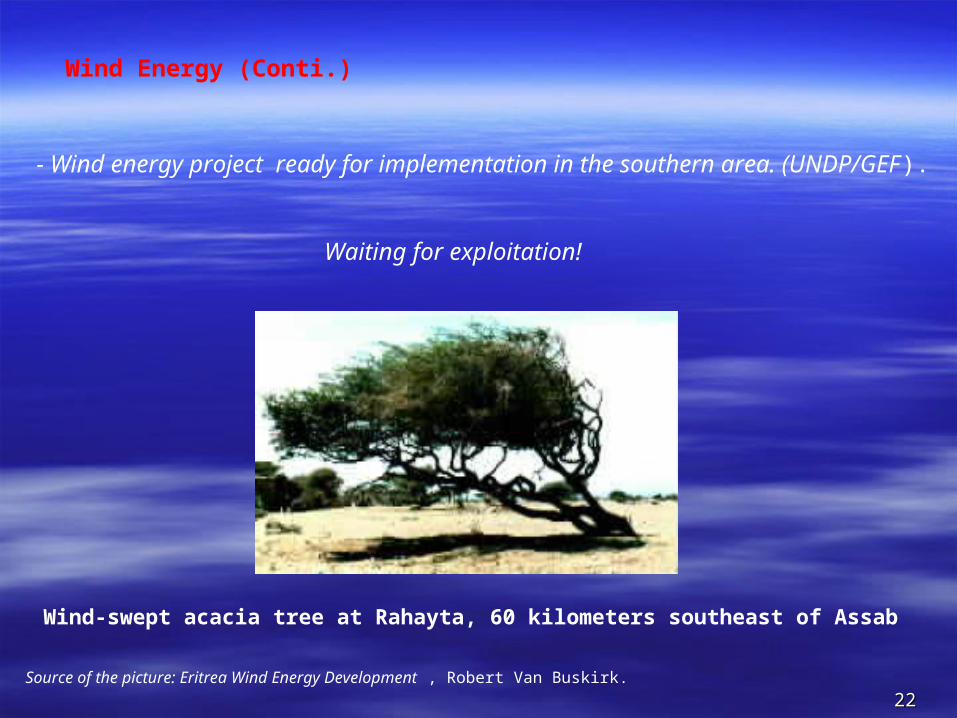
Wind Energy (Conti.)
Wind-swept acacia tree at Rahayta, 60 kilometers southeast of Assab
- Wind energy project ready for implementation in the southern area. (UNDP/GEF).
Source of the picture: Eritrea Wind Energy Development , Robert Van Buskirk.
Waiting for exploitation!
2323
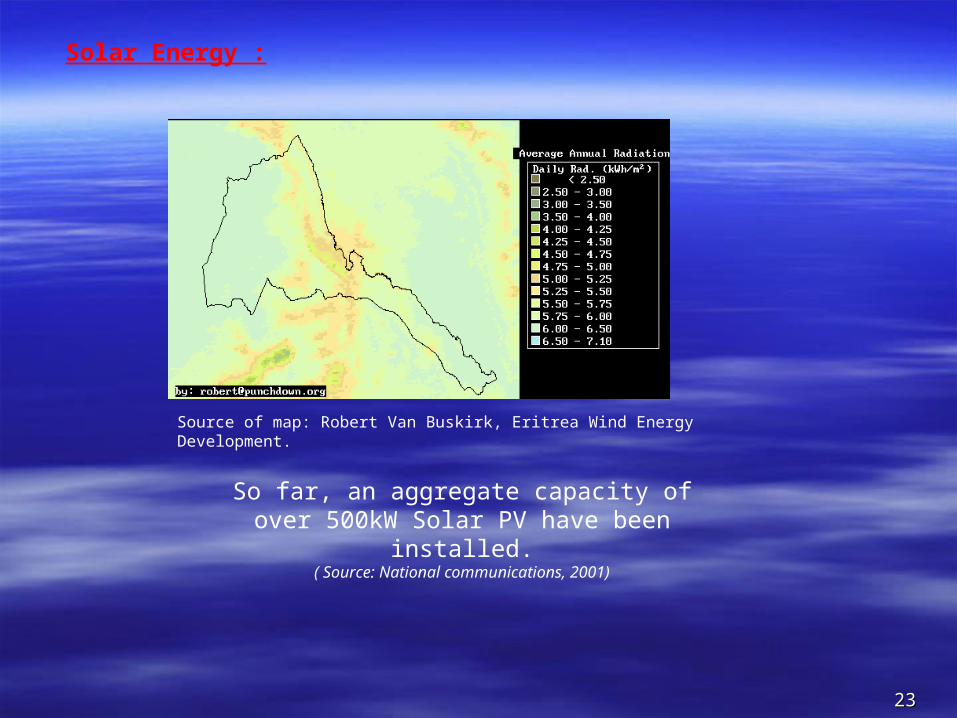
Solar Energy :
Source of map: Robert Van Buskirk, Eritrea Wind Energy Development.
So far, an aggregate capacity of over 500kW Solar PV have been installed.
( Source: National communications, 2001)

2424
Eritrea’s actual forest cover
5. V & A Assessment Studies
i. Forestry
2525
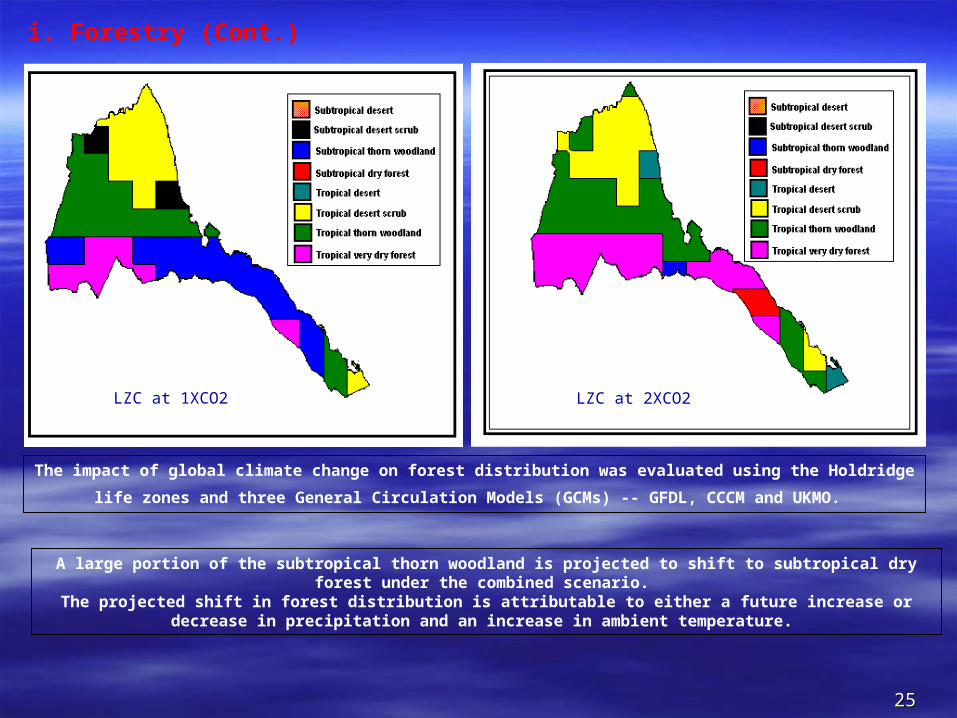
LZC at 2XCO2
The impact of global climate change on forest distribution was evaluated using the Holdridge life zones and three
General Circulation Models (GCMs) -- GFDL, CCCM and UKMO.
i. Forestry (Cont.)
A large portion of the subtropical thorn woodland is projected to shift to subtropical dry forest under the combined scenario.
The projected shift in forest distribution is attributable to either a future increase or decrease in precipitation and an increase in ambient temperature.
LZC at 1XCO2

2626
LIFE ZONE CLASSIFICATION(LZC) 1 X CO2 2 X CO2
AREA (Km2) % AREA %
Subtropical desert scrub 5600.999 4.45 0 0
Subtropical thorn wood land 54643.841 43.43 1505.285 1.20
Subtropical dry forest 0 0 4209.945 3.35
Tropical desert 191.883 0.15 5652.600 4.49
Tropical desert scrub 24808.079 19.71 28533.709 22.68
Tropical thorn wood land 26343.552 20.93 48500.636 38.56
Tropical very dry forest 14273.890 11.34 37385.824 29.72
Total 125862.244 100.01 125787.999 100
18%
8%
i. Forestry (Cont.)
A projected shift in area of potential vegetation cover from at 1X CO2 to at 2X CO2 resulted on the combined GCMs.

2727
Assumptions and Limitations:
1. According to Hordridge’s model, the bio-temperature values are set at a base temperature of 0ºC. This value is much lower than 25ºC recommended for Eritrea. This means that Holdridge’s Classification will tend to exaggerate levels of aridity under climate change scenario.
2. The Holdridge model is an abstraction of the actual vegetation pattern i.e. the classification is not based on the actual distribution of vegetation instead on some climatic factors.
3. Current global circulation models intended to develop future climate change scenarios are limited in their use for predicting possible changes in ecosystem and species distribution. This is because they have low spatial resolution i.e. their ability to reproduce reliable major climate anomalies such as El Nino and tropical storms to confidently predict inter- and intraannual rainfall distribution patterns is limited.
i. Forestry (cont.)
The results of the models have received serious reservations by concerned experts

2828
ii. Coastal Zone
PORT MASSAWA -- Located from below to up to 1.0 m a.s.l. , selected as a case study:
Results of the Analysis:
•Average increase of temperature 4.10C will result in increase of 0.5-1m.
•Loss estimated at about 257.0 million due to sea level rise.
•Could result distraction of marine biodiversity. Example: Coral reef disruption.

2929
iii. Human Health
The increase of temperature and a slight increase of precipitation is expected to cause:
An increase in spread of malaria from its present situation.
New phenomenon: Increasing incidences of malaria at altitudes close to 2000 meters, which was unusual in the past.
The empirical analysis has showed that for each increase in unit of rainfall and temperature there will be increase of malaria cases in the
country!!!
Analysis has shown of units of additional increases include diarrhea, ARI and malnutrition.
In the 2nd national communications further study is required. (ex., analysis using AnalyticaTM.)

3030
The simulated runoff decreased by 29.5 %. The Mereb-Gash basin has the most potential as an area for irrigation. Hence, a climate change effect will have a significant
influence on the agricultural activities of the country.
Mereb-Gash Discharge 2xCO2
0
0.1
0.2
0.3
0.4
0.5
0.6
0.7
1 2 3 4 5 6 7 8 9 10 11 12
Months
Dis
char
ge
(mm
/day
)
Modeled
observed
Observed and modeled runoff
after climate change
iv. Water Resources
Due to the lack of meteorological data in water discharge, unlike other sectors of 30 years (1935-1964), the water study was limited to only 11 years (1943-1953).

3131
Thank you.