1 engineering project management. 2 describe the causes of failed engineering / technology projects....
TRANSCRIPT

1
Engineering Project Management

2
Engineering Project Management
• Describe the causes of failed engineering / technology projects.
• Describe the basic competencies required of project managers.
• Describe the basic functions of project management.
• Differentiate between PERT and Gantt charts as project management tools.

3
Overview
• Describe eight activities in project management.• Define scope and a write a statement of work, to
document scope.• Use a work breakdown structure, to decompose a project
into tasks.• Estimate tasks’ durations, and specify intertask
dependencies on a PERT chart.• Assign resources to a project and produce a project
schedule with a Gantt chart.• Assign people to tasks and direct the team effort (not valid
in FYP cases).• Use critical path analysis to adjust schedule and resource
allocations in response to schedule and budget deviations.• Manage user expectations of a project and adjust project
scope.
4
What is your project management practice?
• Burn the mid night oil ?????• 24-7 in order to meet the deadline!

5
Your own experiences
•From your past experiences, such as•Your HD project•Your C++ programming project •Subject based mini-project
•Did you apply any project management skills?
•Do you think a proper project management practice is necessary?
•What is/are the most important factor(s) affecting the progress, or success of your project?

6
Theory of project management

7
Project, Project Management, and Process Management
Project – a sequence of unique, complex, and connected activities having one goal or purpose and that must be completed by specific time, within budget (and other resources), and according to specifications/requirements.Project management – the process of scoping, planning, staffing, organizing, directing, and controlling the development of an acceptable system at a minimum cost within a specified time frame.
8
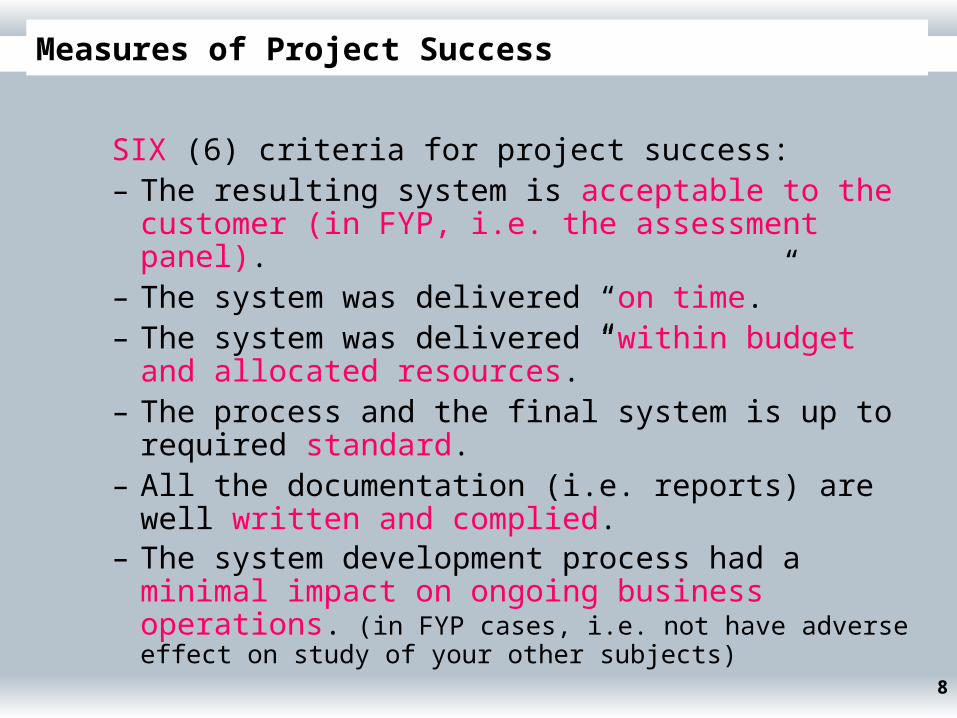
Measures of Project Success
SIX (6) criteria for project success:– The resulting system is acceptable to the customer (in FYP,
i.e. the assessment panel).– The system was delivered “on time.”– The system was delivered “within budget and allocated
resources.”– The process and the final system is up to required standard.– All the documentation (i.e. reports) are well written and
complied.– The system development process had a minimal impact on
ongoing business operations. (in FYP cases, i.e. not have adverse effect on study of your other subjects)

9
Some Common Causes of Project Failure
• Complete failure in time management / project scheduling
• Lack of commitment to the project– Depends on your expectation
• Taking shortcuts through or around the system development methodology
• Poor expectations management (unlikely in a final year project)

Some Common Causes of Project Failure
Scope creep (範疇蔓延 ) – the unexpected and gradual growth of requirements during the project.
Feature creep (功能蔓延 ) – the uncontrolled addition of technical features to a system.
• Premature commitment to a fixed budget and schedule– Are you willing to spend more than $1200?
10
11
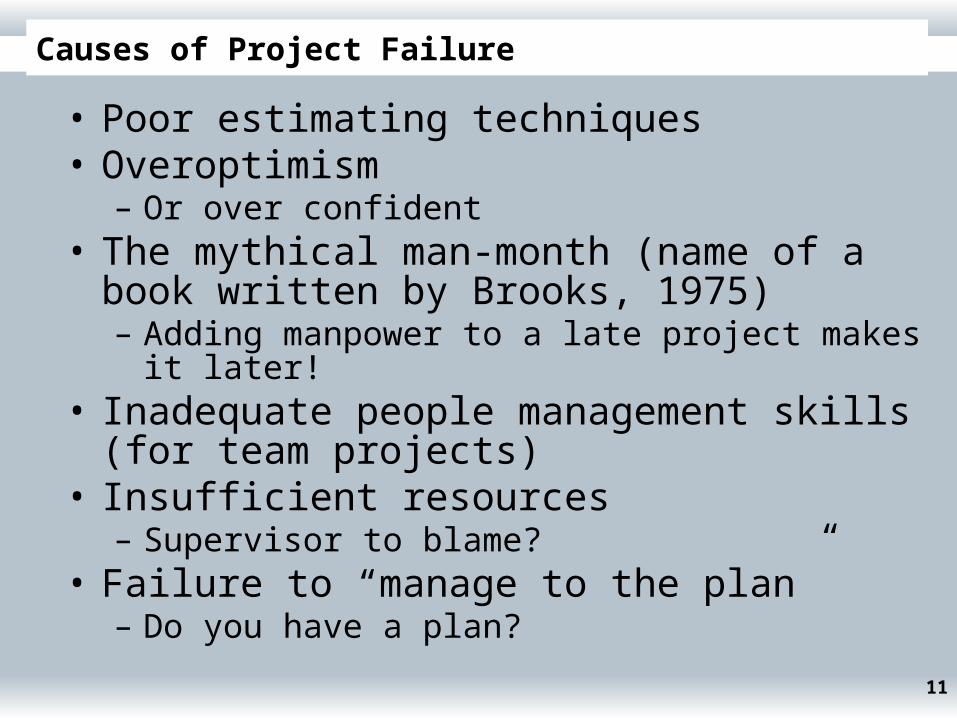
Causes of Project Failure
• Poor estimating techniques• Overoptimism
– Or over confident• The mythical man-month (name of a book written
by Brooks, 1975)– Adding manpower to a late project makes it later!
• Inadequate people management skills (for team projects)
• Insufficient resources– Supervisor to blame?
• Failure to “manage to the plan”– Do you have a plan?

Project management
• Your project should be managed by whom?
– You?– Your supervisor?– Project coordinator?
12

13
Project Management Functions
Eight (8) functions performed by every project manager:
• Scoping – setting the boundaries of the project
• Planning – identifying the tasks required to complete the project
• Estimating – identifying the resources required to complete the project
• Scheduling – developing the plan to complete the project
• Organizing – making sure members understand their roles and responsibilities
• Directing – coordinating the project
• Controlling – monitoring progress
• Closing – assessing success and failure

14
Project Management Tools & Techniques
*PERT chart (Programme Evaluation & Review Techniques) – a graphical network model used to depict the interdependencies between a project’s tasks.
*Gantt chart – a bar chart used to depict project tasks against a calendar.

15
PERT Chart

16
Gantt Chart

17
Microsoft Project Gantt Chart

18
Microsoft Project PERT Chart

Project management activities
19

20
Activity 1 – Negotiate Scope
Scope – the boundaries of a project – the areas of a business that a project may (or may not) address. Includes answers to five (5) basic questions:
– Product – Quality – Time – Cost
– *Resources - Manpower, Money, Material, Equipment, Facility, Information/Technology
Statement of work – a narrative description of the work to be performed as part of a project. Include scope statement, project definition, project overview, and document of understanding.

21
Scope of project
• Are you dare to tell your supervisor that the scope is large?
• Are you dare to tell your supervisor that the project is too difficult to handle?

22
Statement of Work
I. Purpose
II. BackgroundA. Problem, opportunity, or directive statementB. History leading to project requestC. Project goal and objectivesD. Product description
III. ScopeA. StakeholdersB. DataC. ProcessesD. Locations
IV. Project ApproachA. RouteB. Deliverables
V. Managerial / Technical ApproachA. Team building considerationsB. Manager and experienceC. Training requirements
(continued)

23
Statement of Work (concluded)
V. Managerial / Technical Approach (continued)D. Meeting schedulesE. Reporting methods and frequencyF. Conflict managementG. Scope managementH. Techniques/algorithm/methods to be used
VI. ConstraintsA. Start dateB. DeadlinesC. BudgetD. Technology
VII. Ballpark Estimates (ballpark – approximately)A. ScheduleB. Budget

24
Statement of Work
VIII.Conditions of Satisfaction (what need to be done to get the grade that you want)
A. Success criteriaB. AssumptionsC. Risks
IX. Appendices

25
Activity 2 – Identify Tasks
Work breakdown structure – a graphical tool used to depict the hierarchical decomposition of the project into phases, activities, and tasks.
Milestone – an event signifying the completion of a major project deliverable. How to get a Grade C – completing phase A
How to get a Grade B – completing phase B
How to get a Grade A – completing all phases
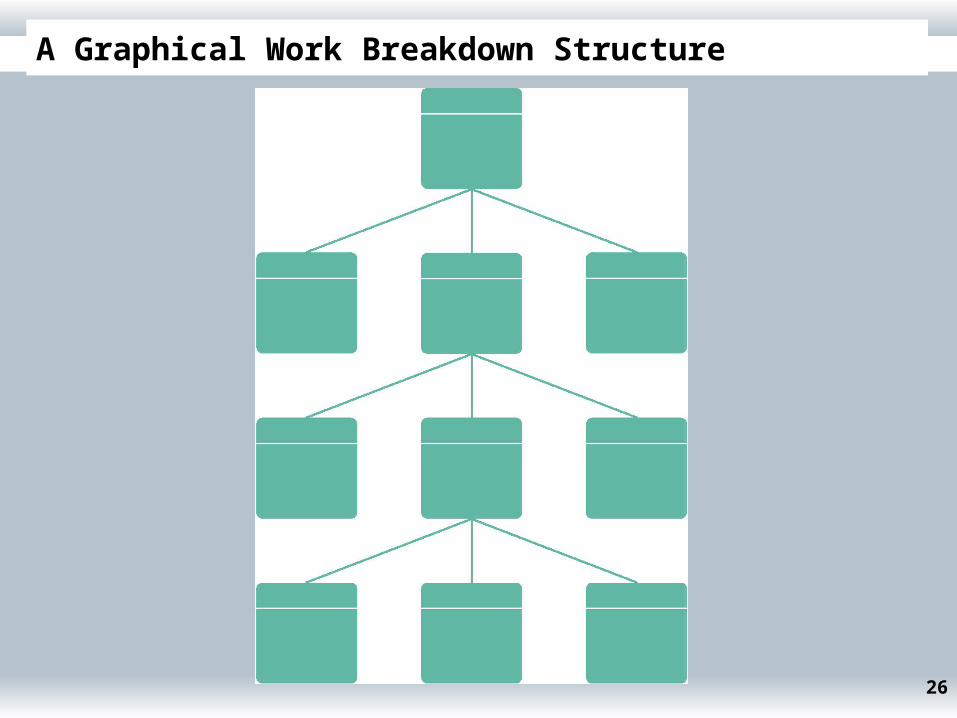
26
A Graphical Work Breakdown Structure

27
Activity 3 – Estimate Task Durations
1. Estimate the minimum amount of time it would take to perform the task – the optimistic duration (OD).
2. Estimate the maximum amount of time it would take to perform the task – the pessimistic duration (PD).
3. Estimate the expected duration (ED) that will be needed to perform the task.
4. Calculate a weighted average of the most likely duration (D) as follows:
D = (1 x OD) + (4 x ED) + (1 x PD) 6
3.33 days = (1 x 2 days) + (4 x 3 days) + (1 x 6 days) 6
PDEDOD

28
Scheduling Strategies
Forward scheduling – a project scheduling approach that establishes a project start date and then schedules forward from that date.
Reverse scheduling – a project scheduling strategy that establishes a project deadline and then schedules backward from that date.

29
Activity 5 – Assign Resources
• People – includes all the system owners, users, analysts, designers, builders, external agents, and clerical help that will be involved in the project in any way.
• Services – includes services such as a quality review that may be charged on a per use basis.
• Facilities and equipment – includes all rooms and technology that will be needed to complete the project.

30
Assign Resources
• Supplies and materials – includes everything from pencils, paper, notebooks to toner cartridges, and so on.
• Money – includes a translation of all of the above into budgeted dollars!

31
Resource Leveling
Resource leveling – a strategy for correcting resource overall allocations or unbalanced use of resources
There are two techniques for resource leveling:task delaying – when more resources are
needed than are available. Delaying task until resources are availabletask splitting – divided into sub-tasks utilize the available resources

Resource Leveling
Six (6) Resources- 1. Manpower, 2. Money, 3. Material, 4. Equipment, 5. Facility, 6. Information/Technology
32

33
Activity 6 – Direct the Team Effort
• Supervision resources– The Deadline: A Novel
about Project Management– The People Side of
Systems– The One Minute Manager– The One Minute Manager
Meets the Monkey
• Stages of Team Maturity (see figure to the right)

34
10 Hints for Project Leadership
• Be Consistent.• Provide Support.• Don’t Make Promises You Can’t Keep.• Praise in Public; Criticize in Private.• Be Aware of Morale Danger Points.• Set Realistic Deadlines.• Set Perceivable Targets.• Explain and Show, Rather Than Do.• Don’t Rely Just on [Status Reports].• Encourage a Good Team Spirit.

35
Activity 7 – Monitor and Control Progress
• Progress reporting
• Change management
• Expectations management
• Schedule adjustments—critical path analysis ( CPA)

36
Sample Outline for a Progress Report
I. Cover PageA. Project name or identificationB. Project managerC. Date or report
II. Summary of progressA. Schedule analysisB. Budget analysisC. Scope analysis (describe any changes that may have an impact on future progress)D. Process analysis (describe any problems encountered with strategy or methodology)E. Gantt progress chart(s)
III. Activity analysisA. Tasks completed since last reportB. Current tasks and deliverablesC. Short term future tasks and deliverables
(continued)

37
Sample Outline for a Progress Report (concluded)
IV. Previous problems and issuesA. Action item and statusB. New or revised action items 1. Recommendation 2. Assignment of responsibility 3. Deadline
V. New problems and issuesA. Problems (actual or anticipated)B. Issues (actual or anticipated)C. Possible solutions 1. Recommendation 2. Assignment of responsibility 3. Deadline
VI. Attachments(include relevant printouts from project management software)

38
Change Management
Change management – a formal strategy in which a process is established to facilitate changes that occur during a project.
Changes can be the result of various events and factors including:– An omission in defining initial scope– A misunderstanding of the initial scope– An external event such as government
regulations that create new requirements– Organizational changes

Changes can be the result of various events and factors including:– Availability of better technology– Shifts in planned technology that force
unexpected and significant changes to the business organization, culture, and/or processes
– Management’s desire to have the system do more than was originally requested or agreed to
– Reduced funding for the project or imposition of an earlier deadline.
39

40
• Examples– As the project progresses, the customer discovers
additional scope that they would like added to the project. The project manager accepts the new scope with the intention of “fitting it in” somewhere. Even if a log is kept that records this additional scope, the customer expectation for delivery date has not changed. They expected the product to be delivered on October 15th. Now when the due date starts getting near, the project is falling behind and either 1) misses the delivery date or 2) cuts corners in testing or other areas to make it on time.

41
Scenario 2As the project progresses, the customer discovers additional scope that they would like added to the project. The project manager and team work with the customer to fully understand what they are asking for. Additional scope WILL cost more. The customer should decide whether delivering on time is the most important factor (time-constrained project) or if the delivery date can be pushed out to accommodate the additional scope. If the project is time constrained, additional resources (or overtime cost) will be added to the project to finish more work in the same duration.

• Working together, the project team and customer do an impact analysis to identify how much additional work is really required, how much longer it will take, and how much more it will cost. Whatever the outcome, the customer expectations have been updated to reflect the NEW baseline delivery date and cost. The CCB can choose to reject the change request and continue as planned, or approve the change request and update the baseline
42

43
Change control
• In both of the scenarios above, the same scope was added. In Scenario 1, the project will be delivered late or with an unthoughtful decrease in quality or functionality. Because expectations were never updated, this project is late. In Scenario 2, the project may be delivered later than the ORIGINAL baseline, but because good change control and management of customer expectations is in place, the TRUE baseline has been updated to reflect customer choice and the reality of the project. This project is not late (at least not due to expectation problems).

44
Expectation management
• Traditional project management – time, cost, and scope– The quality is the central theme
• Modern project management – time, cost, scope and quality – Expectation is the central theme

45
Expectation management
cost time
scope
qualityexpectation
quality
time
cost
scope

46
Expectation management
• Identify a real-life example to reflect that expectation management is important
• Everyone expected minimum wage is $25 per hour and it turned to be $28. So we all very happy
• Your lecturer tells you that the exam paper is very difficult but in fact it is not as difficult as you expected and you will be very happy.
• Students expect that the prize for the mentorship quiz is one peanut but it is a pack of peanuts. So the three lucky students are very happy

47
Expectations Management
Expectations management (期望管理 ) matrix – a tool to help project managers set and monitor system’s owners and users’ expectation
The most importantThe second most important
The least important
Can have only one X in each row and each
column

48
Expectation management matrix (EMM)
• The rows correspond to the measures of success in any project: cost, schedule and scope/or quality
• The columns corresponding to priorities: first P1, second P2, third P3
• Names are assigned to priorities– Maximize or minimize (most important for a given
project)– Constrain– accept

49
Rules for EMM
• For any project, one must record a P1, a P2, and a P3 within the nine available cells
• No row may contain more than one Priority; a single measure of success must have only one priority designation
• No column may contain more than one Priority; there must be a first, second, and third priority.

50
Example
• In 1961 President JF Kennedy established the charter for a major project – land man on the moon and return him safely before the end of the decade.
• The expectation of the project is shown in the next slide

51
Lunar Project Expectations Management

52
Result of the lunar project
• Scope and requirement achieved • Cost over spent by 50%• Most people perceived the project a monumental
success• Public’s expectation – realizing the maximum safety
and minimum risk, coupled with meeting the deadline was an acceptable trade-off for the cost overrun

53
Typical, Initial Expectations for a Project

54
EMM
• If unanticipated business problems are identified – Project behind schedule– User requirements expand (change in scope)
• Schedule slippage was the ‘accept’ priority – Not a major concern
• Scope increase is the more significant problem as added requirements will increase the cost of the project
• Discuss with the project owner to adjust the priority

55
Adjusting Expectations

56
Changing Priorities

57
PERT chart
• PERT – program evaluation and review technique• PERT is a model for project management designed to
analyze and represent the tasks involved in completing a given project
• PERT is a method to analyze the involved tasks in completing a given project, especially the time needed to complete each task, and identifying the minimum time needed to complete the total project.

58
PERT chart Terminology
• A PERT event: is a point that marks the start or completion of one or more tasks. It consumes no time, and uses no resources. It marks the completion of one or more tasks, and is not “reached” until all of the activities leading to that event have been completed.
• A predecessor event: an event (or events) that immediately precedes some other event without any other events intervening. It may be the consequence of more than one activity.

59
PERT Chart
• A successor event: an event (or events) that immediately follows some other event without any other events intervening. It may be the consequence of more than one activity.
• A PERT activity: is the actual performance of a task. It consumes time, it requires resources (such as labour, materials, space, machinery), and it can be understood as representing the time, effort, and resources required to move from one event to another. A PERT activity cannot be completed until the event preceding it has occurred.

60
PERT terminology
• Optimistic time (O): the minimum possible time required to accomplish a task, assuming everything proceeds better than is normally expected
• Pessimistic time (P): the maximum possible time required to accomplish a task, assuming everything goes wrong (but excluding major catastrophes).
• Most likely time (M): the best estimate of the time required to accomplish a task, assuming everything proceeds as normal.
• Expected time (TE): the best estimate of the time required to accomplish a task, assuming everything proceeds as normal (the implication being that the expected time is the average time the task would require if the task were repeated on a number of occasions over an extended period of time).
– TE = (O + 4M + P) ÷ 6

61
PERT Terminology
• Critical Path: the longest possible continuous pathway taken from the initial event to the terminal event. It determines the total calendar time required for the project; and, therefore, any time delays along the critical path will delay the reaching of the terminal event by at least the same amount.
• Slack: the slack of an event is a measure of the excess time and resources available in achieving this event. Positive slack(+) would indicate ahead of schedule; negative slack would indicate behind schedule; and zero slack would indicate on schedule.

62
Implementing PERT
• The first step to scheduling the project is to determine the tasks that the project requires and the order in which they must be completed. The order may be easy to record for some tasks (e.g. When building a house, the land must be graded before the foundation can be laid) while difficult for others (There are two areas that need to be graded, but there are only enough bulldozers to do one). Additionally, the time estimates usually reflect the normal, non-rushed time. Many times, the time required to execute the task can be reduced for an additional cost or a reduction in the quality.

63
Example
Activity
Predecessor Time estimates Expected time
Opt. (a) Normal (m)
Pess. (p)
A 2 4 6 4
B 3 5 9 5.33
C A 4 5 7 5.17
D A 4 6 10 6.33
E B,C 4 5 7 5.17
F D 3 4 8 4.5
G E 3 5 8 5.17

64
PERT chart
start
F
D
C
B E
G End
A

65
Network diagram
• A network diagram starts with a node “start”• The “Start” node has a duration of zero • Then you draw each activity that does not have a predecessor
activity and connect them with an arrow from start to each node (a, b).
• Next, since both c and d list a as a predecessor activity, their nodes are drawn with arrows coming from a. Activity e is listed with b and c as predecessor activities, so node e is drawn with arrows coming from both b and c, signifying that e cannot begin until both b and c have been completed.
• Activity f has d as a predecessor activity, so an arrow is drawn connecting the activities. Likewise, an arrow is drawn from e to g. Since there are no activities that come after f or g, it is recommended (but again not required) to connect them to a node labeled finish.

66
Network diagram
The activity name The normal duration time The early start time (ES) The early finish time (EF) The late start time (LS) The late finish time (LF) The slack

67
Network diagram
• In order to determine this information it is assumed that the activities and normal duration times are given. The first step is to determine the ES and EF. The ES is defined as the maximum EF of all predecessor activities, unless the activity in question is the first activity, for which the ES is zero (0). The EF is the ES plus the task duration (EF = ES + duration).
• The ES of the “End” is the expected duration of the project

68
Network diagram
• To determine the LF, needs to move backward• The LF is defined as the minimum LS of all successor
activities, unless the activity is the last activity, for which the LF equals the EF. The LS is the LF minus the task duration (LS = LF - duration).

69
Critical path
• The critical path is the path that takes the longest to complete.
• To determine the path times, add the task durations for all available paths.
• Activities that have slack can be delayed without changing the overall time of the project. Slack is computed in one of two ways, slack = LF - EF or slack = LS - ES. Activities that are on the critical path have a slack of zero (0).
• In the example, critical path is ACEG• Activities not included in the critical path can be delayed
without affecting the duration of the project

70
Network diagram

71
Critical Path Analysis

72
Activities that have a slack
• Activity b has an LF of 9.17 and an EF of 5.33, so the slack is 3.84 work days.
• Activity d has an LF of 15.01 and an EF of 10.33, so the slack is 4.68 work days.
• Activity f has an LF of 19.51 and an EF of 14.83, so the slack is 4.68 work days.

73
Exercise
• Identify the critical path• Determine the earliest completion time • Is it possible to reduce the duration of the
project by reducing the duration of activity C

74
Exercise
Activity Duration (weeks) precedence
A 2 -
B 3 A
C 3 B
D 7 B
E 6 B
F 2 C, D
G 5 D, E
H 4 F, G
I 8 H
J 2 H, I

75
Activity 8 – Assess Project Results and Experiences
• Did the final product meet or exceed user (supervisor’s) expectations?– Why or why not?
• Did the project come in on schedule?– Why or why not?
• Did the project come in under budget? – Why or why not?

76
Conclusion
• Output α input– Output (your grade) – Input (your effort)
• Who is/are the stakeholder of the project? • Time Vs yourself • Do not over estimate your abilities – always reserve
more time for your project!!!!!