1 emotions in goats: mapping physiological, behavioural
TRANSCRIPT

1
Emotions in goats: mapping physiological, behavioural and vocal 1
profiles 2
3
4
5
Elodie F. Briefer 1,2, Federico Tettamanti 1,3 and Alan G. McElligott 1 6
1 Queen Mary University of London, Biological and Experimental Psychology Group, 7
School of Biological and Chemical Sciences 8
2 Present Address: Institute of Agricultural Sciences, ETH Zürich, Universitätstrasse 2, 8092 9
Zürich, Switzerland 10
3 Present Address: Department of Science for Nature and Environmental Resources, 11
University of Sassari, Sassari, Italy 12
13
14
Corresponding authors: 15
EFB; Email: [email protected]; Tel: +41 (0)44 632 84 55; Address: Institute of 16
Agricultural Sciences, ETH Zürich, Universitätstrasse 2, 8092 Zürich, Switzerland 17
AGM; Email: [email protected]; Tel: + 44 (0)20 7882 6682; Address: Biological 18
and Experimental Psychology, School of Biological and Chemical Sciences, Queen Mary 19
University of London, Mile End Road, London, E1 4NS, UK 20
21
22

2
Abstract 23
24
Emotions are important because they enable the selection of appropriate behavioural 25
decisions in response to external or internal events. Techniques for understanding and 26
assessing animal emotions, and particularly positive ones, are lacking. Emotions can be 27
characterized by two dimensions; their arousal (bodily excitation), and their valence 28
(negative or positive). Both dimensions can affect emotions in different ways. It is thus 29
crucial to assess their effects on biological parameters simultaneously, so that accurate 30
indicators of arousal and valence can be identified. In order to find convenient and non-31
invasive tools to assess emotions in goats (Capra hircus), we measured goat physiological, 32
behavioural and vocal responses in four situations: 1) control situation (no external 33
stimulus, neutral); 2) anticipation of a food reward (positive); 3) food-related frustration 34
(negative); 4) isolation away from conspecifics (negative). These situations were 35
characterised by different levels of arousal, assessed a posteriori by heart rates measured 36
during the tests. We found several clear, reliable indicators of arousal and valence. During 37
situations of higher arousal, goats had lower heart-rate variability (RMSSD) and higher 38
respiration rates. They displayed more head movements, moved more, had their ears 39
pointed more often forward and less often on the side (horizontal), and produced more 40
calls. They also produced calls with higher fundamental frequencies and higher energy 41
distribution. In positive situations, goats had their ears less often orientated backward 42
and spent more time with their tails up than in negative situations. Furthermore, they 43
produced calls in which the fundamental frequencies were less variable. Our methods for 44
assessing the effects of emotional arousal and valence on biological parameters could lead 45
to more effective monitoring and understanding of animal emotions, as well as to a 46
better understanding of the evolution of emotions through cross-species comparisons. 47
48
Keywords. Acoustic communication, arousal, Capra hircus, positive emotions, ungulates, 49
valence, vocal analysis50

3
INTRODUCTION 51
52
Although the existence of animal emotions has been suggested since Darwin (1872), 53
techniques for understanding and assessing these affective states, and particularly 54
positive ones, are still lacking. The discovery of clear emotional indicators is crucial for 55
many disciplines, including animal behaviour, neuroscience, psychopharmacology and 56
animal welfare (Mendl, Burman, & Paul, 2010). Emotions are composed of four 57
components: neurophysiological, behavioural, cognitive and subjective (Keltner & Lerner, 58
2010). While there is evidence for a subjective, conscious component of emotions only in 59
humans, the other components can potentially be used as indicators in non-human 60
animals (Mendl et al., 2010). 61
Unlike the “discrete emotion approach”, which suggests the existence of a small 62
number of fundamental emotions, the “dimensional approach” proposes to characterize 63
emotions according to their two main dimensions: arousal (bodily activation or excitation; 64
e.g. calm versus excited) and valence (negative or positive; e.g. sad versus happy; 65
Russell 1980). This approach is very promising for the study of animal emotions (Mendl 66
et al., 2010). Its recent use has allowed substantial progress to be made in identifying 67
animal behavioural (e.g. pigs, Sus scrofa, Imfeld-Mueller, Van Wezemael, Stauffacher, 68
Gygax, & Hillmann, 2011; review, Murphy, Nordquist, & van der Staay, 2014; sheep, 69
Ovis aries, Reefmann, Bütikofer Kaszàs, Wechsler, & Gygax, 2009a), physiological (e.g. 70
hens, Gallus domesticus, Davies, Radford, & Nicol, 2014; sheep, Reefmann, Bütikofer 71
Kaszàs, Wechsler, & Gygax, 2009b) and cognitive indicators of emotional arousal and 72
valence (goats, Briefer & McElligott, 2013; rats, Rattus norvegicus, Burman, Parker, Paul, 73
& Mendl, 2008; review, Mendl, Burman, Parker, & Paul, 2009). In addition, the 74
relationship between an individual’s inner state and the vocalisations it produces suggests 75
that vocalisations are promising indicators of emotions (Briefer, 2012; Manteuffel, Puppe, 76
& Schön, 2004). 77
Indicators of animal emotional arousal have been extensively studied in negative 78
situations (e.g. stress, fear in farm animals, Forkman, Boissy, Meunier-Salaün, Canali, & 79

4
Jones, 2007). Conversely, studies of arousal indicators during situations of positive 80
valence are rare. Indicators that could allow us to differentiate between negative and 81
positive situations (i.e. valence indicators) have also been poorly studied. Finding 82
indicators of valence requires comparing animals that are exposed to negative versus 83
positive situations. Yet, changes in parameter values between neutral and negative 84
situations are often easier to detect than between neutral and positive situations, 85
because negative emotions often trigger higher arousal levels than positive ones (Boissy 86
et al., 2007). Another concern regarding research on indicators of emotions is that very 87
few studies have investigated both arousal and valence in a given species (but see 88
Gogoleva et al., 2010; Soltis, Blowers, & Savage, 2011). Additionally, the emotional 89
situations that are used often differ in both dimensions simultaneously, or may differ in 90
more than simply the emotions they trigger (e.g. comparing the effect of pain as a 91
negative situation versus food reward as a positive one). This results in confusion about 92
which dimension affects the measured parameters. More precise arousal indicators could 93
assist in identifying and thus minimizing stress during negative situations, while more 94
accurate valence indicators could allow us to distinguish between negative and positive 95
situations. This would then lead to enhanced animal wellbeing by promoting situations 96
that trigger positive emotions (Boissy et al., 2007). 97
In this study, we investigated indicators of both emotional arousal and valence in 98
domestic goats. Goats are highly social and vocal animals that in the wild (feral goats) live 99
in complex fission-fusion societies (Stanley & Dunbar, 2013). This species should benefit 100
from behavioural or vocal expression of emotions, as a mean to regulate social 101
interactions within groups (Panksepp, 2009). Goats have good cognitive abilities, such as 102
perspective taking (Kaminski, Call, & Tomasello, 2006) and conspecific gaze following 103
(Kaminski, Riedel, Call, & Tomasello, 2005). They have the ability to use indirect 104
information (i.e., the absence of food; Nawroth, von Borell, & Langbein, 2014b) and 105
human pointing and touching cues (Nawroth, von Borell, & Langbein, 2014a) to find a 106
reward. They also have good visual discrimination learning abilities (Langbein, Nürnberg, 107
& Manteuffel, 2004) and long-term memory (Briefer, Haque, Baciadonna, & McElligott, 108

5
2014; Briefer, Padilla de la Torre, & McElligott, 2012). The most common goat 109
vocalisation is the contact call, which is used to maintain contact at relatively close 110
distance (Briefer & McElligott, 2011a). Goats produce two kinds of contact calls: closed-111
mouth contact calls and open-mouth contact calls (Ruiz-Miranda, Szymanski, & Ingals, 112
1993). Contact calls contain information about individuality (Briefer & McElligott, 2011a), 113
age, sex and body size (Briefer & McElligott, 2011b), kinship and even group 114
membership of the producer (Briefer & McElligott, 2012). Playback experiments have 115
shown that these vocalisations allow mothers and kids to recognize each other from at 116
least one week postpartum (Briefer & McElligott, 2011a), and that mother goats 117
remember the calls of their kids for up to one year after separation (Briefer et al., 2012). 118
Goat behaviour and vocalisations have been shown to be affected by the degree of social 119
isolation (complete or partial), suggesting the existence of indicators of negative arousal 120
(Siebert, Langbein, Schön, Tuchscherer, & Puppe, 2011). In terms of potential indicators 121
of valence, goat patterns of behaviour, sympathetic reactions and brain activity have 122
been shown to differ between positive and negative situations (i.e. different valence; 123
Gygax, Reefmann, Wolf, & Langbein, 2013). In this study, we assessed physiological, 124
behavioural and vocal profiles linked to both arousal and valence, by testing which 125
dimension was most responsible for changes in the measured parameters. 126
We combined new frameworks recently adapted from humans to animals to 127
analyse vocalisations (source-filter theory; Taylor and Reby 2010), and emotions (Mendl 128
et al., 2010), in order to find non-invasive indicators of emotions in goats. We placed goats 129
in four situations likely to induce different emotional arousal and valence: control 130
(neutral), anticipation of food reward (positive), food frustration (negative) and social 131
isolation (negative). Physiological stress (nonspecific response of the body to any 132
demand made upon it), and thus heart rate, increases with arousal, whether the situation 133
is positive or negative (Seyle, 1976). For this reason, we assessed the arousal triggered 134
by our experimental emotional situations by comparing the heart rates of goats in 135
response to the tests. In the absence of well-established valence indicators in the 136
literature, we inferred the valence of our situations based on knowledge of the function of 137

6
emotions and on goat behaviour. We tested the hypothesis that emotional arousal and 138
valence in goats are indicated by particular physiological, behavioural and vocal profiles. 139
For instance, we expected physiological parameters linked to the autonomic nervous 140
system (e.g. heart rate and respiration rate) to be affected by arousal, while behavioural 141
and vocal parameters could indicate both dimensions (Briefer, 2012; Imfeld-Mueller et 142
al., 2011; Reefmann, Wechsler, & Gygax, 2009). We defined the parameters that 143
changed according to increased arousal levels as reliable indicators of arousal. Similarly, 144
we defined the parameters that changed consistently from negative to positive valence 145
as reliable indicators of valence. 146
147

7
METHODS 148
149
Subject and Management Conditions 150
151
The study was carried out at a goat sanctuary (Buttercups Sanctuary for Goats, 152
http://www.buttercups.org.uk), Kent (UK). We tested 22 adult goats (11 females and 11 153
castrated males), which were fully habituated to human presence and could be led 154
around using a lead rope (Baciadonna, McElligott, & Briefer, 2013; Briefer & McElligott, 155
2013), between May and June 2011. They were aged 3-17 years and of various breeds 156
(Table 1). They had been at the sanctuary for at least 2 years (range = 2-11 years). Five 157
of these goats (three females and two males) had been rescued and brought to the 158
sanctuary because of poor welfare conditions (three goats) or because they had been 159
found abandoned (two goats). These five goats had been at the sanctuary for at least 4 160
years in 2011. The other goats had been housed in good conditions and were brought to 161
the sanctuary because their owners could not keep them anymore. 162
All goats at our study site are released into a large field during the day. At night, 163
they are kept indoors in individual or shared pens (2 or 3 goats, average size = 3.5 m2) 164
with straw bedding, within a larger stable complex. Routine care of the animals is 165
provided by sanctuary employees and volunteers. Goats have ad libitum access to hay, 166
grass (during the day) and water, and are also fed with a commercial concentrate in 167
quantities according to their state and age. Every stable is cleaned on a daily basis. All 168
goats are inspected each day by the sanctuary employees and volunteers, and are 169
checked regularly by a vet and given medication when appropriate. 170
171
Situations inducing Emotional States 172
173
We designed three brief situations (≤ 5 min) of various arousal and valence, which were 174
likely to elicit vocalisations by the goats (anticipation of food reward (positive), food 175
frustration (negative) and social isolation (negative)). In addition, these situations were 176

8
compared to a neutral, control situation. To avoid stress linked to isolation, goats were 177
tested in familiar pairs (identical during the whole experiment) during the control, 178
anticipation of food reward and food frustration situations, but not during the isolation 179
situation. When tested in a pair, the two goats were located in adjacent pens. They could 180
thus hear and see each other, but not physically interact. 181
We introduce the experimental situations here and give more details about the 182
procedure in the next section (Experimental Procedure). i) During the control situation, 183
goats were left unmanipulated in a pen with hay (“Control”). This situation did not elicit 184
any calls, but allowed us to obtain baseline values for physiological and behavioral data. 185
ii) The positive situation was the anticipation of an attractive food reward that the goats 186
had been trained to receive during three days of habituation (“Feeding”). iii) After goats 187
had been tested with the Feeding situation, they were tested with a food frustration 188
situation. This consisted of giving food to only one of the goats in the pair and not to the 189
subject (“Frustration”). iv) The second negative situation was brief isolation, out of sight 190
from conspecifics behind a hedge. For this situation, goats were tested alone and not in a 191
pair (“Isolation”). 192
193
Determination of Arousal Levels and Valence of the Situations 194
195
The relative level of activity of the autonomic nervous system is determined to a great 196
extent by current emotions (von Borell et al., 2007). Heart rate is a well-recognized 197
indicator of physiological stress (e.g. Forkman et al., 2007), which is linked to emotional 198
arousal during situations of both positive and negative valence (Seyle, 1976). Therefore, 199
to determine arousal levels, we assessed between-situation differences in heart rate. By 200
contrast, no clearly established indicator of emotional valence exists for goats or related 201
mammals in the literature, because studies that have investigated both emotional 202
arousal and valence simultaneously (in order to highlight clear indicators of valence that 203
are not influenced by arousal) are rare. The valence of our situation was thus inferred 204
from knowledge of the function of emotions and of goat behaviour. 205

9
Positive emotions result from encounters with rewarding stimuli that enhance 206
fitness. They trigger approach behaviour towards the reward (Mendl et al., 2010). 207
Negative emotions result from encounters with punishing stimuli that threaten fitness, 208
and they trigger avoidance behaviour (Mendl et al., 2010). Accordingly, situations that 209
involve a stimulus that can enhance fitness (e.g. food reward) and that an animal would 210
want to approach can be assumed to be positive. By contrast, situations that involve a 211
stimulus that somehow threaten fitness and that an animal would try to avoid can be 212
assumed to be negative. 213
The Control situation was assumed to be neutral. There is some evidence 214
suggesting that appetitive-anticipation of a reward induces positive emotional states (e.g. 215
satisfaction/contentment; Boissy et al., 2007; Moe et al., 2009; Spruijt, van den Bos, & 216
Pijlman, 2001). We thus assumed the Feeding (anticipation of food reward) situation as 217
positive for goats, because this situation would enhance fitness through the acquisition of 218
a food reward. However, failure to obtain expected food is likely to lead to a high-arousal 219
negative state (Mendl et al., 2010; Rolls, 2005). The Frustration situation was therefore 220
considered negative for the goats, because this situation would (in the wild at least) 221
threaten fitness through the lack of food intake. Finally, isolation (even during a short 222
period) for social herd-living animals such as goats, can be stressful (Price & Thos, 1980; 223
Siebert et al., 2011). Consequently, we considered the Isolation situation to be also 224
negative for goats, because it could potentially threaten fitness through greater exposure 225
to predators. 226
227
Technique used for Data Collection 228
229
We collected physiological data using a small wireless non-invasive monitor, fixed to a 230
belt placed around the goat’s chest (MLE120X BioHarness Telemetry System, Zephyr). 231
For detailed behavioural analyses, all tests were video recorded using a Sony DCR-SX50E 232
camcorder. Finally, vocalisations were continuously recorded during the tests at distances 233
of 3-5 m from the vocalising animal using a Sennheiser MKH-70 directional microphone 234

10
(frequency response 50 – 20.000 Hz; max SPL 124 dB at 1 kHz), connected to a Marantz 235
PMD-660 numeric recorder (sampling rate: 44.1 kHz). 236
237
Experimental Procedure 238
239
During the Control, Feeding and Frustration situations, goat pairs were tested in two 240
indoor adjacent pens, 3 m2 each, within a familiar larger stable complex. During the 241
Isolation situation, they were tested individually in a 3.4 m2 and 2.10 m high outdoor pen 242
made of gaited hurdles, in a familiar field (usual daytime range) out of sight from other 243
goats. To minimize stress linked to novelty, the emotional tests were preceded by three 244
days of habituation. During these three days, goats were gradually habituated to the set-245
up, to the measurement equipment (i.e. wireless non-invasive monitor) and to the 246
Feeding and Isolation situations (both repeated once per day, during the three 247
habituation days). They were not habituated to the Control situation (everyday 248
situation), nor to the Frustration situation, in order to ensure that food was always 249
expected during the Feeding situation. Goats were then tested over three days with one 250
test per day (i.e. Feeding, Frustration and Isolation situations). 251
i) The Control situation (no habituation) was carried out on two consecutive days. 252
On each of these two days, we placed the pair of goats in adjacent pens for 5 min, with 253
hay in the feeders, and left them undisturbed. ii) For the Feeding situation, each pair of 254
goats was placed in the indoor pens for 5 min pre-test with hay in the feeders. At the end 255
of the 5 min pre-test, during the first habituation day, an experimenter (same person 256
throughout the experiment) presented two buckets with food (commercial concentrate 257
for goats with fresh chestnut tree leaves) simultaneously to the two goats for 1 min, 258
before giving them the food. During the second and third habituation days, and during 259
the test day, the hay was removed for 2 min before the food presentation, in order to 260
increase food motivation. Then, the experimenter presented the food simultaneously to 261
the two goats for 20 s, walked outside the stable complex for 1 min, and walked back 262
towards the goats while shaking the food bucket to make it obvious, and presented the 263
11
food again for 20 s. Then, he walked away a second time for 1 min, walked back and 264
gave them the food. This allowed us to obtain three events (before the first and second 265
20 s presentation and before giving them food), when the experimenter approached the 266
goats with food, resulting in the production of vocalisations. iii) The Frustration situation 267
(no habituation) started in the same way as the Feeding situation, with 5 min pre-test 268
(with hay), followed by 2 min during which the hay had been removed. Then, the 269
experimenter presented the food buckets (similar buckets and food as during the Feeding 270
situation) during 20 s simultaneously to the two goats and gave food to only one of the 271
goats in the pair, while the subject did not receive food. This lasted for 4 min, after which 272
the experimenter also gave food to the subject. iv) To habituate the goats to the 273
Isolation situation, goats were placed in pairs during the first two habituation days, in 274
two identical and adjacent pens, out of sight of the other goats, for 5 min. On the last 275
habituation day, the adjacent pen was removed and each goat was placed in the test pen 276
alone. During the test day, the Isolation situation started with 5 min pre-test, during 277
which the subject was placed in the indoor pen used for the other situations, with hay 278
and with the paired goat in the adjacent pen. This allowed the subject to settle down 279
after it was equipped with the heart-rate monitor. Then, the subject was placed alone in 280
the outdoor isolation pen and left there for 5 min. At the end of the 5 min, it was 281
returned to the other goats. 282
The 22 goats were tested in every situation (repeated measure design). During 283
habituation days, goats were placed in both the Feeding and Isolation situations each day 284
in a random order. During the three test days (one test per day), the order of the 285
emotional situations was pseudo-random. The only constraint was that, for each 286
individual, the Feeding situation always preceded Frustration situation (1-6 days before), 287
in order to ensure a positive state during the Feeding situation. Within a pair, both goats 288
were tested with the Control and Feeding situations at the same time. This prevented 289
food frustration if one of the goats was not simultaneously tested. They were tested with 290
the two other tests (Frustration and Isolation) on different days for each goat in the pair. 291
The Control situation was carried out on different days as the emotional situations. 292

12
293
Response Measures 294
295
Physiological measures 296
We measured heart rate and respiration rate, which are likely to be affected by emotions 297
(Reefmann et al., 2009b; von Borell et al., 2007), and are part of the of the stress 298
response of the Sympatho-Adreno-Medullary axis (SAM; i.e. neuronal or “fight-or-flight” 299
response), as opposed to the stress response of the second main stress axis, the 300
Hypothalamo–Pituitary-Adrenocortical axis (HPA; i.e. humoral response). Because 301
vocalisations are affected by the autonomic nervous system (ANS; Scherer, 1986, 2003), 302
vocal parameters are more likely to be correlated with the SAM response indicators than 303
the HPA response indicators (e.g. cortisol), at least over short time scales (Schrader & 304
Todt, 1998). Before the beginning of the experiment, we quickly clipped a small patch of 305
hair below the heart-rate monitor, in order to improve the contact between the 306
electrodes and the body. Goats were equipped with the monitor before each situation, on 307
both the habituation and test days. This technology was also removed immediately after 308
each test. ECG gel was applied on the parts of the belt containing the electrodes before 309
each use. The data (continuous ECG trace and breathing wave, i.e. inhalation/exhalation 310
cycle) were then transmitted and stored in real time to a laptop using LabChart software 311
v.7.2 (ADInstrument) for later analyses. During the tests, one experimenter, who was 312
concealed in a pen close to the subjects, quietly recorded comments into the software 313
indicating important events (e.g. when the other experimenter was presenting food to 314
the goats, leaving or coming back during Feeding situation, or when the paired goat was 315
given food and finished eating during the Frustration experiment). This allowed us to 316
measure physiological parameters at the exact times when these events occurred. 317
When possible (i.e. good quality signal; clearly visible heart beats on the ECG 318
trace and respiration on the breathing wave), we analysed data for each situation over 319
three 10 s sections, in which the software could track the heart beats (ECG trace) and 320
the inspiration–exhalation cycles (breathing wave) accurately (Reefmann, Wechsler, et 321

13
al., 2009: mean ± SD for each section: Control, 10.03 ± 0.03 s; Feeding, 9.26 ± 0.19 s; 322
Frustration, 9.83 ± 0.10 s; Isolation, 9.69 ± 0.14 s). For the Control situation, the three 323
sections were collected at the beginning, middle and end of the time starting 1 min after 324
the tested pair of goats was placed in the adjacent pens with hay in the feeder. This 325
allowed the goats to settle down before we started data collection. For the Feeding 326
situation, the first section corresponded to the time just before the first food 327
presentation, the second section to the time when the experimenter came back with the 328
food for the first time (i.e. after opening the door to enter the stable complex), and the 329
third section to the time when the experimenter came back with the food for the second 330
time (i.e. after opening the door to enter the stable complex and just before giving the 331
food). The data were thus collected only when the subject could hear/see the 332
experimenter coming towards them with food, and was likely to be experiencing a 333
positive state. This also ensured that our data would reflect an anticipatory state, as 334
opposed to a consummatory state while feeding or a post-consummatory state after 335
feeding, which are likely to be of different arousal (Spruijt et al., 2001). For the 336
Frustration situation, the three sections were collected at the beginning, middle and end 337
of the time starting when the other goat in the pair received food, until this goat finished 338
eating. This ensured that the data were collected while the subject could see and hear 339
the paired goat eating. The subject was thus likely to be experiencing a negative state of 340
frustration throughout data collection. By contrast, the situation in which both goats were 341
not eating (after the pair goat finished) or the situation in which the subject was itself 342
eating are likely to trigger different arousal and valence and were thus not considered for 343
analyses. Finally for the Isolation situation, the three sections were collected at the 344
beginning, middle and end of the time starting 1 min after the subject was placed in the 345
isolation pen, until the end of the Isolation situation 4 min later (isolation duration = 5 346
min). This allowed the goat to settle in the isolation pen and to be likely to be 347
experiencing a negative state of isolation, before we started data collection. 348
From the ECG trace and breathing wave, we analysed the following parameters: 349
heart rate, heart-rate variability (root mean square of successive R-R interval difference, 350

14
“RMSSD”) and respiration rate. The heart-rate (beats/min) and respiration-rate 351
(breaths/s) averages were obtained automatically from the software. Individual inter-352
heart-beat (RR) intervals (ms) were also extracted, in order to calculate RMSSD (ms). 353
354
Behavioural measures 355
For a similar reason than for the physiological parameters (i.e. to measure parameters 356
during well-defined positive/negative emotional state), for the Feeding situation, we 357
analysed the behaviour of the goats during the two events when the experimenter came 358
back from outside the stable complex towards the goats with food (i.e. when the goats 359
could see the experimenter bringing them food; mean total time scored per goat ± SD = 360
29.55 ± 5.54 s). For the Frustration situation, we analysed the behaviour during the time 361
starting when the other goat in the pair received food, until this goat finished eating (i.e. 362
when the goats could see or hear the other goat eating; mean total time scored per goat 363
± SD = 176.50 ± 35.91 s). For the Isolation and Control situation, we analysed the 364
behaviour during the last 4 min of the test (i.e. 1 min after the subject was placed in the 365
test pen; time scored per goat per test = 240 s). 366
We scored behavioural parameters that could potentially be affected by emotions 367
(Boissy et al., 2011; Reefmann, Bütikofer Kaszàs, et al., 2009a; Reefmann, Wechsler, et 368
al., 2009). The following parameters were scored using CowLog 1.1 (open source 369
software for coding behaviours from digital videos; Hänninen & Pastell, 2009); the time 370
spent with the tail raised (i.e. tail raised above the perpendicular to the backbone), the 371
duration of locomotion (defined as at least two legs moving), the number of rapid head 372
movements (i.e. < 1 s in duration), and the number of calls produced. We also scored 373
the time spent with the ears orientated forward (tip of the ear pointing forward), 374
backwards (tip of the ear pointing backward), horizontal (perpendicular to the headrump 375
axis), or asymmetrical (right and left ears in different positions, such as one pointing 376
forward and the other one horizontal or backwards; Boissy et al., 2011; Reefmann, 377
Bütikofer Kaszàs, et al., 2009a). 378
15
We calculated the rate of occurrence (per minute) for the number of rapid head 379
movements and for the number of calls, and the proportion of the total time spent 380
performing the behaviour, for the other behaviours (Table 2). Therefore, the difference in 381
duration between the various situations was taken into consideration. When the head, 382
ears or tail were not easily observable because of the position of the camera or goat in 383
the pen, the proportion of behaviour was calculated over the time during which we were 384
able to score the behaviour accurately, instead of the total time. On two occasions, it was 385
not possible to score the position of the ears and the head movements (one goat during 386
the Feeding situation) or the position of the tail (one goat during the Feeding situation). 387
Therefore, sample sizes differ slightly between parameters (see sample sizes in Table 3). 388
389
Vocal measures 390
Vocalisations were imported into a computer at a sampling rate of 44.1 kHz and saved in 391
WAV format at 16-bit amplitude resolution. We used Praat v.5.3.41 DSP Package 392
(Boersma & Weenink, 2009) and Seewave (Sueur, Aubin, & Simonis, 2008) for 393
subsequent analyses. Calls were visualised on spectrograms in Praat (FFT method, 394
window length = 0.03 s, time steps = 1000, frequency steps = 250, Gaussian window 395
shape, dynamic range = 60 dB). We selected all good quality calls recorded during each 396
situation (total = 180 calls; 40 for Feeding, 80 for Frustration and 60 for Isolation; 8.18 397
± 7.76 calls per goat; range = 0 (3 goats) – 30; Table 1). Because calls were produced 398
intermittently by the goats (unlike physiological and behavioural data that could be 399
acquired continuously), we used a more opportunistic approach in order to obtain 400
adequate sample sizes of vocalisations. During the Feeding situation, we analysed calls 401
produced between the time when the experimenter approached the goats for the first 402
time with the food, until they were rewarded. During the Frustration situation, we 403
analysed calls produced between the time when the other goat received food and the 404
time preceding the return of the experimenter toward the subject to give it food. During 405
the Isolation situation, we analysed all the calls produced while the subject was in the 406
isolation pen. Calls were never produced in bouts. Because consecutive calls produced in 407

16
bouts are more likely to be homogeneous, we therefore avoided pseudoreplication (Reby, 408
Cargnelutti, & Hewison, 1999). 409
According to the source-filter theory of voice production (Fant, 1960), mammal 410
vocalisations are generated by vibrations of the vocal folds (source, determining the 411
fundamental frequency, “F0”), and are subsequently filtered by the supralaryngeal vocal 412
tract (filter, producing amplified frequencies called “formants”, Titze, 1994; Taylor and 413
Reby, 2010). We extracted source- and filter-related vocal parameters as well as 414
intensity and duration measures using a custom built program in Praat. This program 415
batch processed the analyses and exporting of output data (Charlton, Zhihe, & Snyder, 416
2009a; Reby & McComb, 2003). The vocal parameters measured are listed in Table 2 and 417
the analyses are detailed in the Appendix. 418
The settings for the analyses were adapted from Briefer & McElligott (2011a). 419
Goat contact calls vary between individuals, particularly at the level of F0-related 420
parameters, formant-related parameters and energy quartiles (see Table 2 for 421
definitions; Briefer & McElligott, 2011a). Therefore, the most appropriate settings to 422
accurately detect F0 (i.e. pitch floor and pitch ceiling) and formants (i.e. maximum 423
number of formants and maximum formant value; see Appendix for details) with Praat 424
differed between individuals. In order to prevent biases linked to the settings used for 425
the analyses, the same settings were used for all calls (i.e. produced during all 426
situations) of a given individual. We included 13 vocal parameters in our analyses. Some 427
parameters (formants) could not be measured in every call, resulting in a small 428
proportion of missing values. Therefore, the sample size (number of calls) differs 429
between the vocal parameters (see sample size in Table 5). 430
431
Statistical Analysis 432
433
First, in order to investigate which physiological, behavioural or vocal parameters would 434
be more useful as indicators of emotions (as opposed to which ones were correlated and 435
therefore redundant), we tested for potential correlations between the mean parameter 436

17
values for each individual using Spearman's rank correlation. Then, to test for differences 437
in heart rate between situations and determine arousal levels, we carried out a linear 438
mixed effects model (LMM; lmer function, lme4 library; Pinheiro & Bates, 2000) in R 439
3.0.2 (R Development Core Team, 2013). This model included heart rate as a response 440
variable, and the sex and age of the goats as fixed factors to control for their effects. The 441
situation (Control, Feeding, Frustration and Isolation) was included as a fixed factor. 442
Finally, the breed, and identity of the goats nested within the test pair were included as 443
crossed random factors, in order to control for repeated measurements of the same 444
subjects, for the impact of the goats within a pair on each other, and for breed 445
differences (Table 1). Then, two-by-two comparisons between the four emotional 446
situations were carried out using LMMs including the same control, fixed and random 447
factors. We applied a Bonferroni correction at α = 0.017 (0.05/3 comparisons) for these 448
post-hoc tests. Based on these results, we ranked the situations according to the heart 449
rate values they triggered; we attributed the highest arousal level to the situation 450
triggering the highest heart rate and the lowest arousal level to the one triggering the 451
lowest heart rate. Situations that did not differ in heart rate were considered to be of the 452
same arousal level. 453
We ran further models to test the effects of arousal and valence on the other 454
physiological, behavioural and vocal parameters measured (Table 2). Separate LMMs 455
were set up for each parameter. All of these models included the parameter as a 456
response variable and the same control and random factors as listed above for heart rate 457
(sex and age of the goats as fixed factors; breed, and identity of the goats nested within 458
the test pair, as crossed random factors). The proportion of time spent moving 459
(Locomotion) was also included as a fixed factor for the physiological parameters, to 460
control for its effect. The extent of mouth opening influences the resonant properties of 461
the vocal tract (Titze, 1994). Several vocal parameters thus differ between closed- and 462
open-mouth calls (Sèbe, Duboscq, Aubin, Ligout, & Poindron, 2010). For this reason, we 463
added the type of call (open-mouth, closed-mouth or mixed, referring to calls containing 464
both open-mouth and closed-mouth parts) as a fixed factor in the models carried out on 465

18
the vocal parameters to control for the potential differences between call types (see 466
Appendix Table A1 for the results of the control factors). 467
Because arousal levels and valence were correlated (Spearman's rank correlation: 468
r = 0.15, p = 0.006), they were not included as factors in the same models. Instead, we 469
first ran one set of models with arousal level (1-2; see Results, Determination of Arousal 470
Levels using Heart Rate) as a fixed effect and another set with valence (Control situation 471
= 0; Feeding = +1; Frustration and Isolation situations = -1) as a fixed effect. Then, for 472
each parameter that was significantly affected by both arousal and valence, we used a 473
model selection procedure based on the Akaike’s information criterion adjusted for small 474
sample size (AICC) to identify which of arousal or valence best explained the parameter 475
(Burnham & Anderson, 2002). We used AICC instead of AIC, because AICC converges to 476
AIC as sample size increases and should be used by default (Symonds & Moussalli, 477
2011). When the difference between the AICC values of two models (ΔAICC) is less than 2 478
units, both models have support and can be considered competitive. Models with ΔAICC 479
ranging from 3 to 7 have considerably less support by the data, and models with ΔAICC > 480
10 are poorly supported. Akaike weights (ωi) indicate the probability that a particular 481
model has more or less support from the data among those included in the set of 482
candidate models (Burnham & Anderson, 2002; Burnham, Anderson, & Huyvaert, 2011). 483
To test for further differences between the Frustration and Isolation situations, 484
which were both assumed to be of negative valence, we carried out further LMMs. We 485
included in these models (one for each parameter) the same control and random factors 486
as mentioned above (sex and age of the goats, Locomotion (physiology only) and call 487
type (vocalisations only) as fixed factors; breed, and identity of the goats nested within 488
the test pair as crossed random factors, and the situation (Frustration and Isolation) as a 489
fixed factor (see Appendix Table A1 for these results)). 490
The residuals were checked graphically for normal distributions and 491
homoscedasticity. To satisfy assumptions, we used log transformations for RMSSD, 492
ResRate, F0mean, F0end, F0range, FMextent, AMextend, Q50%, Q75% (see Table 2 for 493
abbreviations). Some of the behavioural parameters measured in proportions were logit-494

19
transformed (EarsForward, HeadMov, and Locomotion). These log- and logit-transformed 495
physiological, behavioural and vocal parameters were then entered into models fitted 496
with Gaussian family distribution and identity link function. None of the other behavioural 497
parameters (see Table 2) met statistical assumptions despite logit transformation. They 498
were thus transformed to binomial data (behaviour occurs = 1; does not occur = 0), and 499
entered into generalised linear mixed models, fitted with binomial family distribution and 500
logit link function (glmer function, lme4 library). For each model, we assessed the 501
statistical significance of the factors by comparing the model with and without the factor 502
included using likelihood-ratio tests (LRT). To this aim, and in order to compare models 503
with AICC, all models were fitted with maximum likelihood estimation. The significance 504
level was set at α = 0.05. All means are given with standard deviations. 505
506
Ethics 507
508
Animal care and all experimental procedures were in accordance with the ASAB/ABS 509
Guidelines for the Use of Animals in Research (Guidelines for the Use of Animals, 2014). 510
The research plan was reviewed by the UK Government Home Office inspector for Queen 511
Mary, University of London. All measurements were non-invasive, and the negative 512
situations (Frustration and Isolation) lasted not more than 5 min each. The stress levels 513
of the goats were monitored throughout the tests (ECG trace and breathing wave were 514
transmitted and displayed, in real time on the laptop) to ensure that subjects did not 515
become overly stressed, in which case the test would be halted and the subject would 516
not be tested anymore. However, this did not happen and none of the goats had to be 517
removed from the experiments. 518
519

20
RESULTS 520
521
Determination of Arousal Levels using Heart Rate 522
523
The analysis of heart rate as a function of the emotional situations revealed two arousal 524
levels (1 and 2; Fig. 1). Heart rate differed according to the situation (LMM: X2 = 53.03, 525
df = 3, p < 0.0001), with the lowest value occurring during the Control situation. These 526
heart rates were not different from those obtained for the Isolation situation (Control vs 527
Isolation; LMM: X2 = 0.68, df = 1, p = 0.41). Therefore, we attributed an arousal level of 528
1 (lowest) to the Control and Isolation situations. The heart rates measured during the 529
Isolation situation were significantly lower than those measured during the Frustration 530
situation (Isolation vs Frustration; LMM: X2 = 12.24, df = 1, p = 0.0005). Finally, the 531
rates for the Frustration situation were not significantly different from those obtained for 532
the Feeding situation, after Bonferroni correction (Frustration vs Feeding; LMM: X2 = 533
4.36, df = 1, p = 0.037; Bonferroni, α = 0.017). Frustration and Feeding situations thus 534
received an arousal level of 2. To summarize, the arousal levels based on heart rate were 535
1 for the Control and Isolation situations (mean ± SD = 108.75 ± 15.38 beats/min) and 536
2 for the Frustration and Feeding situations (mean ± SD = 123.00 ± 23.52 beats/min). 537
538
Physiological Responses 539
540
Correlation analyses between the mean physiological parameters of each goat showed no 541
associations between RMSSD and RespRate (Spearman's rank correlation: r = -0.09, n = 542
22 goats, p = 0.69). The models investigating the link between physiological parameters 543
and emotional arousal and valence of the situations revealed that the two measured 544
parameters (RMSSD and RespRate) were influenced by arousal and not by valence (Table 545
3; Appendix Table A2). RMSSD decreased and RespRate increased with arousal (Table 3). 546
To summarise, RMSSD and RespRate were good indicators of arousal, as they were 547
clearly more affected by arousal levels than valence. During higher arousal situations, 548

21
goats had lower heart-rate variability (RMSSD) and higher respiration rates. There were 549
no clear physiological indicators of valence. 550
551
Behavioural Responses 552
553
Correlation analyses between the mean behavioural parameters of each goat showed 554
several associations between most of the ear positions (EarsForw, EarsHoriz and 555
EarsAsym) and some of the other behavioural parameters (HeadMov, Locomotion and 556
TailUp; Table 2). EarsBack was only correlated with other ear position parameters 557
(EarsForw and EarsAsym). Finally, the number of calls per minute (Calls) was not 558
correlated with any of the other behavioural parameters. 559
The analyses of behavioural parameters in relation to the emotional arousal and 560
valence of the situations revealed that all measured parameters were affected by arousal 561
(Table 3; Appendix Table A2). HeadMov, Locomotion, EarsForw, Calls and TailUp 562
increased with arousal, while EarsHoriz, EarsBack and EarsAsym decreased. Four of the 563
parameters were also affected by valence (HeadMov, EarsBack, EarsAsym and TailUp; 564
Table 3; Appendix Table A2). EarsBack decreased and TailUp increased from negative to 565
positive valence. HeadMov and EarsAsym were not affected consistently by valence 566
(level: HeadMov, - > 0 < +; EarsAsym, - < 0 > +). AICC comparison revealed that the 567
variation in HeadMov was better explained by arousal (100% chance to be the best 568
model) than valence, while variation in EarsBack and EarsAsym was better explained by 569
valence (100% and 99% chance respectively to be the best model) than arousal. For 570
TailUp, the ΔAICC was 5.13, indicating that the model including valence had considerably 571
more support by the data than the model including arousal. The model including valence 572
had 93% chance to be the best model (chance level = 50%; Table 4). 573
To summarise, HeadMov, Locomotion, EarsForw, EarsHoriz and Calls were good 574
indicators of arousal, as they were clearly more affected by arousal levels than valence. 575
During high arousal situations, goats displayed more head movements, moved more, had 576
their ears pointed more often forward and less often to the side (horizontal) and 577

22
produced more calls. By contrast, EarsBack and TailUp were good indicators of valence, 578
as they changed consistently from negative to positive valence (unlike EarsAsym), and 579
were more affected by valence levels than arousal (ΔAICC > 5). In positive situations, as 580
opposed to negative ones, goats had their ears orientated backward less often and spent 581
more time with the tail up. 582
583
Vocal Responses 584
585
Correlation analyses between the mean vocal parameters of each goat showed several 586
associations between most of the F0-related parameters (F0mean, F0end, F0range and 587
FMextent; Table 2). Some of these F0-related parameters (F0mean and F0end) were also 588
correlated with energy quartiles (Q25%, Q50%, and Q75%), which were all correlated to 589
each other. AMextent was only correlated with F0mean. F1mean was correlated with 590
F2mean. Finally, F2mean, F3mean and F4mean were all related to each other. 591
Our analyses of vocal parameters as a function of the arousal levels and valence 592
of the situations revealed six parameters that were influence by arousal (Table 5; 593
Appendix Table A2). F0mean and F0end (which characterise F0 contour over time), as 594
well as Q25%, Q50%, and Q75% increased with arousal, while F1mean decreased. 595
F4Mean also tended to increase, but the effect of arousal on this parameter was only 596
marginally significant (p = 0.055). Two parameters were influence by valence (Table 5; 597
Appendix Table A2). F0range and FMextent (which characterise F0 variation within the 598
call), all decreased from negative to positive valence. The other parameters were neither 599
affected by arousal, nor by valence (Table 5). 600
To summarize, F0mean, F0End, Q25%, Q50%, Q75% and F1Mean were good 601
indicators of arousal, as they were clearly more affected by arousal than valence. With an 602
increase in arousal, goats produced calls with higher F0 and higher energy distribution 603
(i.e. energy quartiles). Furthermore, the first formant frequency decreased, while the 604
fourth formant tended to increase. By contrast, F0range and FMextent were good 605
indicators of valence, as they were clearly more affected by valence than arousal. In 606

23
positive situations, as opposed to negative ones, goats produced calls with a lower 607
fundamental frequency range and smaller frequency modulations (i.e. calls with less 608
frequency variations; Fig. 2 and Audio A1). 609
610

24
DISCUSSION 611
612
We investigated changes in physiological, behavioural and vocal parameters between 613
situations potentially triggering different arousal and valence, in order to identify non-614
invasive indicators of emotions in goats. We found physiological, behavioural and vocal 615
indicators of arousal. All these parameters changed consistently with increasing arousal 616
and were clearly more affected by arousal than valence. We also found behavioural and 617
vocal indicators of valence that changed consistently from negative to positive valence, 618
and were clearly more affected by valence than arousal. Arousal indicators could help to 619
identify and therefore minimize stress during negative situations. By contrast, valence 620
indicators could help to differentiate between negative and positive situations, in order to 621
reduce negative emotions and increase positive ones. In particular, the behavioural 622
indicators that we found are relatively easy to observe. The potential to more effectively 623
monitor animal emotions (and therefore also moods) is critical to our overall 624
understanding of animal behaviour and wellbeing in general (Boissy et al., 2007; Mendl 625
et al., 2010; Nettle & Bateson, 2012), as well as our understanding of the evolution of 626
emotions. 627
628
Physiological Indicators 629
630
We used heart rates in this study to determine arousal levels triggered by the various 631
situations. We found that this parameter was higher during the food frustration and 632
anticipation of food reward situations than during the isolation and control situations. 633
Isolation in social species normally induces high stress levels and an increase in heart 634
rates (e.g. in ungulates; cattle, Bos taurus, Boissy & Le Neindre, 1997; sheep, 635
Reefmann, Wechsler, et al., 2009; goats, Aschwanden, Gygax, Wechsler, & Keil, 2008). 636
Therefore, it is surprising that our social isolation situation induced heart-rate values that 637
were similar to the control situation. Our tests were preceded by three days of 638
habituation, in order to minimize stress linked to novelty. Goats seemed to decrease 639

25
stress-related behaviours over the days of habituation (EFB, personal observation), 640
suggesting that they could have fully habituated to the isolation situation after three 641
days. This differs from Siebert et al. (2011), which did not find clear evidence for 642
habituation to repeated isolation sessions in the behavioural and vocal responses of 643
goats. This could be due to the much longer isolation sessions used by Siebert et al. 644
(2011; 30 min) compared to ours (5 min). 645
The physiological measures that we collected (heart rate, heart-rate variability 646
and respiration rate) are involved in the sympathomedullary pathway axis (SAM) stress 647
response, which prepares the animal to react to a stressor (Cannon, 1929; Seyle 1976). 648
Stress has been defined as a nonspecific response of the body to any demand made upon 649
it, whether positive or negative (Seyle, 1976). An increase in both negative and positive 650
arousal is thus normally accompanied by (among other parameter changes), an increase 651
in heart rate (used in our study to determine the levels of arousal triggered by the 652
various situations), and an increase in respiration rate (von Holst, 1998). Accordingly, we 653
found that respiration rate increased with increasing arousal (heart rate), independently 654
of the valence of the situation. 655
Heart rate represents the interaction between sympathetic (increases heart rate) 656
and vagal (reduces heart rate) regulation. By contrast, heart rate variability mainly 657
depends on vagal influences and thus indicates when the vagal branch of the autonomic 658
nervous system is activated (von Borell et al., 2007). This parameter increases (i.e. more 659
variable heart rate due to an increase in successive R-R interval difference) when the 660
parasympathetic system is activated. In our study, heart rate variability (RMSSD; root 661
mean square of successive R-R interval difference) increased with decreasing arousal 662
levels (heart rate), indicating that the parasympathetic system was activated during our 663
low arousal situations. According to our criterion, RMSSD was thus also an accurate 664
indicator of arousal. Our two physiological parameters (RespRate and RMSSD) were not 665
correlated and therefore are both good, independent indicators of arousal. 666
We did not find any good physiological indicator of valence. High vagal tone and 667
vagal activation have been suggested to indicate efficient autonomic regulatory activity 668

26
and be associated with positive emotions, thus implying that RMSSD could be a good 669
indicator of valence, notably in pigs (Zebunke, Langbein, Manteuffel, & Puppe, 2011) and 670
sheep (Reefmann, Wechsler, et al., 2009). However, these studies did not control for the 671
effect of arousal, as they compared situations of opposite valence, but also of different 672
arousal (e.g. grooming as positive versus isolation as negative). In our study, RMSSD 673
was not influenced by valence, despite controlling for the degree of movement 674
(Locomotion). Similarly, Gygax et al. (2013) did not find any difference in RMSSD 675
between two situations of different valence and likely similar arousal in goats. We 676
suggest that heart rate variability, in a similar manner to most physiological parameters, 677
is affected by arousal more than valence and thus constitutes an indicator of arousal. 678
679
Behavioural Indicators 680
681
The stress response prepares an animal to be more alert and vigilant, and to behave 682
appropriately when faced with a stressor (e.g. Cannon, 1929). When the stimulus 683
triggering the change in arousal enhances fitness (e.g. food reward), the animal should 684
approach it, whereas when the stimulus threatens fitness (e.g. predator), the animal 685
should avoid it (e.g. flight; Mendl et al., 2010). Accordingly, in our study, goats displayed 686
more head movements and moved more during high arousal than low arousal situations, 687
independently of the valence. Similarly, in Siebert et al. (2011), goat locomotion 688
increased with arousal between complete isolation and partial isolation (supposedly 689
higher arousal than complete isolation, because of the permanent sensory feedback from 690
adjacent pen mates). In our study, goats also had their ears pointed forward more often 691
and less often to the side (horizontal), which could indicate vigilance. Call rate generally 692
increases with arousal in most species (Briefer, 2012). Accordingly, our results showed 693
an increase in the number of calls per minute (Calls) with arousal, independently of 694
valence (i.e. in both negative and positive situations). 695
We identified two promising behavioural indicators of valence. Goats had their 696
ears orientated backward less often and spent more time with the tail up in positive 697

27
situations compared to negative ones. Ear and tail positions were also suggested as 698
indicators of emotions notably in sheep (Boissy et al., 2011; Reefmann, Bütikofer Kaszàs, 699
et al., 2009a; Reefmann, Wechsler, et al., 2009), and pigs (Reimert, Bolhuis, Kemp, & 700
Rodenburg, 2013). Reefmann, Bütikofer Kaszàs, et al. (2009) and Reefmann, Wechsler, 701
et al. (2009a) showed that horizontal ears are associated with positive situations in 702
sheep. However, in these studies, some of the positive situations (e.g. feeding on fresh 703
hay or grooming) and negative situations (e.g. separation from group members) might 704
have differed also in arousal levels. In a similar manner to our study, pigs in negative 705
situations (anticipation of aversive situation) had their tails more often in a low position 706
and ears more often backward than positive situations (anticipation of a rewarding 707
situation; Reimert et al., 2013). By contrast, sheep tails were held up during separation 708
from group members (negative), but not during rumination (intermediate) or when 709
feeding on fresh hay (positive; Reefmann, Bütikofer Kaszàs, et al., 2009a). Alternative 710
techniques for measuring ear and tail movements (e.g. non-invasive electromyography 711
measuring ear and tail muscle activity) could help to obtain more precise results and 712
allow accurate cross-species comparisons. Because ear position in our study was 713
correlated with other behavioural parameters and clearly indicated both arousal 714
(EarsForward and EarsHorizontal) and valence (EarsBackward), we suggest that the 715
observation of ear positions is a promising tool to assess emotions. 716
717
Vocal Indicators 718
719
We found that parameters describing F0-contour (source-related parameters; F0mean, 720
and F0End) increased with arousal levels. This could have resulted from an increase in 721
the tension of the vocal folds after contraction of the cricothyroid muscles, or from 722
stronger sub-glottal air pressure (Fant, 1960; Titze, 1994). We also found that higher 723
arousal levels were characterized by higher energy quartiles (Q25%, Q50%, Q75%). 724
Filter-related parameters (i.e. formants and the energy distribution) mostly depend on 725
the shape and length of the vocal tract, and can be modified by laryngeal retraction (e.g. 726

28
goats, dogs Canis familiaris, pigs and cotton-top tamarins Sagunius oedipus; Fitch, 2000; 727
fallow deer Dama dama; McElligott et al., 2006). Mammals could also potentially 728
constrict their pharynx (i.e. increase the tension of vocal tract walls), which results in a 729
shift in energy distribution towards higher frequencies, but this phenomenon has, until 730
now, only been studied in humans (Scherer, 1986) and birds (Riede, Beckers, Blevins, & 731
Suthers, 2004). The shift in the energy distribution towards higher frequencies that we 732
observed could thus be caused by a less pronounced retraction of the larynx or/and an 733
increase in pharyngeal constriction with an increase in arousal. Although the energy 734
distribution mainly depends on the filter process, our correlations between vocal 735
parameters showed that this parameter was correlated with F0 (and therefore with its 736
harmonics). As a result, the increase in energy quartiles with arousal could also have 737
been a side effect of the increase in F0. Similar increases in F0 and energy quartiles with 738
arousal are commonly found in humans (Scherer, 2003), other mammals (Altenmüller, 739
Schmidt, & Zimmermann, 2013; Briefer, 2012; Lingle, Wyman, Kotrba, Teichroeb, & 740
Romanow, 2012), and even birds (zebra finch, Taeniopygia guttata, Perez et al., 2012), 741
suggesting highly conserved vocal indicators of arousal throughout evolution. 742
Surprisingly, the increase in energy quartiles with arousal was only accompanied 743
by a marginally significant increase in the fourth formant (F4; p = 0.055). By contrast, 744
the first formant (F1) decreased. These discrepancies were confirmed by a lack of 745
correlation between energy quartiles and formants. Higher formants (e.g. F3, F3) depend 746
mainly on the length of the vocal tract (Fant, 1960; Fitch & Hauser, 1995), while lower 747
formants (e.g. F1, F2) depend more on the shape of the vocal tract. Our results could be 748
explained by a less pronounced retraction of the larynx, which shortens the vocal tract 749
and induces a higher F4, with an increase in arousal (Fant, 1960; Titze, 1994). The 750
decrease in F1 might require more subtle changes in the configuration of the pharyngeal 751
regions and oral and nasal cavities, and opening of the mouth. Indeed, mouth 752
opening/closing and lip protrusion/retraction or lip rounding/spreading can also be used 753
to modify formant frequencies, at least in primates (Hauser, Evans, & Marler, 1993; 754
Hauser & Ybarra, 1994; Riede, Bronson, Hatzikirou, & Zuberbühler, 2005). However, this 755

29
suggestion requires further analysis of goat behaviour while vocalizing (Riede et al., 756
2005). Several of our vocal parameters indicating arousal (F0mean, F0End, Q25-Q75% 757
and F1Mean) were correlated with each other. Energy quartiles (Q25-Q75%) are easier 758
to measure than F0 or formants and could constitute ideal indicators of arousal in goats 759
and maybe other ungulates as well. 760
We found that during positive situations, goats produced calls with lower 761
fundamental frequency range (F0range), as well as smaller frequency modulations 762
(FMextent) than during negative situations. The fundamental frequency thus presented 763
less variation during positive than negative emotions. These measures characterising F0 764
variation (F0Range and FMextent) were correlated. F0Range was more clearly affected by 765
valence than FMextent. This parameter, which is also easier to measure than FMextent, 766
could thus be selected as a clear valence indicator in goats. A decrease in F0range from 767
negative to positive situations has also been observed in humans (Hammerschmidt & 768
Jürgens, 2007), and elephants (Loxodonta africana, Soltis et al., 2011). Similarly, lower 769
variation in F0 (cumulative variation of F0) in positive than in negative situation has been 770
found in dogs (Taylor, Reby, & McComb, 2009). During positive emotions, it thus seems 771
that vocal folds vibrate at a more stable rate than in negative emotions, resulting in more 772
stable F0 over time. However, very few studies have been carried out on vocal indicators 773
of valence and it is thus difficult to make general conclusions on the evolution of vocal 774
correlates of valence. 775
776
Conclusion 777
By merging recent frameworks developed to measure animal vocalisations (source-filter 778
theory; Taylor and Reby 2010) and emotions (Mendl et al., 2010), we have identified 779
several non-invasive, promising indicators of arousal and valence. These physiological, 780
behavioural and vocal indicators could be very useful to differentiate situations eliciting 781
negative emotions from those eliciting positive ones, in order to promote the 782
implementation of positive animal states (Boissy et al., 2007). Further experiments 783
validating these indicators using different emotional situations (e.g. partial versus total 784

30
isolation; Siebert et al., 2011), could allow us to determine the extent to which these 785
indicators can be used across contexts. We believe that our approach, which 786
simultaneously measures the effects of emotional arousal and valence, could lead to 787
more accurate monitoring of animal emotions and a more comprehensive understanding 788
of the evolution of emotions. 789
790
Acknowledgments 791
792
We are grateful to Luigi Baciadonna, Livio Favaro and two anonymous reviewers for 793
helpful comments on the manuscript, and Lorenz Gygax for advice. We are very grateful 794
to Switzerland for funding this study in the UK. This was achieved through a Swiss 795
Federal Veterinary Office grant (Project No. 2.11.03) to Alan G. McElligott and Elodie F. 796
Briefer, and a Swiss National Science Foundation fellowship to Elodie F. Briefer. We thank 797
Bob Hitch, Natalie Comfort and all the volunteers of Buttercups Sanctuary for Goats 798
(http://www.buttercups.org.uk) for their help and free access to the animals. 799
800

31
References 801
Altenmüller, E., Schmidt, S., & Zimmermann, E. (2013 Evolution of Emotional 802 Communication: From sound From Sounds in Nonhuman Mammals to Speech and 803 Music in Man. Oxford, UK: Oxford University Press. 804
Aschwanden, J., Gygax, L., Wechsler, B., & Keil, N. M. (2008). Cardiac activity in dairy 805 goats whilst feeding side-by-side at two different distances and during social 806 separation. Physiology & Behavior, 95, 641–648. 807
Baciadonna, L., McElligott, A. G., & Briefer, E. F. (2013). Goats favour personal over 808 social information in an experimental foraging task. PeerJ, 1, e172. 809
Boersma, P., & Weenink, D. (2009). Praat: doing phonetics by computer. Retrieved from 810 http://www.praat.org/ 811
Boissy, A., Aubert, A., Désiré, L., Greiveldinger, L., Delval, E., & Veissier, I. (2011). 812 Cognitive sciences to relate ear postures to emotions in sheep. Animal Welfare, 20, 813 47–56. 814
Boissy, A., & Le Neindre, P. (1997). Behavioral, cardiac and cortisol responses to brief 815 peer separation and reunion in cattle. Physiology & Behavior, 61, 693–699. 816
Boissy, A., Manteuffel, G., Jensen, M. B., Moe, R. O., Spruijt, B., Keeling, L. J., et al. 817 (2007). Assessment of positive emotions in animals to improve their welfare. 818 Physiology & Behavior, 92, 375–397. 819
Briefer, E. F. (2012). Vocal expression of emotions in mammals: mechanisms of 820 production and evidence. Journal of Zoology, 288, 1–20. 821
Briefer, E. F., Haque, S., Baciadonna, L., & McElligott, A. (2014). Goats excel at learning 822 and remembering a highly novel cognitive task. Frontiers in Zoology, 11, 20. 823
Briefer, E., & McElligott, A. G. (2011a). Mutual mother–offspring vocal recognition in an 824 ungulate hider species (Capra hircus). Animal Cognition, 14, 585–598. 825
Briefer, E., & McElligott, A. G. (2011b). Indicators of age, body size and sex in goat kid 826 calls revealed using the source-filter theory. Applied Animal Behaviour Science, 133, 827 175–185. 828
Briefer, E. F., & McElligott, A. G. (2012). Social effects on vocal ontogeny in an ungulate, 829 the goat (Capra hircus). Animal Behaviour, 83, 991–1000. 830
Briefer, E. F., & McElligott, A. G. (2013). Rescued goats at a sanctuary display positive 831 mood after former neglect. Applied Animal Behaviour Science, 146, 45–55. 832
Briefer, E. F., Padilla de la Torre, M., & McElligott, A. G. (2012). Mother goats do not 833 forget their kids’ calls. Proceedings of the Royal Society B, 279, 3749–3755. 834
Burman, O. H. P., Parker, R., Paul, E. S., & Mendl, M. (2008). A spatial judgement task 835 to determine background emotional state in laboratory rats, Rattus norvegicus. Animal 836 Behaviour, 76, 801–809. 837
Burnham, K. P., & Anderson, D. R. (2002). Model selection and multimodel inference: a 838 practical information-theoretic approach. New York: Springer. 839
Burnham, K. P., Anderson, D. R., & Huyvaert, K. P. (2011). AIC model selection and 840 multimodel inference in behavioral ecology: some background, observations, and 841 comparisons. Behavioral Ecology and Sociobiology, 65, 23–35. 842
Cannon, W. B. 1929. Bodily Changes in Pain, Hunger, Fear and Rage. Boston: Branford. 843 Charlton, B. D., Zhihe, Z., & Snyder, R. J. (2009a). The information content of giant 844
panda, Ailuropoda melanoleuca, bleats: acoustic cues to sex, age and size. Animal 845 Behaviour, 78, 893–898. 846
Charlton, B. D., Zhihe, Z., & Snyder, R. J. (2009b). Vocal cues to identity and 847 relatedness in giant pandas (Ailuropoda melanoleuca). Journal of the Acoustical 848 Society of America, 126, 2721–2732. 849
Darwin, C. (1872). The Expressions of Emotions in Man and Animals. London: John 850 Murray. 851
Davies, A. C., Radford, A. N., & Nicol, C. J. (2014). Behavioural and physiological 852 expression of arousal during decision-making in laying hens. Physiology & Behavior, 853 123, 93–99. 854
Fant, G. (1960). Acoustic theory of speech production. The Hague: Mouton. 855 Fitch, W. T. (1997). Vocal tract length and formant frequency dispersion correlate with 856

32
body size in rhesus macaques. Journal of the Acoustical Society of America, 102, 857 1213–1222. 858
Fitch, W. T. (2000). The phonetic potential of nonhuman vocal tracts: comparative 859 cineradiographic observations of vocalizing animals. Phonetica, 57, 205–218. 860
Fitch, W. T., & Hauser, M. D. (1995). Vocal production in nonhuman primates: Acoustics, 861 physiology, and functional constraints on honest advertisement. American Journal of 862 Primatology, 37, 191 – 219. 863
Forkman, B., Boissy, A., Meunier-Salaün, M.-C., Canali, E., & Jones, R. B. (2007). A 864 critical review of fear tests used on cattle, pigs, sheep, poultry and horses. Physiology 865 & Behavior, 92, 340–374. 866
Gogoleva, S., Svetlana, S., Volodin, I., Volodina, E., Kharlamova, A., & Trut, L. N. 867 (2010). Sign and strength of emotional arousal: vocal correlates of positive and 868 negative attitudes to humans in silver foxes (Vulpes vulpes). Behaviour, 147, 1713–869 1736. 870
Guidelines for the Use of Animals. (2014). Guidelines for the treatment of animals in 871 behavioural research and teaching. Animal Behaviour, 87, I-IX. 872
Gygax, L., Reefmann, N., Wolf, M., & Langbein, J. (2013). Prefrontal cortex activity, 873 sympatho-vagal reaction and behaviour distinguish between situations of feed reward 874 and frustration in dwarf goats. Behavioural Brain Research, 239, 104–114. 875
Hammerschmidt, K., & Jürgens, U. (2007). Acoustical correlates of affective prosody. 876 Journal of Voice, 21, 531–540. 877
Hänninen, L., & Pastell, M. (2009). CowLog: Open source software for coding behaviors 878 from digital video. Behavior Research Methods, 41, 472–476. 879
Hauser, M. D., Evans, C. S., & Marler, P. (1993). The role of articulation in the production 880 of rhesus monkey, Macaca mulatta, vocalizations. Animal Behaviour, 45, 423–433. 881
Hauser, M. D., & Ybarra, M. S. (1994). The role of lip configuration in monkey 882 vocalizations: experiments using xylocaine as a nerve block. Brain and Language, 46, 883 232–244. 884
Imfeld-Mueller, S., Van Wezemael, L., Stauffacher, M., Gygax, L., & Hillmann, E. (2011). 885 Do pigs distinguish between situations of different emotional valences during 886 anticipation? Applied Animal Behaviour Science, 131, 86–93. 887
Kaminski, J., Call, J., & Tomasello, M. (2006). Goats’ behaviour in a competitive food 888 paradigm: Evidence for perspective taking? Behaviour, 143, 1341–1356. 889
Kaminski, J., Riedel, J., Call, J., & Tomasello, M. (2005). Domestic goats, Capra hircus, 890 follow gaze direction and use social cues in an object choice task. Animal Behaviour, 891 69, 11–18. 892
Keltner, D. & Lerner, J. S. 2010. Emotion. In D. T. Gilbert, S. T. Fiske, & G. Lindsay 893 (Eds.), Handbook of Social Psychology (pp. 317–352). London: John Wiley & Sons. 894
Langbein, J., Nürnberg, G., & Manteuffel, G. (2004). Visual discrimination learning in 895 dwarf goats and associated changes in heart rate and heart rate variability. Physiology 896 & Behavior, 82, 601–609. 897
Lingle, S., Wyman, M. T., Kotrba, R., Teichroeb, L. J., & Romanow, C. A. (2012). What 898 makes a cry a cry? A review of infant distress vocalizations. Current Zoology, 58, 698–899 726. 900
Manteuffel, G., Puppe, B., & Schön, P.-C. (2004). Vocalization of farm animals as a 901 measure of welfare. Applied Animal Behaviour Science, 88, 163–182. 902
McElligott, A. G., Birrer, M. & Vannoni, E. (2006). Retraction of the mobile descended 903 larynx during groaning enables fallow bucks (Dama dama) to lower their formant 904 frequencies. Journal of Zoology, 270, 340 – 345. 905
Mendl, M., Burman, O. H. P., Parker, R. M. A., & Paul, E. S. (2009). Cognitive bias as an 906 indicator of animal emotion and welfare: Emerging evidence and underlying 907 mechanisms. Applied Animal Behaviour Science, 118, 161–181. 908
Mendl, M., Burman, O. H. P., & Paul, E. S. (2010). An integrative and functional 909 framework for the study of animal emotion and mood. Proceedings of the Royal 910 Society B, 277, 2895 –2904. 911
Moe, R. O., Nordgreen, J., Janczak, A. M., Spruijt, B. M., Zanella, A. J., & Bakken, M. 912 (2009). Trace classical conditioning as an approach to the study of reward-related 913

33
behaviour in laying hens: A methodological study. Proceedings of the Royal Society B, 914 121, 171–178. 915
Murphy, E., Nordquist, R. E., & van der Staay, F. J. (2014). A review of behavioural 916 methods to study emotion and mood in pigs, Sus scrofa. Applied Animal Behaviour 917 Science, 159, 9-28. 918
Nawroth, C., von Borell, E., & Langbein, J. (2014a). Goats that stare at men: dwarf goats 919 alter their behaviour in response to human head orientation, but do not spontaneously 920 use head direction as a cue in a food-related context. Animal Cognition, 1–9. 921
Nawroth, C., von Borell, E., & Langbein, J. (2014b). Exclusion performance in dwarf 922 goats (Capra aegagrus hircus) and sheep (Ovis orientalis aries). PLOS ONE, 9, 923 e93534. 924
Nettle, D., & Bateson, M. (2012). The evolutionary origins of mood and its disorders. 925 Current Biology, 22, R712–R721. 926
Panksepp, J. 2009. Emotional causes and consequences of social-affective vocalization. 927 In M. Brudzynski (Ed.), Handbook of Mammalian Vocalization - An Integrative 928 Neuroscience Approach (pp. 201–208). London: Academic Press. 929
Perez, E. C., Elie, J. E., Soulage, C. O., Soula, H. A., Mathevon, N. & Vignal, C. 2012. The 930 acoustic expression of stress in a songbird: Does corticosterone drive isolation-induced 931 modifications of zebra finch calls? Hormones and Behavior 61, 573–581. 932
Pinheiro, J. C. & Bates, D. M. 2000. Mixed-effects Models in S and S-PLUS. NewYork, 933 USA: Springer-Verlag. 934
Price, E. O., & Thos, J. (1980). Behavioral responses to short-term social isolation in 935 sheep and goats. Applied Animal Ethology, 6, 331–339. 936
R Development Core Team. (2013). R Foundation for Statistical Computing. Vienna, 937 Austria. Retrieved from http://www.R-project.org 938
Reby, D., Cargnelutti, B., & Hewison, A. J. M. (1999). Contexts and possible functions of 939 barking in roe deer. Animal Behaviour, 57, 1121 – 1128. 940
Reby, D., & McComb, K. (2003). Anatomical constraints generate honesty: acoustic cues 941 to age and weight in the roars of red deer stags. Animal Behaviour, 65, 519–530. 942
Reefmann, N., Bütikofer Kaszàs, F., Wechsler, B., & Gygax, L. (2009a). Ear and tail 943 postures as indicators of emotional valence in sheep. Applied Animal Behaviour 944 Science, 118, 199–207. 945
Reefmann, N., Bütikofer Kaszàs, F., Wechsler, B., & Gygax, L. (2009b). Physiological 946 expression of emotional reactions in sheep. Physiology & Behavior, 98, 235–241. 947
Reefmann, N., Wechsler, B., & Gygax, L. (2009). Behavioural and physiological 948 assessment of positive and negative emotion in sheep. Animal Behaviour, 78, 651–949 659. 950
Reimert, I., Bolhuis, J. E., Kemp, B., & Rodenburg, T. B. (2013). Indicators of positive 951 and negative emotions and emotional contagion in pigs. Physiology & Behavior, 109, 952 42–50. 953
Riede, T., Beckers, G. J. L., Blevins, W., & Suthers, R. A. (2004). Inflation of the 954 esophagus and vocal tract filtering in ring doves. Journal of Experimental Biology, 207, 955 4025–4036. 956
Riede, T., Bronson, E., Hatzikirou, H., & Zuberbühler, K. (2005). Vocal production 957 mechanisms in a non-human primate: Morphological data and a model. Journal of 958 Human Evolution, 48, 85–96. 959
Ruiz-Miranda, C. R., Szymanski, M. D., & Ingals, J. W. (1993). Physical characteristics of 960 the vocalizations of domestic goat does Capra hircus in response to their offspring’s 961 cries. Bioacoustics, 5, 99–116. 962
Russell, J. 1980. A circumplex model of affect. Journal of Personality and Social 963 Psychology, 39, 1161–1178. 964
Scherer, K. R. (1986). Vocal affect expression: a review and a model for future research. 965 Psychological Bulletin, 99, 143 – 165. 966
Scherer, K. R. (2003). Vocal communication of emotion: A review of research paradigms. 967 Speech Communication, 40, 227–256. 968
Schrader, L., & Todt, D. (1998). Vocal quality is correlated with levels of stress hormones 969 in domestic pigs. Ethology, 104, 859–876. 970

34
Sèbe, F., Duboscq, J., Aubin, T., Ligout, S., & Poindron, P. (2010). Early vocal recognition 971 of mother by lambs: contribution of low- and high-frequency vocalizations. Animal 972 Behaviour, 79, 1055–1066. 973
Seyle, H. (1976). The Stress of Life. New York: McGraw-Hill. 974 Siebert, K., Langbein, J., Schön, P.-C., Tuchscherer, A., & Puppe, B. (2011). Degree of 975
social isolation affects behavioural and vocal response patterns in dwarf goats (Capra 976 hircus). Applied Animal Behaviour Science, 131, 53–62. 977
Soltis, J., Blowers, T. E., & Savage, A. (2011). Measuring positive and negative affect in 978 the voiced sounds of African elephants (Loxodonta africana). Journal of the Acoustical 979 Society of America, 129, 1059–1066. 980
Spruijt, B. M., van den Bos, R., & Pijlman, F. T. A. (2001). A concept of welfare based on 981 reward evaluating mechanisms in the brain: anticipatory behaviour as an indicator for 982 the state of reward systems. Applied Animal Behaviour Science, 72, 145–171. 983
Stanley, C. R., & Dunbar, R. I. M. (2013). Consistent social structure and optimal clique 984 size revealed by social network analysis of feral goats, Capra hircus. Animal 985 Behaviour, 85, 771–779. 986
Sueur, J., Aubin, T., & Simonis, C. (2008). Equipment Review: Seewave, a free modular 987 tool for sound analysis and synthesis. Bioacoustics, 18, 213–226. 988
Symonds, M. R. E., & Moussalli, A. (2011). A brief guide to model selection, multimodel 989 inference and model averaging in behavioural ecology using Akaike’s information 990 criterion. Behavioral Ecology and Sociobiology, 65, 13–21. 991
Taylor, A. M. & Reby, D. 2010. The contribution of source–filter theory to mammal vocal 992 communication research. Journal of Zoology, 280, 221–236. 993
Taylor, A. M., Reby, D., & McComb, K. (2009). Context-related variation in the vocal 994 growling behaviour of the domestic dog (Canis familiaris). Ethology, 115, 905–915. 995
Titze, I. R. 1994. Principles of Voice Production. Englewood Cliffs, NJ: Prentice Hall. 996 von Borell, E., Langbein, J., Després, G., Hansen, S., Leterrier, C., Marchant-Forde, J., et 997
al. (2007). Heart rate variability as a measure of autonomic regulation of cardiac 998 activity for assessing stress and welfare in farm animals - A review. Physiology & 999 Behavior, 92, 293–316. 1000
von Holst, D. (1998). The concept of stress and its relevance for animal behavior. 1001 Advances in the Study of Behavior, 27, 1–131. 1002
Zebunke, M., Langbein, J., Manteuffel, G., & Puppe, B. (2011). Autonomic reactions 1003 indicating positive affect during acoustic reward learning in domestic pigs. Animal 1004 Behaviour, 81, 481–489. 1005
1006

35
Figure 1007
1008
Figure 1. Heart rate as a function of emotional situations. Model residuals of heart rate 1009
controlled for sex and age of the goats, individual identity, test pair and breed for each of 1010
the experimental situations (Control, Feeding, Frustration and Isolation situations; box-1011
and-whiskers plot, the horizontal line shows the median, the box extends from the lower 1012
to the upper quartile, and the whiskers to the most extreme data point). The black 1013
squares indicate the mean. Same letters (a, b) indicate that situations did not 1014
significantly differ. Based on these results, situations marked with an (a) received an 1015
arousal level of 1, situations marked with a (b) received an arousal level of 2. Arousal 1016
levels (1 or 2) and valence (Neutral, Positive and Negative) corresponding to the 1017
situations are also indicated under the box-and-whiskers plot (arousal / valence). 1018
1019

36
1020
1021
Figure 2. Spectrograms of negative and positive calls. (a) call produced during the 1022
negative situation; (b) call produced during the positive situations by the same goat. 1023
Positive calls have a lower fundamental frequency (F0) range and smaller frequency 1024
modulations than negative calls. The first four formants are also indicated on the right of 1025
the spectrogram. These calls are available as audio files (Audio A1). 1026
1027

37
Appendix 1028
Acoustic Analysis 1029
1030
Here, we provide a detailed description of the acoustic analysis. The source-related 1031
acoustic features (fundamental frequency, F0), filter-related acoustic features (formants 1032
and energy quartiles), and intensity features that we measured (13 parameters) are 1033
detailed below (Praat commands are indicated in brackets). 1034
Source-related acoustic features were measured by extracting the F0 contour of 1035
each call using a cross-correlation method ([Sound: To Pitch (cc) command], time step = 1036
0.01 s, pitch floor =100-150 Hz, pitch ceiling = 300-600 Hz). For each extracted F0 1037
contour, we measured the following vocal parameters: the frequency value of F0 at the 1038
end (F0end) of the call, the mean F0 frequency values across the call (F0mean), and the 1039
F0 frequency range (F0range). To characterize F0 variation along the call, we measured 1040
the mean peak-to-peak variation of each F0 modulation (FMExtent, Charlton et al., 1041
2009a; Charlton, Zhihe, & Snyder, 2009b). 1042
Filter-related (formants) acoustic features were measured by extracting the 1043
contour of the first four formants of each call using Linear Predictive Coding analysis 1044
(LPC; [Sound: To Formant (burg) command]: time step = 0.01 s, maximum number of 1045
formants = 4–5, maximum formant = 3000–5500 Hz, window length = 0.05 s). To check 1046
if the Praat software accurately tracked the formants, the outputs of the LPC analysis 1047
were visually inspected together with the spectrograms. Spurious values were deleted 1048
and we corrected for octave jumps when necessary. For each call we collected the mean 1049
(F1-4mean) values of the formants. Finally, we measured the frequency values at the 1050
upper limit of the first (Q25%), second (Q50%) and third (Q75%) quartiles of energy, 1051
using a linear amplitude spectrum applied to the whole call. 1052
We measured intensity characteristics by extracting the intensity contour of each 1053
call [Sound: To Intensity command]. We then included the mean peak-to-peak variation 1054

38
of each amplitude modulation in our analyses (AMextent; see Charlton et al. 2009b for 1055
details of these parameters). We also included the total duration of each call (Dur). 1056
1057

39
Tables 1058
Table 1. Characteristics of the goats used: sex, age and breed; as well as the number of 1059
calls analyzed for each goat. 1060
1061
Goat Sex Age (years) Breed Number of calls
1 Female 11 Anglo-Nubian 8 2 Female 16 British Toggenburg 0 3 Female 8 Pygmy Goat 6 4 Female 11 Golden Guernsey 12 5 Female 7 British Alpine 2 6 Female 5 British Alpine 8 7 Female 14 British Toggenburg 10 8 Female 7 British Saanen 19 9 Female 7 British Toggenburg 3 10 Female 13 British Toggenburg 20 11 Female 17 British Saanen 0 12 Male 11 Pygmy Goat 5 13 Male 10 Golden Guernsey 17 14 Male 8 Pygmy Goat 0 15 Male 10 British Toggenburg 2 16 Male 7 British Toggenburg 11 17 Male 9 British Saanen 8 18 Male 4 Boer 12 19 Male 7 British Toggenburg 10 20 Male 3 Boer 9 21 Male 9 Mixed Breed 6 22 Male 6 Golden Guernsey 2
1062

40
Table 2. Abbreviations, definition and correlations for the physiological, behavioural and 1063
vocal parameters. 1064
1065
Abbreviation Correlated with Parameter
Physiology RMSSD (ms) HR Root mean square successive difference RespRate (breaths/s) HR Respiration rate
Behaviour HeadMov (min-1) EarsHoriz Number of rapid head movement per minute Locomotion EarsForw, EarsAsym,
TailUp Proportion of time spent moving
EarsForw Locomotion, EarsHoriz EarsBack, EarsAsym, TailUp
Proportion of time spent with the ears orientated forward
EarsHoriz HeadMov, EarsForw, TailUp
Proportion of time spent with the ears orientated horizontally
EarsBack EarsForw, EarsAsym Proportion of time spent with the ears orientated backward
EarsAsym Locomotion, EarsForw, EarsBack
Proportion of time spent with the ears asymmetrical (different orientation for the right and left ears)
TailUp Locomotion, EarsForw, EarsHoriz
Proportion of time spent with the tail up
Calls (min-1) None Number of calls per minute Vocalisations Dur (s) None Duration of the call
F0mean (Hz) F0end, F0range, FMextent, AMextent, Q25%, Q50%
Mean F0 frequency value across the call
F0end (Hz) F0mean, F0range, Q50%, Q75%
Frequency value of F0 at the end of the call
F0range (Hz) F0mean, F0end, FMextent
Difference between F0Max and F0Min
FMextent (Hz) F0mean, F0range Mean peak-to-peak variation of each F0 modulation AMextent (dB) F0mean Mean peak-to-peak variation of each amplitude
modulation Q25% (Hz) F0mean, Q50%,
Q75% Frequency value at the upper limit of the first
quartiles of energy Q50% (Hz) F0mean, F0end,
Q25%, Q75% Frequency value at the upper limit of the second
quartiles of energy Q75% (Hz) F0end, Q25%, Q50% Frequency value at the upper limit of the third
quartiles of energy F1mean (Hz) F2mean Mean frequency value of the first formant F2mean (Hz) F1mean, F3mean,
F4mean Mean frequency value of the second formant
F3mean (Hz) F2mean, F4mean Mean frequency value of the third formant F4mean (Hz) F2mean, F3mean Mean frequency value of the fourth formant
1066
Correlations across individuals between a given parameter and others within its category 1067
(physiological, behavioural or vocal) are indicated when significant (Spearman's rank 1068
correlation; P < 0.05). 1069
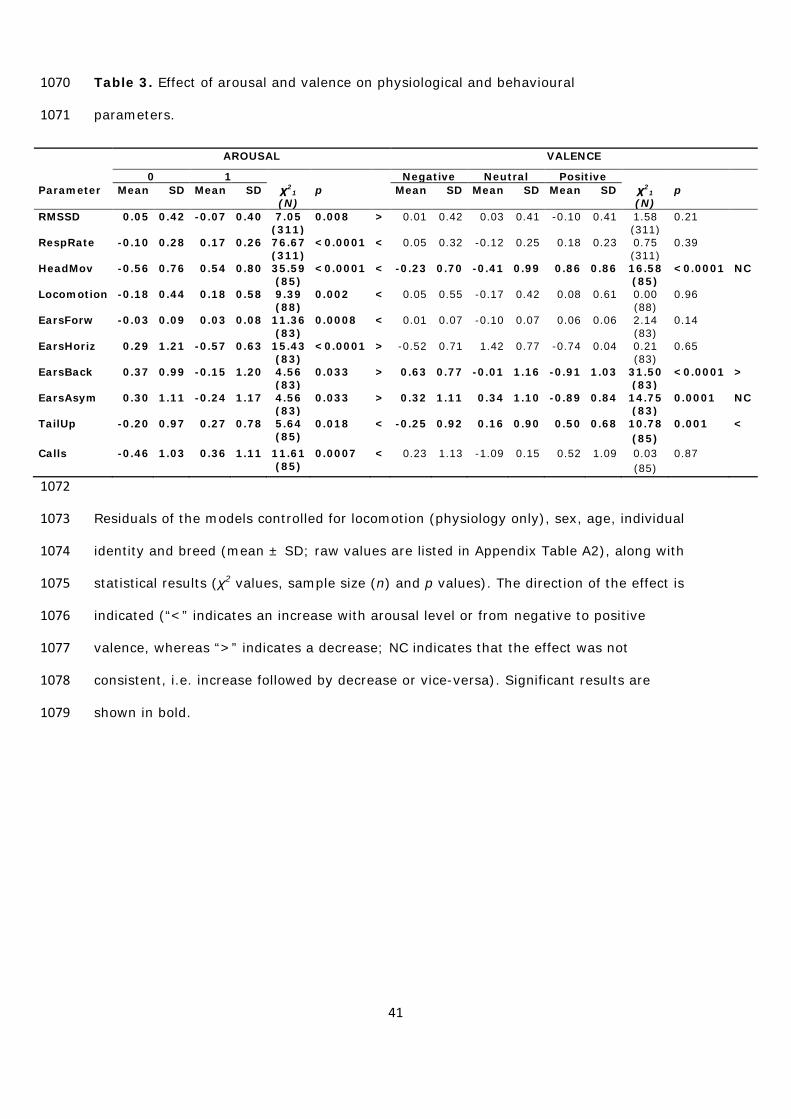
41
Table 3. Effect of arousal and valence on physiological and behavioural 1070
parameters. 1071
1072
Residuals of the models controlled for locomotion (physiology only), sex, age, individual 1073
identity and breed (mean ± SD; raw values are listed in Appendix Table A2), along with 1074
statistical results (χ2 values, sample size (n) and p values). The direction of the effect is 1075
indicated (“<” indicates an increase with arousal level or from negative to positive 1076
valence, whereas “>” indicates a decrease; NC indicates that the effect was not 1077
consistent, i.e. increase followed by decrease or vice-versa). Significant results are 1078
shown in bold. 1079
AROUSAL VALENCE
0 1 Negative Neutral Positive Parameter Mean SD Mean SD χ2
1 (N)
p Mean SD Mean SD Mean SD χ21
(N) p
RMSSD 0.05 0.42 -0.07 0.40 7.05 (311)
0.008 > 0.01 0.42 0.03 0.41 -0.10 0.41 1.58 (311)
0.21
RespRate -0.10 0.28 0.17 0.26 76.67 (311)
<0.0001 < 0.05 0.32 -0.12 0.25 0.18 0.23 0.75 (311)
0.39
HeadMov -0.56 0.76 0.54 0.80 35.59 (85)
<0.0001 < -0.23 0.70 -0.41 0.99 0.86 0.86 16.58 (85)
<0.0001 NC
Locomotion -0.18 0.44 0.18 0.58 9.39 (88)
0.002 < 0.05 0.55 -0.17 0.42 0.08 0.61 0.00 (88)
0.96
EarsForw -0.03 0.09 0.03 0.08 11.36 (83)
0.0008 < 0.01 0.07 -0.10 0.07 0.06 0.06 2.14 (83)
0.14
EarsHoriz 0.29 1.21 -0.57 0.63 15.43 (83)
<0.0001 > -0.52 0.71 1.42 0.77 -0.74 0.04 0.21 (83)
0.65
EarsBack 0.37 0.99 -0.15 1.20 4.56 (83)
0.033 > 0.63 0.77 -0.01 1.16 -0.91 1.03 31.50 (83)
<0.0001 >
EarsAsym 0.30 1.11 -0.24 1.17 4.56 (83)
0.033 > 0.32 1.11 0.34 1.10 -0.89 0.84 14.75 (83)
0.0001 NC
TailUp -0.20 0.97 0.27 0.78 5.64 (85)
0.018 < -0.25 0.92 0.16 0.90 0.50 0.68 10.78 (85)
0.001 <
Calls -0.46 1.03 0.36 1.11 11.61 (85)
0.0007 < 0.23 1.13 -1.09 0.15 0.52 1.09 0.03 (85)
0.87

42
Table 4. Results of AIC comparisons for behavioural parameters significantly affected 1080
both by arousal and valence. 1081
1082
Parameter Arousal/ Valence
AICC ΔAICC wi
HeadMov A 215.47 0.00 1.00 V 234.49 19.01 0.00
EarsBack A 115.60 26.94 0.00 V 88.66 0.00 1.00
EarsAsym A 125.39 10.19 0.01 V 115.20 0.00 0.99
TailUp A 109.17 5.14 0.07 V 104.03 0.00 0.93
1083
The best fit (arousal or valence based on lowest AICC) for a given response variable (set 1084
of models) is indicated in bold. The fit of the models is assessed by Akaike’s information 1085
criterion corrected for small sample sizes (AICC). ΔAICC gives the difference in AICC 1086
between each model and the best model. The Akaike’s weights (ωi) assess the relative 1087
support that a given model has from the data, compared to other candidate models in 1088
the set. 1089
1090

43
Table 5. Effect of arousal and valence on vocal parameters. 1091
1092
AROUSAL VALENCE 0 1 Negative Positive Parameter Mean SD Mean SD χ2
1 (N)
p Mean SD Mean SD χ21
(N) P
Duration -0.01 0.13 0.00 0.11 0.35 (158)
0.55 0.00 0.12 -0.01 0.11 0.63 (158)
0.43
F0mean -0.02 0.10 0.01 0.10 4.67 (158)
0.031 < 0.00 0.11 0.01 0.10 0.23 (158)
0.63
F0end -0.05 0.19 0.03 0.15 13.36 (158)
0.0003 < -0.01 0.17 0.04 0.15 3.43 (158)
0.06
F0range 0.04 0.38 -0.02 -0.47 1.20 (158)
0.27 0.05 0.43 -0.16 0.43 6.88 (158)
0.009 >
FMextent 0.09 0.44 -0.04 0.59 3.20 (158)
0.07 0.05 0.52 -0.17 0.58 5.26 (158)
0.022 >
AMextent 0.01 0.43 0.00 0.31 0.03 (158)
0.85 -0.02 0.36 0.07 0.31 2.06 (158)
0.15
Q25% -20.02 88.36 10.01 73.00 7.10 (158)
0.008 < -2.39 77.25 8.36 87.38 0.57 (158)
0.45
Q50% -0.10 0.37 0.05 0.28 12.50 (158)
0.0004 < -0.01 0.33 0.05 0.29 1.25 (158)
0.26
Q75% -0.08 0.50 0.04 0.32 5.84 (158)
0.016 < -0.01 0.40 0.04 0.35 0.68 (158)
0.41
F1mean 40.15 106.75 -17.27 81.65 16.56 (112)
<0.0001 > -4.37 94.77 15.69 87.77 1.07 (112)
0.30
F2mean 11.58 152.13 -3.05 101.45 0.46 (95)
0.50 0.72 122.46 -2.35 77.90 0.02 (95)
0.90
F3mean -6.08 102.16 1.80 118.64 0.14 (98)
0.71 3.46 120.46 -11.11 94.95 0.36 (98)
0.55
F4mean -36.93 90.44 11.04 146.92 3.68 (92)
0.055 < 5.44 136.34 -19.16 141.12 0.68 (92)
0.41
1093
Residuals of the models controlled for sex, age, breed and call type (mean ± SD; raw 1094
values are listed in Appendix Table A2), along with statistical results (χ2 values, sample 1095
size (N) and p values). The direction is indicated for the significant and marginally 1096
significant (0.06 ≥ p ≥ 0.05) effects (“<” indicates an increase with arousal level or from 1097
negative to positive valence, whereas “>” indicates a decrease). Significant and 1098
marginally significant results are shown in bold. 1099
1100

44
Table A1. Control factors and differences between Frustration and Isolation situations. 1101
Sex Age Call type Frustration vs Isolation
Parameter χ21 p χ2
1 p χ21 p χ2
1 p
Physiology RMSSD 0.17 0.68 0.12 0.73 - - 3.60 0.058 RespRate 8.15 0.004 3.79 0.052 - - 27.44 <0.0001
Behaviour HeadMov 0.01 0.94 3.22 0.07 - - 26.53 <0.0001 Locomotion 4.41 0.036 0.94 0.33 - - 8.07 0.005 EarsForward 3.37 0.07 0.00 1.00 - - 0.70 0.40 EarsHorizontal 0.20 0.65 0.02 0.89 - - 1.15 0.28 EarsBackward 0.17 0.68 0.77 0.38 - - 4.64 0.031 EarsAsymetric 0.00 0.98 0.26 0.61 - - 0.12 0.73 TailUp 0.03 0.87 2.06 0.15 - - 4.61 0.032 Calls 0.38 0.54 2.45 0.12 - - 0.03 0.86
Vocalisations Duration 3.60 0.06 1.96 0.16 1.11 0.57 0.41 0.52
F0mean 1.79 0.18 0.03 0.85 8.17 0.017 5.74 0.017 F0end 3.10 0.08 0.39 0.53 2.09 0.35 8.44 0.004 F0range 0.06 0.80 0.78 0.38 9.74 0.008 0.22 0.64 FMextent 0.10 0.76 0.61 0.44 7.84 0.020 0.53 0.47 AMextent 0.13 0.72 0.34 0.56 0.40 0.82 0.33 0.56 Q25% 9.33 0.002 3.53 0.06 37.87 <0.0001 6.37 0.012 Q50% 3.47 0.06 0.02 0.89 18.98 <0.0001 8.64 0.003 Q75% 1.43 0.23 0.03 0.87 3.64 0.16 4.55 0.033 F1mean 0.16 0.69 0.27 0.60 18.55 <0.0001 21.71 <0.0001 F2mean 0.08 0.77 0.08 0.78 2.13 0.35 0.52 0.47 F3mean 0.37 0.54 0.20 0.65 4.21 0.12 0.08 0.78 F4mean 0.34 0.56 0.12 0.73 2.80 0.25 4.02 0.045
1102
Effects of the control factors (age, sex and call type), as well as difference between the 1103
Frustration and Isolation situations (both assumed of negative valence), for physiological, 1104
behavioural and vocal parameters (linear mixed-effects models and generalized linear 1105
mixed models, compared with likelihood-ratio tests). Bold font indicates significant (p < 1106
0.05) and marginally significant (0.06 < p ≤ 0.05) effects. The direction of the significant 1107
changes was assessed from residuals of the models. Sex (female, “F”; or male, “M”) 1108
affected RespRate (F > M), Locomotion (F < M) and Q25 (F > M). Age tended to affect 1109
RespRate (marginally significant decrease with age). The type of call (closed mouth “CM”, 1110
open mouth “OP” or mixed call “Mi”) affected F0-related parameters (F0mean: Mi > OP > 1111
CM), the variation in F0 (F0range and FMextent: Mi > OP > CM), the energy quartiles 1112

45
(Q25% and Q50%: Mi > OP > CM) and F1mean (OM > Mi > CM). The difference between 1113
the Frustration (“Fr”) and the Isolation situations (“I”) was marginally significant for 1114
RMSSD (Fr < I), and significant for RespRate (Fr > I), HeadMov (Fr > I), Locomotion (Fr 1115
> I), EarsBackward (Fr < I) and TailUp (Fr > I). Concerning vocal parameter, this 1116
difference was significant for F0-related parameters (F0mean: Fr > I), the energy 1117
quartiles (Q25-Q75%: Fr > I), F1mean (Fr < I) and F4mean (Fr > I). In addition, the 1118
time spent moving (Locomotion) was included as a control factor for the physiological 1119
indicators. It had a significant effect on RespRate (LMM: X2 = 6.03, df = 1, p = 0.014), 1120
but not on RMSSD (LMM: X2 = 0.09, df = 1, p = 0.77). 1121
1122

46
Table A2. Raw values of the physiological, behavioural and vocal parameters measured 1123
for each arousal level and valence of the situations (Mean ± SD). 1124
1125
1126 AROUSAL VALENCE 0 1 Negative Neutral Positive
Parameter Mean SD Mean SD Mean SD Mean SD Mean SD
Physiology HR (beats/min) 108.75 15.38 123.00 23.52 115.74 21.94 107.79 12.25 126.37 24.71
RMSSD (ms) 31.66 19.65 26.83 15.21 29.90 18.53 31.21 19.49 26.15 13.34
RespRate (breaths/s) 0.32 0.10 0.42 0.11 0.38 0.13 0.31 0.08 0.42 0.09
Behaviour HeadMov (min-1) 7.16 10.61 22.02 26.08 9.73 13.48 9.68 14.95 29.80 31.17
Locomotion (%) 3.78 3.57 7.69 8.60 5.87 5.49 3.49 2.38 7.71 10.81
EarsForward (%) 61.57 29.80 82.02 27.04 74.80 25.97 41.93 26.79 92.54 19.14
EarsHorizontal (%) 16.25 25.08 0.21 1.11 0.25 1.14 35.99 26.32 0.00 0.00
EarsBackward (%) 12.63 14.18 15.37 21.04 19.72 17.74 9.13 14.88 6.39 17.62
EarsAsymetric (%) 8.61 15.10 2.58 5.57 2.84 3.10 16.16 20.07 1.86 7.26
TailUp (%) 33.56 42.01 57.07 46.23 35.15 45.67 46.34 42.25 64.54 43.58
Calls (min-1) 0.45 1.59 3.36 4.40 1.55 2.74 0.00 0.00 4.67 5.16
Vocalisations Dur (s) 0.84 0.21 0.78 0.16 0.81 0.19 - - 0.78 0.15
F0Mean (Hz) 253.40 105.98 228.30 56.56 240.42 81.58 - - 223.51 58.76
F0End (Hz) 189.30 62.83 190.49 51.26 189.88 56.23 - - 190.83 52.14
F0Range (Hz) 115.75 84.85 91.29 52.63 106.75 69.21 - - 73.85 44.95
FMExtent (Hz) 71.16 42.52 75.37 105.98 79.99 99.20 - - 52.87 36.92
AMExtent (dB) 11.76 7.46 11.96 5.52 11.68 6.49 - - 12.63 5.14
Q25% (Hz) 241.83 135.94 255.42 109.55 251.98 120.39 - - 247.09 114.39
Q50% (Hz) 437.61 263.19 453.05 209.33 446.91 226.02 - - 451.38 238.04
Q75% (Hz) 1020.65 814.46 997.37 659.22 998.30 689.43 - - 1029.04 797.02
F1Mean (Hz) 694.97 163.87 655.17 113.25 659.00 132.24 - - 696.33 125.15
F2Mean (Hz) 1651.64 369.82 1596.72 289.56 1621.11 307.98 - - 1566.03 305.97
F3Mean (Hz) 2544.34 419.27 2549.80 368.42 2573.22 370.67 - - 2469.27 400.37
F4Mean (Hz) 3283.72 471.22 3423.91 521.30 3420.27 497.53 - - 3290.92 557.30

47
Audio A1. Negative and positive calls. Audio files corresponding to the calls 1127
presented in Fig. 2; one call produced during the negative situation followed by a call 1128
produced during the positive situation by the same goat. 1129