1 emission and air quality trends review new jersey may 2013
TRANSCRIPT

1
Emission and Air Quality Trends
Review
New Jersey
May 2013
2
Project Objective To develop and present publicly available
information on trends in emissions and ambient air quality in the U.S. since 1999 in easy to understand visual and tabular formats
3
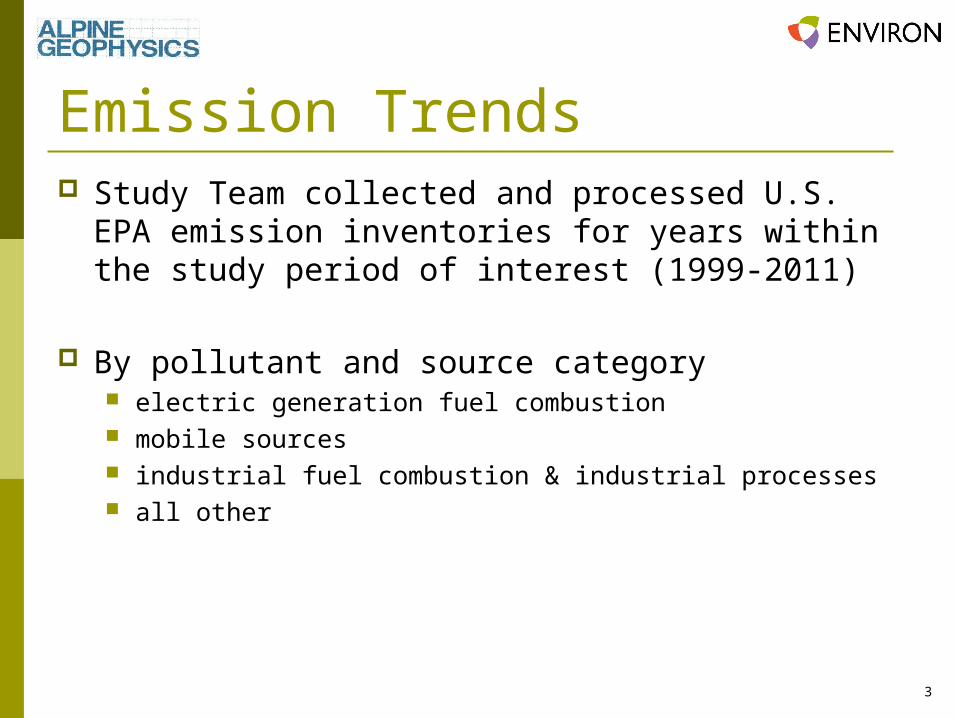
Emission Trends Study Team collected and processed U.S. EPA
emission inventories for years within the study period of interest (1999-2011)
By pollutant and source category electric generation fuel combustion mobile sources industrial fuel combustion & industrial processes all other

4
Emissions Data Summary Data Obtained from EPA National Emission Inventory (NEI)
and Trends Websites
EPA’s Trends reports and emission comparisons include interpolations of all categories between key years (1999, 2002, 2005, 2008, 2011) at county-pollutant level
Represented Pollutants: VOC, NOx, SO2, and PM2.5
Project Improvement
The Study Team augmented above data with year specific CEM emissions (2002 through 2011)

5
Emission Changes The following slides also include the
tonnage-based emissions change from 1999 to 2011 for each pollutant
Negative values indicate decrease in emissions, positive values indicate an increase

6
New Jersey Emission Trends (VOC)
Annual Emissions (Tons)Source Category 1999 2001 2003 2005 2006 2007 2008 2009 2010 2011Electric Utility Coal Fuel Combustion 2,314 1,023 660 821 711 574 630 427 531 29Mobile Sources 196,215 186,731 173,642 175,531 166,319 157,106 115,215 111,107 106,999 103,765Industrial Fuel Combustion & Processes 194,015 195,658 154,690 135,431 134,315 133,200 132,087 130,971 129,856 101,622All Others 335 340 397 374 369 379 461 429 456 222
Total 392,879 383,752 329,388 312,156 301,714 291,260 248,393 242,935 237,842 205,639
Annual Emissions Change (Percent since 1999)Source Category 1999 2001 2003 2005 2006 2007 2008 2009 2010 2011Electric Utility Coal Fuel Combustion 0% -56% -71% -65% -69% -75% -73% -82% -77% -99%Mobile Sources 0% -5% -12% -11% -15% -20% -41% -43% -45% -47%Industrial Fuel Combustion & Processes 0% 1% -20% -30% -31% -31% -32% -32% -33% -48%All Others 0% 1% 18% 11% 10% 13% 37% 28% 36% -34%
Total 0% -2% -16% -21% -23% -26% -37% -38% -39% -48%

7
New Jersey Emission Trends (VOC)
8
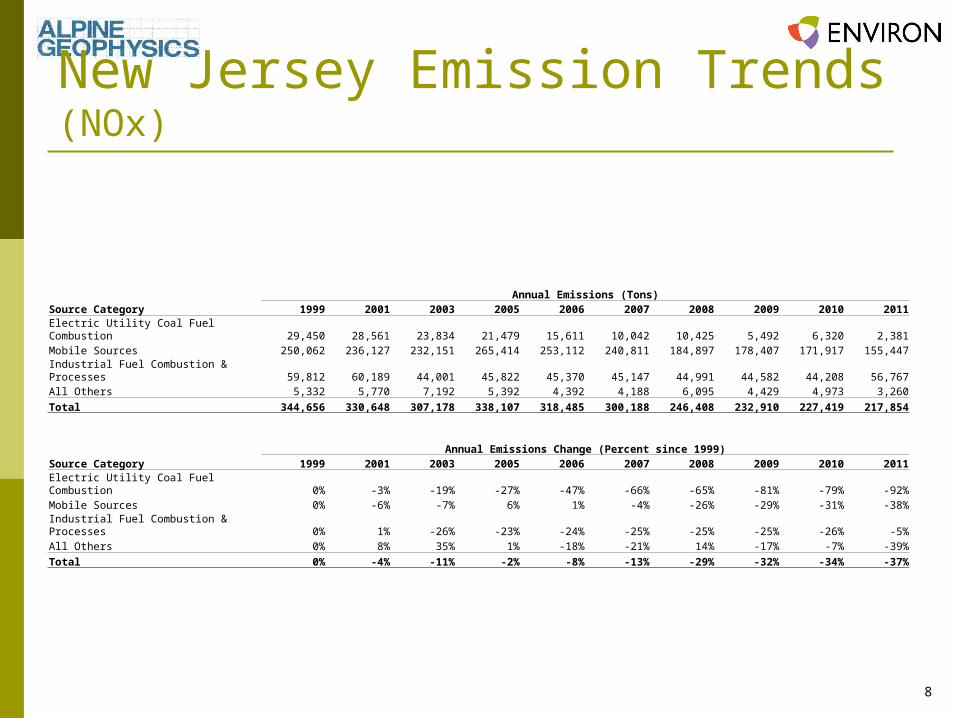
New Jersey Emission Trends (NOx)
Annual Emissions (Tons)Source Category 1999 2001 2003 2005 2006 2007 2008 2009 2010 2011Electric Utility Coal Fuel Combustion 29,450 28,561 23,834 21,479 15,611 10,042 10,425 5,492 6,320 2,381Mobile Sources 250,062 236,127 232,151 265,414 253,112 240,811 184,897 178,407 171,917 155,447Industrial Fuel Combustion & Processes 59,812 60,189 44,001 45,822 45,370 45,147 44,991 44,582 44,208 56,767All Others 5,332 5,770 7,192 5,392 4,392 4,188 6,095 4,429 4,973 3,260
Total 344,656 330,648 307,178 338,107 318,485 300,188 246,408 232,910 227,419 217,854
Annual Emissions Change (Percent since 1999)Source Category 1999 2001 2003 2005 2006 2007 2008 2009 2010 2011Electric Utility Coal Fuel Combustion 0% -3% -19% -27% -47% -66% -65% -81% -79% -92%Mobile Sources 0% -6% -7% 6% 1% -4% -26% -29% -31% -38%Industrial Fuel Combustion & Processes 0% 1% -26% -23% -24% -25% -25% -25% -26% -5%All Others 0% 8% 35% 1% -18% -21% 14% -17% -7% -39%
Total 0% -4% -11% -2% -8% -13% -29% -32% -34% -37%

9
New Jersey Emission Trends (NOx)

10
New Jersey Emission Trends (SO2)
Annual Emissions (Tons)Source Category 1999 2001 2003 2005 2006 2007 2008 2009 2010 2011Electric Utility Coal Fuel Combustion 48,437 48,901 51,382 52,717 45,610 33,622 24,430 12,667 15,063 3,471Mobile Sources 13,773 10,539 23,117 16,559 14,981 13,404 10,634 9,376 8,117 7,636Industrial Fuel Combustion & Processes 57,771 60,166 19,807 18,261 18,112 17,966 17,819 17,671 17,524 10,972All Others 2,889 3,270 3,246 1,614 697 793 685 470 436 411
Total 122,869 122,876 97,552 89,151 79,401 65,786 53,568 40,184 41,141 22,490
Annual Emissions Change (Percent since 1999)Source Category 1999 2001 2003 2005 2006 2007 2008 2009 2010 2011Electric Utility Coal Fuel Combustion 0% 1% 6% 9% -6% -31% -50% -74% -69% -93%Mobile Sources 0% -23% 68% 20% 9% -3% -23% -32% -41% -45%Industrial Fuel Combustion & Processes 0% 4% -66% -68% -69% -69% -69% -69% -70% -81%All Others 0% 13% 12% -44% -76% -73% -76% -84% -85% -86%
Total 0% 0% -21% -27% -35% -46% -56% -67% -67% -82%

11
New Jersey Emission Trends (SO2)

12
New Jersey Emission Trends (PM2.5)
Annual Emissions (Tons)Source Category 1999 2001 2003 2005 2006 2007 2008 2009 2010 2011Electric Utility Coal Fuel Combustion 2,750 2,796 3,657 3,741 3,330 3,135 6,588 4,028 4,592 245Mobile Sources 9,447 8,621 8,297 10,067 9,629 9,190 9,590 9,159 8,728 7,977Industrial Fuel Combustion & Processes 28,503 26,887 15,114 14,959 14,812 14,680 14,546 14,403 14,264 12,535All Others 26,417 14,318 1,860 1,768 1,750 1,745 1,804 1,772 1,773 5,079
Total 67,117 52,622 28,928 30,536 29,522 28,750 32,528 29,362 29,357 25,837
Annual Emissions Change (Percent since 1999)Source Category 1999 2001 2003 2005 2006 2007 2008 2009 2010 2011Electric Utility Coal Fuel Combustion 0% 2% 33% 36% 21% 14% 140% 46% 67% -91%Mobile Sources 0% -9% -12% 7% 2% -3% 2% -3% -8% -16%Industrial Fuel Combustion & Processes 0% -6% -47% -48% -48% -48% -49% -49% -50% -56%All Others 0% -46% -93% -93% -93% -93% -93% -93% -93% -81%
Total 0% -22% -57% -55% -56% -57% -52% -56% -56% -62%

13
New Jersey Emission Trends (PM2.5)
14
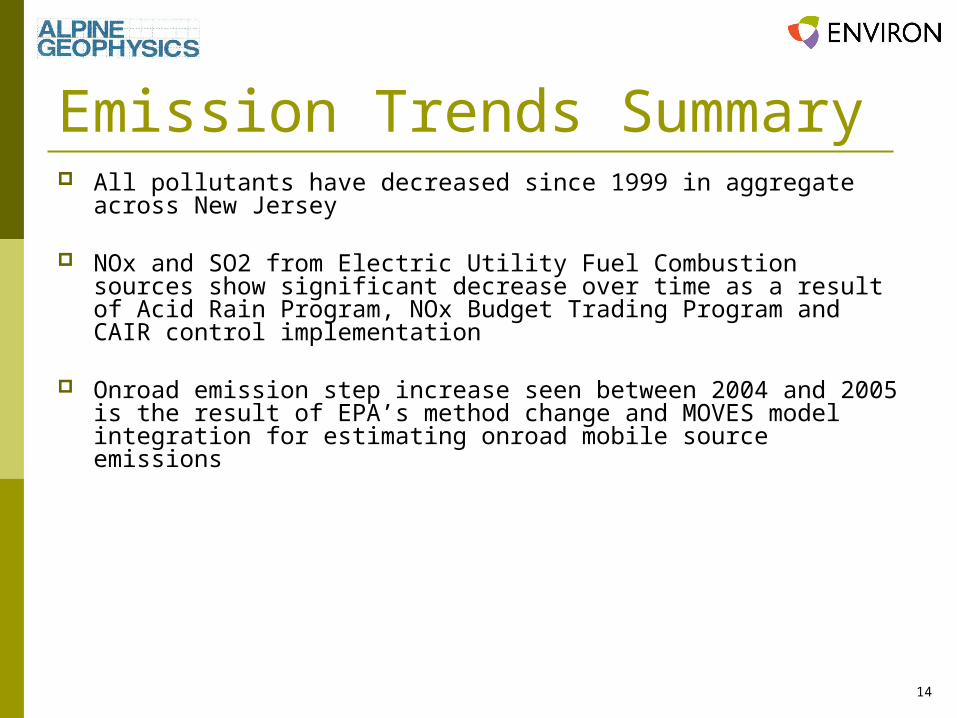
Emission Trends Summary All pollutants have decreased since 1999 in aggregate across New
Jersey
NOx and SO2 from Electric Utility Fuel Combustion sources show significant decrease over time as a result of Acid Rain Program, NOx Budget Trading Program and CAIR control implementation
Onroad emission step increase seen between 2004 and 2005 is the result of EPA’s method change and MOVES model integration for estimating onroad mobile source emissions

15
Air Quality Design Values Ozone
Annual 4th highest daily maximum 8-hour average averaged over three consecutive years
Current standard = 0.075 ppm
PM2.5 Annual Annual arithmetic mean of quarterly means averaged
over three consecutive years Current standard = 12 ug/m3
PM2.5 24-Hour Annual 98th percentile of daily averages averaged over
three consecutive years Current standard = 35 ug/m3

16
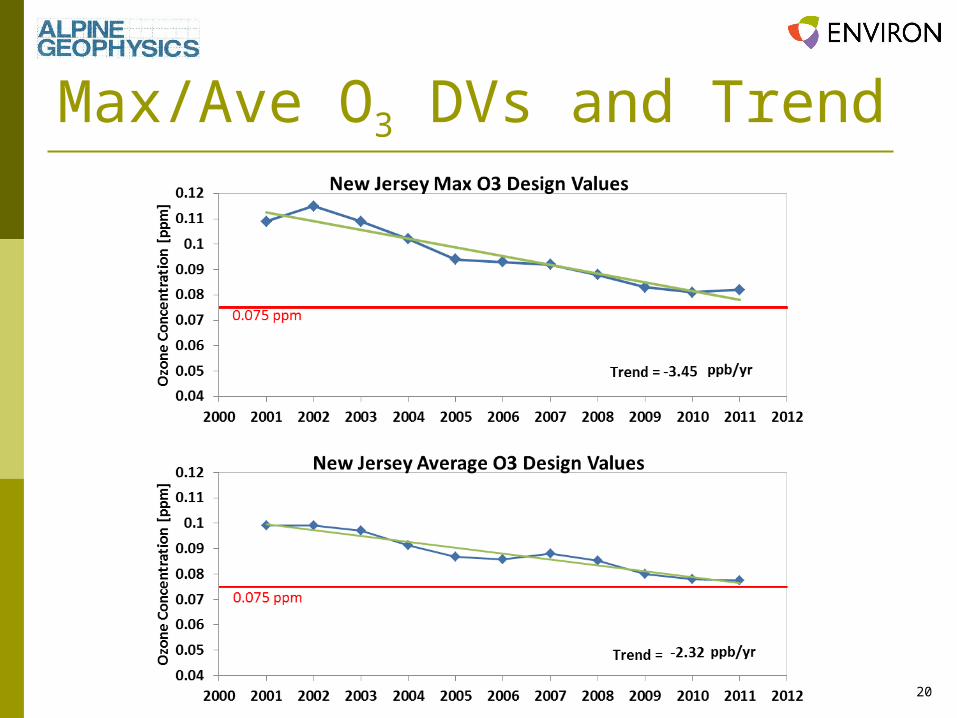
State-Wide Design Value (DV) Trends Trends in state-wide maximum DV and
average DV Max DV: Maximum DVs over all valid trend
monitoring sites in the state in each overlapping three year period
Average DV: Average of DVs over all valid trend monitoring sites in the state in each overlapping three year period
Compute linear trend via least-squares regression
17
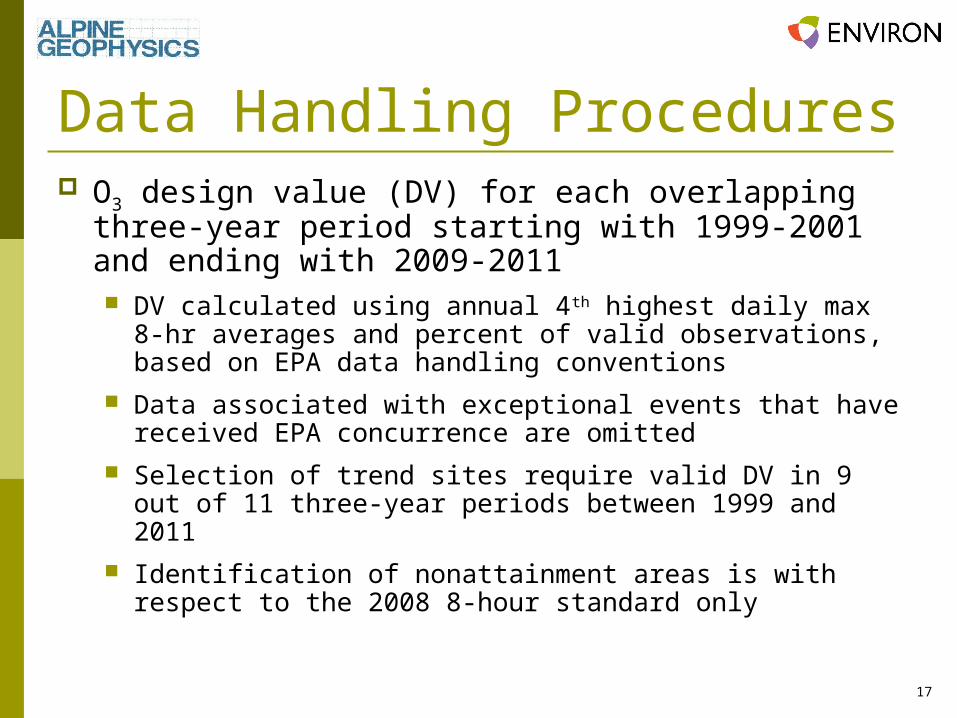
Data Handling Procedures O3 design value (DV) for each overlapping three-
year period starting with 1999-2001 and ending with 2009-2011 DV calculated using annual 4th highest daily max 8-hr
averages and percent of valid observations, based on EPA data handling conventions
Data associated with exceptional events that have received EPA concurrence are omitted
Selection of trend sites require valid DV in 9 out of 11 three-year periods between 1999 and 2011
Identification of nonattainment areas is with respect to the 2008 8-hour standard only

18
Data Handling Procedures Annual PM2.5 DV and 24-hr PM2.5 DV for each
overlapping three-year period starting with 1999-2001 and ending with 2009-2011 DV calculations based on EPA data handling conventions Data extracted from monitors that have a non-
regulatory monitoring type are omitted Selection of trend sites require valid DV in 9 out of 11
three-year periods between 1999 and 2011

19
Trend Calculation Trends based on linear least
squares fit to rolling three year design values (DVs)
Negative trend indicates improving air quality
DVs based on each 3-year period: 1999-2001, 2000-2002, … 2009-2011
Notes On plots, DVs are for three
year period ending in year shown (i.e., 2009-2011 DV plotted as 2011 value)
Ozone trend values expressed as ppb/year (1,000 ppb = 1 ppm); DVs are plotted as ppm
New York-N. New Jersey-Long Island,NY-NJ-CT Max O3 Design Values
0.04
0.05
0.06
0.07
0.08
0.09
0.1
0.11
2000 2002 2004 2006 2008 2010
Ozo
ne C
once
ntra
tion
[ppm
] Least squares trend: Slope = -2.3 ppb/yr
Scale in units of ppm
Trend in units of ppb/year
20
Max/Ave O3 DVs and Trend

21
Ozone Trends by Site in New Jersey
Note: Only monitoring sites meeting data completeness criteria listed
Monitoring Sites County2009-2011 DV
[ppm] Trend [ppm/yr]
3400710014420101 Camden, NJ 0.08 -2.61
3401100074420101 Cumberland, NJ 0.071 -2.60
3401500024420101 Gloucester, NJ 0.082 -2.29
3401700064420101 Hudson, NJ 0.076 -1.22
3401900014420101 Hunterdon, NJ 0.077 -2.25
3402100054420101 Mercer, NJ 0.078 -2.74
3402300114420101 Middlesex, NJ 0.08 -2.35
3402500054420101 Monmouth, NJ 0.079 -1.87
3402730014420101 Morris, NJ 0.075 -2.39
3402900064420101 Ocean, NJ 0.081 -3.59
3403150014420101 Passaic, NJ 0.073 -1.64
22
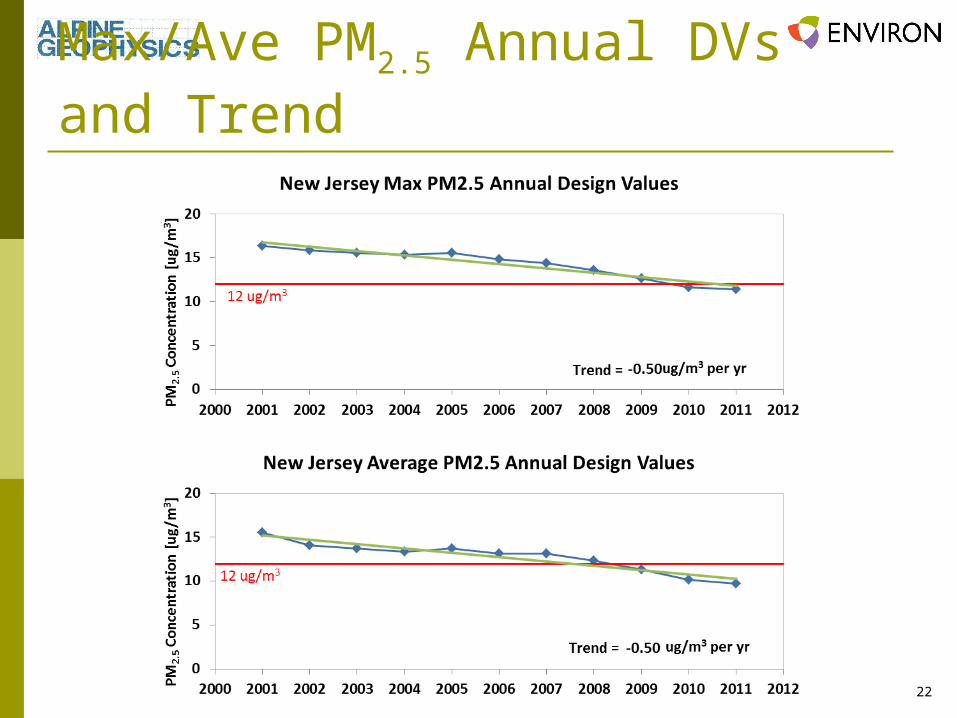
Max/Ave PM2.5 Annual DVs and Trend
23
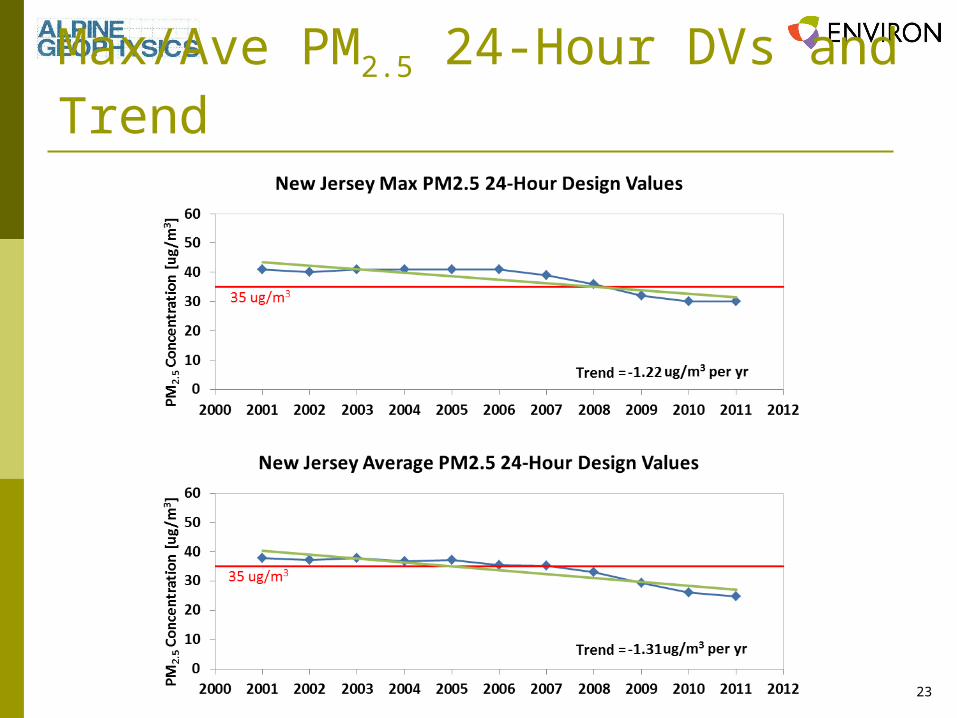
Max/Ave PM2.5 24-Hour DVs and Trend
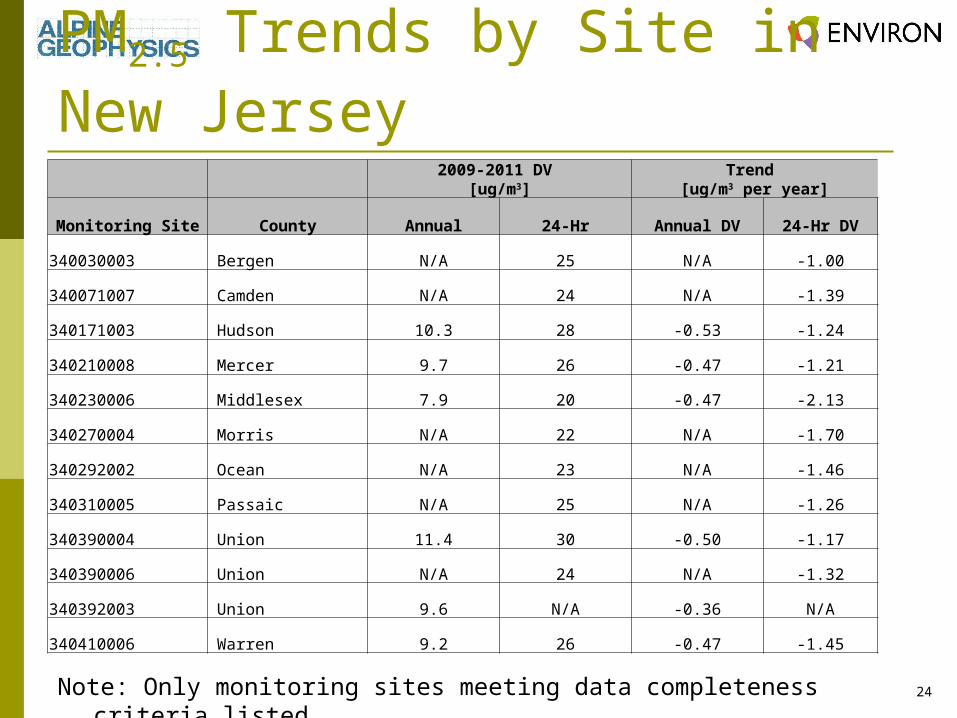
24
PM2.5 Trends by Site in New Jersey
Note: Only monitoring sites meeting data completeness criteria listed
2009-2011 DV
[ug/m3]Trend
[ug/m3 per year]
Monitoring Site County Annual 24-Hr Annual DV 24-Hr DV
340030003 Bergen N/A 25 N/A -1.00
340071007 Camden N/A 24 N/A -1.39
340171003 Hudson 10.3 28 -0.53 -1.24
340210008 Mercer 9.7 26 -0.47 -1.21
340230006 Middlesex 7.9 20 -0.47 -2.13
340270004 Morris N/A 22 N/A -1.70
340292002 Ocean N/A 23 N/A -1.46
340310005 Passaic N/A 25 N/A -1.26
340390004 Union 11.4 30 -0.50 -1.17
340390006 Union N/A 24 N/A -1.32
340392003 Union 9.6 N/A -0.36 N/A
340410006 Warren 9.2 26 -0.47 -1.45

25
Air Quality Trends Summary Average O3 and PM2.5 design values have
decreased since 1999 in New Jersey
O3 and PM2.5 design values have decreased since 1999 in all currently designated O3 and PM2.5 non-attainment areas in New Jersey