1 effect of hyperandrogenism on ovarian function 2 leandro m
TRANSCRIPT

1
Effect of hyperandrogenism on ovarian function 2
Leandro M. Velez1, Maria F. Heber
1, Silvana R. Ferreira
1, Giselle A. 3
Abruzzese1, Roxana M. Reynoso
2 and Alicia B. Motta
1 4
1 Laboratorio de Fisio-patología Ovárica, Centro de Estudios Farmacológicos y 5
Botánicos, Consejo Nacional de Investigaciones Científicas y Técnicas, Universidad de 6
Buenos Aires, Buenos Aires, Argentina 7
2 Laboratorio de Endocrinología, Departamento de Fisiología, Facultad de Medicina, 8
Universidad de Buenos Aires, Buenos Aires, Argentina 9
Reprint requests: Alicia Beatriz Motta [email protected] 10
Short title: hyperandrogenism and ovary 11
12
Page 1 of 33 Reproduction Advance Publication first posted on 12 March 2015 as Manuscript REP-15-0041
Copyright © 2015 by the Society for Reproduction and Fertility.

2
Abstract 13
The objective of the present work was to study the ovarian function when follicular 14
development is induced during a hyperandrogenic condition. Female rats were injected 15
either with chorionic gonadotropin (eCG group) to induce folliculogenesis or with eCG 16
together with dehydroepiandrosterone to induce folliculogenesis in a hyperandrogenic 17
condition (eCG+HA group). The control group was injected with vehicle. Ovarian 18
mRNA levels of the PPARγ co-activator PGC1-α, the PPARγ co-repressor NCoR, the 19
main enzymes involved in the ovarian steroidogenesis (CYP17, 3β hydroxysteroid 20
dehydrogenase (3β-HSD), 17β hydroxysteroid dehydrogenase (17β-HSD) CYP19A), 21
and cyclooxygenase 2 (COX-2) were evaluated only by Real Time-PCR . COX-2 was 22
evaluated by both Real Time-PCR and Western Blot. Serum steroid hormones and both 23
the oxidative and inflammatory status were also quantified. 24
We found that eCG-induced folliculogenesis induced increased mRNA levels of PGC1-25
α and decreased those of NCoR as compared to controls. In addition, we found increase 26
in serum estradiol levels and enhanced mRNA expression of CYP19A. A pro-27
inflammatory and a pro-oxidant status were also established. When folliculogenesis was 28
induced in a hyperandrogenic condition, the mRNA levels of the PPARγ co-repressor 29
NCoR remained higher than in controls and the pro-inflammatory and pro-oxidant 30
status were enhanced. In addition, the enzymes involved in ovarian steroidogenesis 31
were altered leading to the accumulation of testosterone and an unfavorable 32
estradiol/testosterone ratio. These alterations led to abnormal follicular development. 33
34
Page 2 of 33

3
Introduction 35
Fuel sensors, such as metabolites (e.g., glucose, fatty acids and amino acids) and 36
hormones (e.g., insulin, leptin and ghrelin), are involved in the regulation of fertility at 37
each level of the hypothalamic-pituitary-gonadal axis (Froment et al. 2006). The 38
discovery of the peroxisome proliferator-activated receptor (PPAR) family of 39
transcription factors revealed the link between lipid/glucose availability and long-term 40
metabolic adaptation (Issemann and Green 1990). PPARs have three subtypes, α, ß/δ 41
and γ (Issemann and Green 1990; Komar 2005), which are detected in the ovary of 42
several species, including the rat (Komar 2005). PPARγ is expressed primarily in the 43
granulosa cells of developing follicles (Komar and Curry 2002), where it regulates the 44
synthesis of steroid hormones (Huang 2008). At the end of follicular development, the 45
luteinizing hormone (LH) surge down-regulates the expression of ovarian PPARγ 46
(Froment et al. 2003; Komar et al. 2001). In the rat, PPARγ expression is low in newly 47
forming luteal tissue and higher in luteal tissue present from previous ovulations 48
(Komar and Curry 2002). 49
PPARγ is activated by binding either to endogenous factors (such as 50
prostaglandins (PGs) or fatty acids) or to exogenous factors (including non-steroidal 51
anti-inflammatory drugs, fibrates, polycyclic aromatic hydrocarbons, traditional 52
medicines and thiazolidinediones (such as pioglitazone and rosiglitazone)) (Banerjee 53
and Komar 2006; Huang et al. 2005; Jaradat et al. 2001; Kanayama et al. 2005; Kim et 54
al. 2005; Lim and Dey 2002; McIntyre et al. 2003; Seli and Duleba 2004; Yu et al. 55
1995). In addition, PPARγ inactivation can be prevented by thiazolidinediones (Choi et 56
al. 2010; Kono et al. 2012). 57
The binding of PPARγ to ligands modulates its transcriptional activity by 58
increasing the recruitment of co-activators, such as PGC1-α (Puigserver et al. 1998), 59
Page 3 of 33

4
but, in the absence of ligands, the recruitment of co-repressors, as NCoR, down-60
regulates the transcriptional activity of PPARγ (Yu et al. 2005). After its activation, 61
PPARγ modulates lipid metabolism (Curti et al. 2011) and the inflammatory response 62
(Celinski et al. 2012; Rezvanfar et al. 2012), whereas during folliculogenesis PPARγ 63
modulates steroidogenesis and cellular proliferation (Froment et al. 2006). Given the 64
important role of the PPARγ system in modulating endocrine and metabolic pathways, 65
the management of the PPARγ system represents a fundamental tool in treating 66
metabolic disorders. 67
PGs modulate different ovarian functions, such as the rupture of ovarian follicles 68
associated with ovulation (Husein and Kridli 2003; Medan et al. 2003) and luteolysis 69
(Motta et al. 1999; Motta et al. 2001). We have previously reported that 70
hyperandrogenism induces a pro-inflammatory status mediated by the PG system in 71
both mice (Elia et al. 2006; Luchetti et al. 2004) and rats (Amalfi et al. 2012). It has 72
been recently reported that, in breast cancer, a PPARγ agonist inhibits P450 aromatase 73
expression by means of the inhibition of the PGE pathway (Margalit et al. 2012). 74
Hyperandrogenism also induces an increase in the production of reactive oxygen 75
species (ROS) by the ovary, thus, altering oxidant-antioxidant balance (Elia et al. 76
2006; Luchetti et al. 2004; Diamanti-Kandarakis and Economou 2006; Diamanti-77
Kandarakis et al. 2008; 2009). 78
In the present work, we studied the effect of hyperandrogenism on the 79
regulation of ovarian function. Specifically, we designed a murine model that allowed 80
us to investigate events linked to early follicular development. We studied: 1) the 81
histology of ovarian tissue 2) the transcript levels of the PPARγ co-activator PGC1-α 82
and the PPARγ co-repressor NCoR, 3) the main enzymes involved in ovarian 83
steroidogenesis: CYP17, 3β hydroxysteroid dehydrogenase (3β-HSD), 17β 84
Page 4 of 33

5
hydroxysteroid dehydrogenase (17β-HSD) and CYP19A, 4) the serum levels of 85
progesterone, testosterone and estradiol, 5) the ovarian inflammatory status 86
characterized by both the gene and protein expression of cyclooxygenase 2 (COX-2), 87
the limiting enzyme of PG synthesis, and the ovarian PGE content and 6) the systemic 88
oxidant-antioxidant balance, evaluated by the lipid peroxidation index and by the 89
production of the antioxidant metabolite glutathione (GSH) in serum samples. 90
Materials and Methods 91
Animal model 92
The animal model consisted of immature (22-25 days old) female Sprague 93
Dawley rats intraperitoneally (ip) injected with 25 IU of chorionic gonadotropin (eCG; 94
Sigma-Aldrich, St Louis, MO, USA) in 0.1 ml saline solution (eCG group) (Faut et al. 95
2011). The hyperandrogenized (HA) group consisted of rats ip injected with 25 IU/rat 96
eCG together with a subcutaneous (sc) injection of 60 mg/kg body weight of 97
dehydroepiandrosterone (DHEA) (Sigma-Aldrich, USA) in 0.1 ml sesame oil (eCG+HA 98
group). The control group consisted of rats injected with vehicle (sesame oil). Rats were 99
housed under controlled temperature (22 ºC) and illumination (14 h light: 10 h dark; 100
lights on at 5:00 h) and allowed free access to Purina rat chow and water. All 101
procedures involving animals were conducted in accordance with the Animal Care and 102
Use Committee of Consejo Nacional de Investigaciones Científicas y Técnicas 103
(CONICET, Argentina). This study as approved by the Ethics Committee of the School 104
of Medicine of University of Buenos Aires (Argentina). In this model of follicular 105
development, the peak of ovarian steroidogenesis is obtained 8 h after eCG treatment 106
(Faut et al. 2011). Thus, rats were anesthetized with carbon dioxide and killed by 107
decapitation after 8 h of treatments. Trunk blood was collected and serum was separated 108
by centrifugation at 1000 g for 15 min and stored at - 80 °C until progesterone, 109
Page 5 of 33

6
estradiol, testosterone, lipid peroxidation index and GSH levels were determined. 110
Ovarian tissue from a total of 20 rats from each group was used as follows: ten freshly 111
dissected ovaries from different rats were immediately fixed in 4% (w/v) 112
paraformaldehyde for morphological studies whereas other 30 were frozen at - 80 °C. 113
Of the latter, 10 were used for mRNA analysis by real-time polymerase chain reaction 114
(Real-Time PCR), 10 for western blotting, and 10 for PGE quantification by 115
radioimmunoassay (RIA). 116
Histological studies of ovarian tissue 117
To study the effect of hyperandrogenization on early folliculogenesis, serial 118
sections of ten ovaries from each of the three groups and from different animals, fixed 119
as described above, were consecutively cut (5 µm per section), placed on gelatin-coated 120
slides (Biobond, British Biocell International, Cardiff, UK), air-dried for 2 h and fixed 121
for 5 min in acetone at 4 °C. Then, consecutive sections from each ovary were washed 122
in phosphate-buffered saline (PBS; 137 mmol/l NaCl, 2.7 mmol/l KCl, 4.3 mmol/l 123
Na2HPO4.7H2O, 1.4 mmol/l KH2PO4, pH 7.3) and stained with hematoxylin and eosin 124
(DAKO Corporation, Carpinteria, CA, USA) for histological analysis. This resulted in 125
200 sections for each ovary. Histological serial sections were analyzed independently by 126
three of the authors, and ovarian follicles were classified and quantified. Follicular 127
atresia was also quantified. 128
Gene expression analysis 129
To determine whether hyperandrogenism altered the gene expression of NCoR, 130
PGC-1α , CYP17, 3β-HSD, 17β-HSD, CYP19A and COX-2, their mRNA levels were 131
measured by Real-Time PCR analysis. Total mRNA from ovarian tissue from the 132
control, eCG and eCG+HA groups was extracted using RNAzol RT (MRC gene, 133
Molecular Research Center, Cincinnati, OH, USA) following the manufacturer’s 134
Page 6 of 33

7
instructions. cDNA was synthesized from 400 ng mRNA by using random primers. 135
Real-Time PCR analysis was performed from this cDNA by means of the real mix 136
B124-100 (Biodynamics SRL, USA) and those primers according to the analysis. The 137
amplified products were quantified by fluorescence using the Rotor Gene 6000 Corbett. 138
Results are expressed as arbitrary units. The primers are shown in Table 1. 139
Western Blotting 140
Ovarian tissue was lysed for 20 min at 4 ºC in lysis buffer (20 mM Tris-HCl, 141
pH= 8.0, 137 mM NaCl, 1% Nonidet P-40 and 10% glycerol) supplemented with 142
protease inhibitors (0.5 mM PMSF, 0.025 mM N-CBZ-L-phenylalanine chloromethyl 143
ketone, 0.025 mM N-p-tosyl-lysine chloromethyl ketone and 0.025 mM L-1-144
tosylamide-2-phenyl-ethylchloromethyl ketone). The lysate was centrifuged at 4 ºC for 145
10 min at 10,000g and the pellet discarded. Protein concentrations in the supernatant 146
were measured by the Bradford assay (Bio-Rad). After boiling for 5 min, 90 µg of each 147
protein was applied to an SDS-polyacrylamide gel (10%) and electrophoresis was 148
performed at 100 Volts for 1.5 h. The separated proteins were transferred onto 149
nitrocellulose membranes in transfer buffer (20% methanol, vol/vol; 0.19 M glycine; 150
0.025 M Tris-Base, pH= 8.3) for 1 h at 4 ºC. Blots were blocked for 1.5 h in TBS (4mM 151
Tris-HCl, pH= 7.5, 100 mM NaCl) containing bovine serum albumin (0.1%) at room 152
temperature. Rabbit polyclonal anti-COX-2 (Santa Cruz Biotechnology, Inc., USA) 153
(1:200 overnight) was used as primary antibody. Rainbow-colored protein mass markers 154
(14.3- 200 kDa, Bio-Rad) were applied to samples to determine the bands. The band 155
corresponding to COX-2 is at 72 kDa. Protein bands were visualized by incubating the 156
blots with biotin-conjugated secondary anti-rabbit IgG (1:5000, 1 h) followed by 157
streptavidin-peroxidase complex and diaminobenzidine solution. The consistency of 158
protein loading was evaluated by staining the membranes with Ponceau-S and applying 159
Page 7 of 33
8
the protein beta actin (42 kDa) (Sigma Co, USA). The intensities (area x density) of the 160
individual bands were quantified by densitometry (Model GS-700, Imaging 161
Densitometer, Bio-Rad). The experiment was independently repeated three times. 162
Results are expressed as arbitrary units. 163
Progesterone, estradiol and testosterone radioimmunoassays 164
Serum progesterone and estradiol levels were determined by specific RIA as 165
described before (Amalfi et al. 2012). Briefly, serum samples from 10 rats per treatment 166
were extracted with the same volume of diethyl ether three times. The extracts were 167
collected and evaporated in a vacuum oven and saved at - 80ºC until the RIA was 168
performed. The antibodies from progesterone and estradiol were provided by Dr 169
Niswender (Colorado State University, Fort Collins, CO, USA). Both sensitivities were 170
5–10 pg/tube. The intra- and inter-assay variations of progesterone were respectively, 171
10.9% and 12.8% for progesterone and 5.0% and 10.0% for estradiol. Results are 172
expressed as ng progesterone or estradiol/ml serum. 173
Testosterone was quantified by RIA as previously described (Amalfi et al. 2012). 174
Briefly, serum samples were extracted as described for progesterone and estradiol. The 175
utility range of the assay was 25–1600 pg. The intra-assay and inter-assay variations 176
were 7.5 and 15.1%, respectively and the cross-reaction between testosterone and 177
DHEA was < 0.01 pg. Results are expressed as pg testosterone/ml serum. 178
Prostaglandin radioimmunoassay 179
Ovarian PGE content was determined by RIA as previously reported (Motta et 180
al. 1999). Results are expressed as pg/µg protein. Protein concentration in ovarian tissue 181
was determined by the Bradford method (Bradford 1976). 182
Oxidative stress-related parameters 183
Page 8 of 33

9
Lipid peroxidation: the amount of malondialdehyde (MDA) formed from the 184
breakdown of polyunsaturated fatty acids was measured as an index of peroxidation 185
(Motta et al. 2001). Results are expressed as content of MDA (nmolar MDA formed/ml 186
serum). 187
GSH content: the antioxidant metabolite GSH was quantified as previously 188
described (Elia et al. 2006). The reduced form of GSH comprises the bulk of cellular 189
protein sulfhydryl groups. Results are expressed as µmolar GSH/ml serum. 190
Statistical analysis 191
Statistical analyses were carried out by using the Instant program (GraphPad 192
software, San Diego, CA, USA). ANOVA followed by Tukey test were used to 193
compare all pairs of columns. Bonferroni correction for multiple testing was used to 194
adjust the threshold for statistical significance to P < 0.05. 195
Results 196
Ovarian histology 197
Ovaries from the control group showed a total of 5,440 + 120 follicles 198
while ovaries from the eCG group had 11,115 + 150 follicles and those from the 199
eCG+HA group had 8,350 + 140 follicles. The ovarian follicles were classified and 200
quantified as primordial (PrF), primary (PF), secondary (SF) and antral follicles (AF) 201
(Fig. 1A). The percentage of PrF was higher in the eCG group than in controls and that 202
corresponding to eCG+HA group was higher than in the eCG and control groups (Fig 203
1A). PF was lower in the eCG+HA group than in the eCG and control groups (Fig. 1A). 204
The percentage of atretic follicles decreased in the eCG as compared with control (Fig. 205
1B), while that in the eCG+HA group did not differ from that in the eCG or control 206
groups (Fig. 1B). 207
Page 9 of 33

10
The histological examination of ovaries from the eCG group showed the 208
following: PrF were located in the ovarian cortex, formed by an oocyte surrounded by a 209
flattened layer of pre-granulosa cells (Fig. 1C); PF presented at least one cuboidal layer 210
of granulosa cells (Fig. 1C); SF showed more than one layer of cuboidal granulosa cells 211
and an incipient theca layer (Fig.1D); and AF follicles presented a cavity called antrum, 212
a fully grown oocyte with the surrounded zona pellucida, and a basal lamina between 213
granulosa and theca cells (Fig. 1E); AF sowed good differentiation of the basal lamina 214
(Fig. 1F). 215
The histological examination of ovaries from the eCG+HA group showed 216
increased follicular atresia, detected mainly in antral follicles. In addition, degenerative 217
changes were observed in granulosa cells which shrank and became evident as pyknotic 218
bodies (Fig. 1G). In a later stage of atresia the oocyte showed signs of reinitiated 219
meiosis and fragmentation with decreased or absent granulosa layer (Fig. 1H). In 220
addition, we found invasion of the theca cells over granulosa cells (Fig. 1I). 221
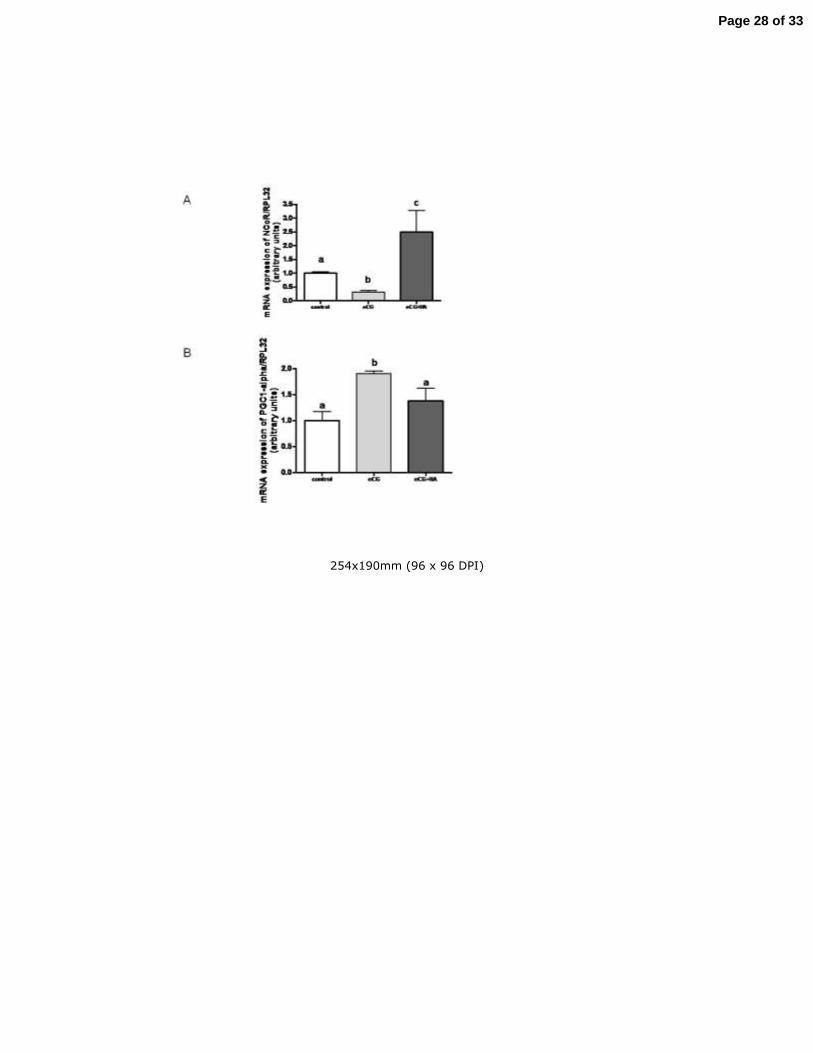
Effect of hyperandrogenism on the PPAR system 222
The induction of ovarian folliculogenesis decreased the mRNA levels of the 223
PPARγ co-repressor NCoR (Fig.2A) and increased the mRNA levels of the PPARγ co-224
activator, PGC-1α (Fig. 2B) as compared to controls. In the hyperandrogenic condition 225
(eCG+HA group), the mRNA levels of NCoR increased and remained high relative to 226
those of the control and eCG groups (Fig. 2A), whereas the mRNA levels of PGC-1α 227
decreased to control values (Fig. 2B). 228
Effect of hyperandrogenism on enzymes involved in the ovarian steroidogenesis 229
Folliculogenesis induced by eCG did not modify the mRNA levels of CYP17 230
(Fig. 3A), 3β-HSD (Fig. 3B) or 17β-HSD (Fig. 3C) but increased the mRNA levels of 231
CYP19A, an enzyme that synthesizes estradiol from testosterone (Fig. 3D). In the 232
Page 10 of 33

11
hyperandrogenic condition, the mRNA levels of CYP17, 3β-HSD and 17β-HSD (Fig. 233
3A-C respectively) significantly increased as compared to both the control and eCG 234
groups whereas those of CYP19A decreased to control values (Fig 3D). 235
Effect of hyperandrogenism on progesterone, testosterone and estradiol levels 236
Folliculogenesis induced by eCG increased serum progesterone levels (Fig. 4A), 237
did not modify serum testosterone levels (Fig. 4B) and increased serum estradiol levels 238
as compared to controls (Fig 4C). In the hyperandrogenic condition, progesterone levels 239
decreased to control values (Fig. 4A), while testosterone levels increased as compared 240
to both the control and eCG groups (Fig. 4B) and serum estradiol levels increased as 241
compared to the control and eCG groups (Fig. 4C). It is important to note that the 242
estradiol/testosterone ratio, a marker of follicular development, increased with the 243
induction of folliculogenesis (Fig. 4D) but decreased in the hyperandrogenized 244
condition as compared to both the control and eCG groups (Fig. 4D). 245
Effect of hyperandrogenism on the ovarian pro-inflammatory status 246
The ovarian pro-inflammatory status was evaluated by the mRNA and protein 247
levels of COX-2 and by the ovarian content of PGE. Folliculogenesis induced by eCG 248
increased both mRNA (Fig. 5A) and protein (Fig. 5B-D) levels of COX-2 and ovarian 249
PGE content (Fig. 5E) as compared to control, whereas folliculogenesis induced in a 250
hyperandrogenic condition (eCG+HA) increased both mRNA (Fig. 5A) and protein 251
(Fig.5B-D) levels of COX-2 and PGE content (Fig. 5E) as compared to the eCG group. 252
Effect of hyperandrogenism on circulating oxidant-antioxidant balance 253
Regarding the ovarian oxidant-antioxidant balance, the lipid peroxidation index 254
was evaluated by the content of ovarian MDA and the antioxidant response by the 255
ovarian content of GSH. Neither MDA content nor GSH content were modified by the 256
induction of folliculogenesis (Fig. 6A). However, when folliculogenesis was induced in 257
Page 11 of 33
12
a hyperandrogenic condition, MDA content was higher and GSH content was lower 258
than in the eCG and control groups (Fig. 6A and 6B, respectively). 259
Discussion 260
The battery of animal models used for the study of polycystic ovaries have 261
allowed a focus on different aspects of the pathology. In that context, the letrozole 262
model in rats is suitable to mimic the ovarian features of human PCOS, while the 263
dihydrotestosterone model is suitable for studies of both ovarian and metabolic features 264
of the syndrome (Mannerås et al. 2007). In agreement with these findings, our previous 265
findings (Elia et al. 2006; Faut et al. 2011; Luchetti et al. 2004) and data presented 266
here show that the DHEA model in rats induces a polycystic phenotype that allows to 267
focus in both ovarian and metabolic aspects. 268
The PPARγ system is strongly expressed in granulosa cells where it regulates 269
early folliculogenesis (Froment et al. 2006; Komar 2005). For this reason, the PPARγ 270
system has been the focus of several studies on physiological and metabolic/endocrine 271
disorders. In fact, a direct association between polymorphisms in the genes encoding 272
PPARs and hyperandrogenism has been recently reported (San-Millan and Escobar-273
Morreale 2010). It has also been reported that the treatment with synthetic PPARγ 274
ligands improves endocrine and metabolic disorders in women with Polycystic Ovary 275
Syndrome (PCOS) (Brannian et al. 2008; Girard 2001; Iuorno and Nestler 1999; Minge 276
et al. 2006; Seli and Duleba 2004). The PPARγ system regulates the expression of 277
genes required for follicular development, ovulation, oocyte maturation and corpus 278
luteum development (Feige et al. 2005; Froment et al. 2006; Jablonka-Shariff et al. 279
1999; Lim et al. 1999). Long et al. (2009) found that mRNA for PPARγ was 280
undetectable on day 1, low from days 5-14, and increased by day 19 post-partum. 281
Although FSH receptor has also been early detected, it has been found that FSH is not a 282
Page 12 of 33

13
primary factor initiating the expression of PPARγ and that other agents play a role in 283
activating its expression in the ovary (Long et al. 2009). Although the complete 284
mechanism of ovarian PPARγ activation remains unknown, it has been reported that to 285
act, PPARγ has to be free from its inhibitor NCoR and to recruit its activator PGC1-α 286
(Feige et al. 2005; Froment et al. 2006; Jablonka-Shariff et al. 1999; Lim et al. 1999). 287
In a previous report (Faut et al. 2011) we found that during early 288
folliculogenesis gene and protein expression of PPARγ and the protein StAR are 289
increased as compared to controls. In the present study, we found that the induction of 290
follicular development, altered steroidogenic enzymes downstream STAR: whereas 291
CYP17, 3β-HSD and 17β-HSD were not modified by eCG treatment, CYP19A, gene 292
corresponding the enzyme that converts testosterone to estradiol, increased. These data 293
are in agreement with that reported by Gougeon (1996) that estradiol levels are essential 294
during follicular development. In contrast, we have previously reported that when 295
folliculogenesis is induced in a hyperandrogenic condition, the levels of both PPARγ 296
and StAR decrease to control values (Faut et al. 2011), and here, we showed that all 297
enzymes downstream to pregnenolone synthesis, i.e. CYP17, 3β-HSD and 17 β-HSD 298
remained higher than in the control and eCG groups, except that corresponding to 299
CYP19A which showed the same pattern as the control group. Moreover, serum 300
progesterone levels that increases during the induction of folliculogenesis, decreases to 301
control values during the hyperandrogenic condition. These data suggest the stimulation 302
of ovarian steroidogenesis and the accumulation of testosterone during the induction of 303
follicular development in a hyperandrogenic condition. This accumulation of 304
testosterone and the adverse estradiol/testosterone ratio, which have been reported to 305
impair follicular development (Gougeon et al. 1996), result in avoiding the production 306
of the dominant follicle able to ovulate. In addition, Dumesic et al. (2007) reported that 307
Page 13 of 33

14
an altered estradiol/testosterone ratio is responsible for poor oocyte quality in prenatally 308
hyperandrogenized female rhesus monkeys and sheep. Furthermore, Amato et al. (2011) 309
reported that a low estradiol/testosterone ratio is associated with oligo-anovulatory 310
cycles in women with PCOS. In agreement with these findings, here, we found that 311
hyperandrogenism generates altered follicular development, represented by an increased 312
percentage of PrF and a decreased percentage of PF, suggesting accelerated follicular 313
recruitment but in detriment of follicle development. Not only the percentage but also 314
the total number of follicles was modified by hyperandrogenism. Ovaries from the eCG 315
group showed an increased number of total follicles as compared to controls. This 316
increased number of follicles decreased by hyperandrogenism as compared to those 317
from the eCG group but remained higher than those from the control group. 318
The data of the present study demonstrate, for the first time, that folliculogenesis 319
induced by eCG in prepubertal rats results in increased gene expression of the PPARγ 320
co-activator PGC1-α and in decreased gene expression of the co-repressor NCoR as 321
compared to controls and that in a hyperandrogenic condition, NCoR remains higher 322
than in both the control and eCG groups and PGC1-α reaches control values. These 323
results suggest that folliculogenesis induced by eCG activates the PPARγ transcriptional 324
system. These findings and the fact that during the hyperandrogenic condition the 325
mRNA levles of NCoR remain higher than controls and that those of PGC1-α reach 326
control values suggest that the decreased ovarian PPARγ system induced by 327
hyperandrogenism might be responsible for an ovarian environment unfavorable to 328
generate pre-ovulatory follicles. 329
The role of PPARγ in ovarian steroidogenesis is associated with increased COX-330
2 activity, which, in turn, enhances PG synthesis prior to ovulation (Banerjee and 331
Komar 2006; Brannian et al. 2008; Duffy and Stouffer 2001; Kim et al. 2008; Komar 332
Page 14 of 33

15
2005; Komar et al. 2001). In fact, we found that folliculogenesis induction increased 333
both gene and protein expression of ovarian COX-2 and that this correlated with 334
enhanced ovarian PGE content. We also found that hyperandrogenism exacerbated 335
these effects, a fact in agreement with our previous findings (Amalfi et al. 2012). 336
Taking into account the results observed here both in the PPARγ system and the 337
estradiol/testosterone ratio, we suggest that high COX-2 expression and PG synthesis 338
would down-regulate the PPARγ system, as in other systems (Banerjee and Komar 339
2006). 340
During early folliculogenesis, apoptosis plays a fundamental process during 341
early folliculogenesis. We have previously demonstrated that acute hyperandrogenism 342
induces a pro-apoptotic status (Faut et al. 2011), which alters normal folliculogenesis. 343
Therefore, prenatally hyperandrogenized rats display increased ovarian oxidative stress 344
and an anovulatory estrous cycle during their adult life (Amalfi et al. 2012). In the 345
present study, we found that acute hyperandrogenism induces an imbalance in the 346
oxidant-antioxidant ratio characterized by increased systemic lipid peroxidation and 347
decreased GSH levels. These data reveal a response of the antioxidant defenses against 348
hyperandrogenism, which is in agreement with the so-called “controlled response of 349
GSH” previously reported (Amalfi et al. 2012). 350
In summary, our results demonstrate for the first time that an acute 351
hyperandrogenic condition during follicular development alters the gene expression of 352
the PPARγ co-represor NCoR and co-activator PGC-1α, generating an unfavorable 353
environment which involves the dysregulation of the PPARγ system. We also found that 354
the hyperandrogenic condition during follicular development enhances ovarian 355
steroidogenesis, with the accumulation of testosterone and an activation of the pro-356
inflammatory status and that it leads to establish a systemic pro-oxidant status. 357
Page 15 of 33
16
Declaration of interest 358
The authors declare that there is no conflict of interest that could be perceived 359
as prejudicing the impartiality of the research reported. 360
Funding 361
This study was supported by Agencia Nacional de Promoción Científica y 362
Tecnológica (Grant PICT 71/2010; PICT 577/2012 and PICT 689/2013) and Consejo 363
Nacional de Investigaciones Científicas y Técnicas (CONICET) PIP 185, Argentina. 364
Acknowledgments 365
We thank Enzo Cuba and Marcela Marquez for their technical support in animal 366
care. 367
368
Page 16 of 33

17
References 369
Amalfi S, Velez LM, Heber MF, Vighi S, Ferreira SR, Orozco AV, Pignataro O & 370
Motta AB 2012 Prenatal hyperandrogenization induces metabolic and endocrine 371
alterations which depend on the levels of testosterone exposure. PloS One 7 372
e37658. 373
Amato MC, Verghi M, Nucera M, Galluzzo A & Giordano C 2011 Low estradiol-to-374
testosterone ratio is associated with oligo-anovulatory cycles and atherogenic 375
lipidic pattern in women with polycystic ovary syndrome. Gynecological 376
Endocrinology 27 579-586. 377
Banerjee J & Komar CM 2006 Effects of luteinizing hormone on peroxisome 378
proliferator-activated receptor gamma in the rat ovary before and after the 379
gonadotropin surge. Reproduction 131 93-101. 380
Bradford MM 1976 A rapid and sensitive method for the quantitation of microgram 381
quantities of protein utilizing the principle of protein-dye binding. Analytical 382
Biochemistry 72 248-254. 383
Brannian JD, Eyster KM, Weber M & Diggins M 2008 Pioglitazone administration 384
alters ovarian gene expression in aging obese lethal yellow mice. Reproductive 385
Biology and Endocrinology 6 10. 386
Celinski K, Dworzanski T, Fornal R, Korolczuk A, Madro A & Slomka M 2012 387
Comparison of the anti-inflammatory and therapeutic actions of PPAR-gamma 388
agonists rosiglitazone and troglitazone in experimental colitis. Journal of 389
Physiology and Pharmacology 63 631-640. 390
Curti ML, Jacob P, Borges MC, Rogero MM & Ferreira SR 2011 Studies of gene 391
variants related to inflammation, oxidative stress, dyslipidemia, and obesity: 392
implications for a nutrigenetic approach. Journal of Obesity 2011 497401. 393
Page 17 of 33

18
Choi JH, Banks AS, Estall JL, Kajimura S, Bostrom P, Laznik D, Ruas JL, 394
Chalmers MJ, Kamenecka TM, Bluher M, Griffin PR & Spiegelman BM 395
2010 Anti-diabetic drugs inhibit obesity-linked phosphorylation of PPARgamma 396
by Cdk5. Nature 466 451-456. 397
Diamanti-Kandarakis E & Economou F 2006 Stress in women: metabolic syndrome 398
and polycystic ovary syndrome. Annals of the New York Academy of Sciences 399
1083 54-62. 400
Duffy DM & Stouffer RL 2001 The ovulatory gonadotrophin surge stimulates 401
cyclooxygenase expression and prostaglandin production by the monkey follicle. 402
Molecular Human Reproduction 7 731-739. 403
Dumesic DA, Abbott DH & Padmanabhan V 2007 Polycystic ovary syndrome and its 404
developmental origins. Reviews in Endocrine & Metabolic Disorders 8 127-141. 405
Elia E, Sander V, Luchetti CG, Solano ME, Di Girolamo G, Gonzalez C & Motta 406
AB 2006 The mechanisms involved in the action of metformin in regulating 407
ovarian function in hyperandrogenized mice. Molecular Human Reproduction 408
12 475-481. 409
Faut M, Elia EM, Parborell F, Cugnata NM, Tesone M & Motta AB 2011 410
Peroxisome proliferator-activated receptor gamma and early folliculogenesis 411
during an acute hyperandrogenism condition. Fertility and Sterility 95 333-337. 412
Feige JN, Gelman L, Tudor C, Engelborghs Y, Wahli W & Desvergne B 2005 413
Fluorescence imaging reveals the nuclear behavior of peroxisome proliferator-414
activated receptor/retinoid X receptor heterodimers in the absence and presence 415
of ligand. Journal of Biological Chemistry 280 17880-17890. 416
Froment P, Fabre S, Dupont J, Pisselet C, Chesneau D, Staels B & Monget P 2003 417
Expression and functional role of peroxisome proliferator-activated receptor-418
Page 18 of 33

19
gamma in ovarian folliculogenesis in the sheep. Biology of Reproduction 69 419
1665-1674. 420
Froment P, Gizard F, Defever D, Staels B, Dupont J & Monget P 2006 Peroxisome 421
proliferator-activated receptors in reproductive tissues: from gametogenesis to 422
parturition. Journal of Endocrinology 189 199-209. 423
Girard J 2001 [Mechanisms of action of thiazolidinediones]. Diabetes and Metabolism 424
27 271-278. 425
Gougeon A 1996 Regulation of ovarian follicular development in primates: facts and 426
hypotheses. Endocrine Reviews 17 121-155. 427
Huang JC 2008 The role of peroxisome proliferator-activated receptors in the 428
development and physiology of gametes and preimplantation embryos. PPAR 429
Res 2008 732303. 430
Huang TH, Kota BP, Razmovski V & Roufogalis BD 2005 Herbal or natural 431
medicines as modulators of peroxisome proliferator-activated receptors and 432
related nuclear receptors for therapy of metabolic syndrome. Basic & Clinical 433
Pharmacology & Toxicology 96 3-14. 434
Husein MQ & Kridli RT 2003 Effect of progesterone prior to GnRH-PGF2alpha 435
treatment on induction of oestrus and pregnancy in anoestrous Awassi ewes. 436
Reprod Domest Anim 38 228-232. 437
Issemann I & Green S 1990 Activation of a member of the steroid hormone receptor 438
superfamily by peroxisome proliferators. Nature 347 645-650. 439
Iuorno MJ & Nestler JE 1999 The polycystic ovary syndrome: treatment with insulin 440
sensitizing agents. Diabetes Obes Metab 1 127-136. 441
Page 19 of 33

20
Jablonka-Shariff A, Ravi S, Beltsos AN, Murphy LL & Olson LM 1999 Abnormal 442
estrous cyclicity after disruption of endothelial and inducible nitric oxide 443
synthase in mice. Biology of Reproduction 61 171-177. 444
Jaradat MS, Wongsud B, Phornchirasilp S, Rangwala SM, Shams G, Sutton M, 445
Romstedt KJ, Noonan DJ & Feller DR 2001 Activation of peroxisome 446
proliferator-activated receptor isoforms and inhibition of prostaglandin H(2) 447
synthases by ibuprofen, naproxen, and indomethacin. Biochemical 448
Pharmacology 62 1587-1595. 449
Kanayama T, Kobayashi N, Mamiya S, Nakanishi T & Nishikawa J 2005 Organotin 450
compounds promote adipocyte differentiation as agonists of the peroxisome 451
proliferator-activated receptor gamma/retinoid X receptor pathway. Molecular 452
Pharmacology 67 766-774. 453
Kim J, Sato M, Li Q, Lydon JP, Demayo FJ, Bagchi IC & Bagchi MK 2008 454
Peroxisome proliferator-activated receptor gamma is a target of progesterone 455
regulation in the preovulatory follicles and controls ovulation in mice. 456
Molecular and Cellular Biology 28 1770-1782. 457
Kim JH, Yamaguchi K, Lee SH, Tithof PK, Sayler GS, Yoon JH & Baek SJ 2005 458
Evaluation of polycyclic aromatic hydrocarbons in the activation of early growth 459
response-1 and peroxisome proliferator activated receptors. Toxicological 460
Sciences 85 585-593. 461
Komar CM 2005 Peroxisome proliferator-activated receptors (PPARs) and ovarian 462
function--implications for regulating steroidogenesis, differentiation, and tissue 463
remodeling. Reproductive Biology and Endocrinology 3 41. 464
Page 20 of 33

21
Komar CM, Braissant O, Wahli W & Curry TE, Jr. 2001 Expression and 465
localization of PPARs in the rat ovary during follicular development and the 466
periovulatory period. Endocrinology 142 4831-4838. 467
Komar CM & Curry TE, Jr. 2002 Localization and expression of messenger RNAs 468
for the peroxisome proliferator-activated receptors in ovarian tissue from 469
naturally cycling and pseudopregnant rats. Biology of Reproduction 66 1531-470
1539. 471
Kono T, Ahn G, Moss DR, Gann L, Zarain-Herzberg A, Nishiki Y, Fueger PT, 472
Ogihara T & Evans-Molina C 2012 PPAR-gamma activation restores 473
pancreatic islet SERCA2 levels and prevents beta-cell dysfunction under 474
conditions of hyperglycemic and cytokine stress. Molecular Endocrinology 26 475
257-271. 476
Lim H & Dey SK 2002 A novel pathway of prostacyclin signaling-hanging out with 477
nuclear receptors. Endocrinology 143 3207-3210. 478
Lim H, Gupta RA, Ma WG, Paria BC, Moller DE, Morrow JD, DuBois RN, 479
Trzaskos JM & Dey SK 1999 Cyclo-oxygenase-2-derived prostacyclin 480
mediates embryo implantation in the mouse via PPARdelta. Genes and 481
Development 13 1561-1574. 482
Long MJ, Sairam MR & Komar CM 2009 Initiation of the expression of peroxisome 483
proliferator-activated receptor gamma (PPAR gamma) in the rat ovary and the 484
role of FSH. Reproductive Biology and Endocrinology 7 145. 485
Luchetti CG, Solano ME, Sander V, Arcos ML, Gonzalez C, Di Girolamo G, 486
Chiocchio S, Cremaschi G & Motta AB 2004 Effects of 487
dehydroepiandrosterone on ovarian cystogenesis and immune function. Journal 488
of Reproductive Immunology 64 59-74. 489
Page 21 of 33

22
Mannerås L, Cajander S, Holmäng A, Seleskovic Z, Lystig T, Lönn M, Stener- 490
Victorin E 2007 A new rat model exhibiting both ovarian and metabolic 491
characteristics of polycystic ovary syndrome. Endocrinology 148 3781-91. 492
Margalit O, Wang D & Dubois RN 2012 PPARgamma agonists target aromatase via 493
both PGE2 and BRCA1. Cancer Prevention Research (Philadelphia, Pa.) 5 494
1169-1172. 495
McIntyre TM, Pontsler AV, Silva AR, St Hilaire A, Xu Y, Hinshaw JC, 496
Zimmerman GA, Hama K, Aoki J, Arai H & Prestwich GD 2003 497
Identification of an intracellular receptor for lysophosphatidic acid (LPA): LPA 498
is a transcellular PPARgamma agonist. Proceedings of the National Academy of 499
Sciences of the United States of America 100 131-136. 500
Medan MS, Watanabe G, Sasaki K, Nagura Y, Sakaime H, Fujita M, Sharawy S & 501
Taya K 2003 Effects of passive immunization of goats against inhibin on 502
follicular development, hormone profile and ovulation rate. Reproduction 125 503
751-757. 504
Minge CE, Ryan NK, Van Der Hoek KH, Robker RL & Norman RJ 2006 505
Troglitazone regulates peroxisome proliferator-activated receptors and inducible 506
nitric oxide synthase in murine ovarian macrophages. Biology of Reproduction 507
74 153-160. 508
Motta AB, Estevez A & de Gimeno MF 1999 The involvement of nitric oxide in 509
corpus luteum regression in the rat: feedback mechanism between prostaglandin 510
F(2alpha) and nitric oxide. Molecular Human Reproduction 5 1011-1016. 511
Motta AB, Estevez A, Franchi A, Perez-Martinez S, Farina M, Ribeiro ML, 512
Lasserre A & Gimeno MF 2001 Regulation of lipid peroxidation by nitric 513
Page 22 of 33

23
oxide and PGF2alpha during luteal regression in rats. Reproduction 121 631-514
637. 515
Padmanabhan V & Veiga-Lopez A 2011 Developmental origin of reproductive and 516
metabolic dysfunctions: androgenic versus estrogenic reprogramming. Seminars 517
in Reproductive Medicine 29 173-186. 518
Puigserver P, Wu Z, Park CW, Graves R, Wright M & Spiegelman BM 1998 A 519
cold-inducible coactivator of nuclear receptors linked to adaptive thermogenesis. 520
Cell 92 829-839. 521
Rezvanfar MA, Ahmadi A, Saadi HA, Baeeri M & Abdollahi M 2012 Mechanistic 522
links between oxidative/nitrosative stress and tumor necrosis factor alpha in 523
letrozole-induced murine polycystic ovary: biochemical and pathological 524
evidences for beneficial effect of pioglitazone. Human and Experimental 525
Toxicology 31 887-897. 526
San-Millan JL & Escobar-Morreale HF 2010 The role of genetic variation in 527
peroxisome proliferator-activated receptors in the polycystic ovary syndrome 528
(PCOS): an original case-control study followed by systematic review and meta-529
analysis of existing evidence. Clinical Endocrinology 72 383-392. 530
Seli E & Duleba AJ 2004 Treatment of PCOS with metformin and other insulin-531
sensitizing agents. Curr Diab Rep 4 69-75. 532
Yu C, Markan K, Temple KA, Deplewski D, Brady MJ & Cohen RN 2005 The 533
nuclear receptor corepressors NCoR and SMRT decrease peroxisome 534
proliferator-activated receptor gamma transcriptional activity and repress 3T3-535
L1 adipogenesis. Journal of Biological Chemistry 280 13600-13605. 536
Page 23 of 33
24
Yu K, Bayona W, Kallen CB, Harding HP, Ravera CP, McMahon G, Brown M & 537
Lazar MA 1995 Differential activation of peroxisome proliferator-activated 538
receptors by eicosanoids. Journal of Biological Chemistry 270 23975-23983. 539
540
541
542
Page 24 of 33

Legends of figures
Figure 1. Figure 1A: Percentages of the different ovarian follicles present in the ovaries of
control, eCG and eCG+HA rats. aa≠b
a≠c
a p<0,05; a
b≠b
b, p< 0.05. Figure 1B: Percentage of
atretic follicles found in the ovaries of the three groups of rats. a≠b≠c p<0,05. Figure 1C: PrF
(thin arrows) and PF (thick arrows) from an ovary of a rat from the eCG group rats.
Magnification: x100. Figure 1D: SF (black arrows) from an ovary of a rat of the eCG group.
Magnification: x40. Figure 1E: A Healthy antral follicle from a rat of the eCG group. Black
arrows show the lamina basal between granulosa (GC) and theca (TC) cells. Magnification:
x100. Figure 1F: An atretic antral follicle from a rat of the eCG+HA group. Black arrows
show some of the numerous pyknotic bodies present throughout the granulosa layer.
Magnification: x100. Figure 1G: An antral follicle from a rat of the eCG+HA group rats in a
later stage of atresia. Note the absence of granulosa layer and the deformation of the oocyte.
Magnification: x100. Figure 1H: Healthy antral follicle from a rat of the eCG group showing
the basal lamina (black arrows) between granulosa (GC) and theca (TC) cells. Magnification:
x125. Figure 1I: A non-healthy antral follicle from a rat of the eCG+HA group showing the
invasion (black arrows) of theca layer (TC) over granulosa (GC) cells. Magnification: x100
Figure 2. Effect of hyperandrogenism on the Peroxisome Proliferator-Activated
Receptor gamma (PPARγ) system. Graph corresponding to the integrated optical density of
(A) mRNA of the PPARγ inhibitor NCoR from the control, eCG and eCG+HA groups
determined by Real Time Polymerase Chain Reaction (Real-Time PCR); a vs b P < 0.001, a
vs b and b vs c P < 0.0001 by ANOVA test and (B) mRNA of the PPARγ activator PGC1-α,
a vs b P < 0.001 by ANOVA test. Each column represents the mean + SEM of 10
measurements from different animals.
Figure 3. Effect of hyperandrogenism on enzymes involved in ovarian steroidogenesis.
Graph corresponding to the integrated optical density of mRNA from the control, eCG and
Page 25 of 33

eCG+HA groups determined by Real-Time Polymerase Chain Reaction (Real-Time PCR) of
(A) CYP17, a vs b P< 0.001, (B) 3β-HSD a vs b P< 0.001, (C) 17β-HSD a vs b P< 0.0001
and (D) CYP19A, a vs b P< 0.0001 by ANOVA test. Each column represents the mean +
SEM of 10 measurements from different animals.
Figure 4. Effect of hyperandrogenism on serum progesterone, testosterone and estradiol
levels and estradiol/testosterone ratio. Serum levels of (A) progesterone, (B) testosterone,
(C) estradiol and (D) estradiol/testosterone ratio from the control, eCG and eCG+HA groups.
Each column represents the mean + SEM of 10 measurements from different animals: a vs b
P < 0.001¸ b vs c P < 0.0001 by ANOVA.
Figure 5. Effect of hyperandrogenism on the inflammatory status. (A) Graph
corresponding to the integrated optical density of mRNA of Cyclooxygenase-2 (COX-2)
from the control, eCG and eCG+HA groups determined by Real Time Polymerase Chain
Reaction (Real-Time PCR). Each column represents the mean + SEM of 10 measurements
from different animals: a vs b P < 0.0001; b vs c P < 0.0001 by ANOVA. (B) A
representative Western Blot corresponding to protein expression of COX-2 from the control,
eCG and eCG+HA groups compared to Actin (C), lane 1= control, lane 2= eCG and lane3=
eCG+HA, and (D) Graph corresponding to the integrated optical density of COX-2 protein
from the control, eCG and eCG+HA groups determined by Western Blot. Each column
represents the mean + SEM of 10 measurements from different animals: a vs b P < 0.0001¸ b
vs c P < 0.0001 by ANOVA. (E) Ovarian content of prostaglandin E (PGE) determined by
radioimmunoassay. Each column represents the mean + SEM of 10 measurements from
different animals: a vs b P < 0.0001¸ b vs c P < 0.0001 by ANOVA.
Figure 6. Effect of hyperandrogenism on oxidative stress. (A) Lipid peroxidation was
evaluated by the quantification of malondialdehyde (MDA) levels and (B) concentration of
antioxidant metabolite glutathione (GSH) from the control, eCG and eCG+HA groups. Each
column represents the mean + SEM of 10 measurements from different animals, a vs b P <
0.0001 by ANOVA.
Page 26 of 33

254x190mm (96 x 96 DPI)
Page 27 of 33
254x190mm (96 x 96 DPI)
Page 28 of 33

254x190mm (96 x 96 DPI)
Page 29 of 33

254x190mm (96 x 96 DPI)
Page 30 of 33

254x190mm (96 x 96 DPI)
Page 31 of 33

254x190mm (96 x 96 DPI)
Page 32 of 33

Table 1: List of primers used in Real Time PCR
Gene Primer Forward (5’ – 3’) Primer Reverse (5’ – 3’)
NCOR TAT CGG AGC CAT CTT CCC AC ACT TGG GTA TCC TGG GGT TG
PGC-1 AAT GCA GCG GTC TTA GCA CT GTG TGA GGA GGG TCA TCG TT
COX-2 ATG AGT ACC GCA AAC GCT TC CCC CAA AGA TAG CAT CTG GA
RPL32 TGG TCC ACA ATG TCA AGG CAA AAC AGG CAC ACA AGC
CYP17a TCT CAT TAC ACC CAC GCA GA CGG GGC AGT TGT TTA TCA TC
3βHSD GAC ACC CCT CAC CAA AGC TA TTG TAA AAT GGA CGC AGC AG
17βHSD TCT CAT TAC ACC CAC GCA GA CGG GGC AGT TGT TTA TCA TC
CYP19 CCT GGC AAG CAC TCC TTA TC CCA CGT CTC TCA GCG AAA AT
Page 33 of 33