1 detecting subtle changes in structure chris rorden –voxel based morphometry segmentation –...
TRANSCRIPT

1
Detecting Subtle Changes in Structure
Chris Rorden– Voxel Based Morphometry
Segmentation – identifying gray and white matter Modulation- adjusting for normalization’s spatial distortions.
– Diffusion Tensor Imaging Measuring white matter integrity Tractography and analysis.
Many images are from Christian Gaser. You can see his presentations and get his VBM scripts from these sites:
fmri.uib.no/workshops/2006/mai/fmri/index.shtml dbm.neuro.uni-jena.de/home/

2
Voxel Based Morphometry
Most lectures in course focus on functional MRI. However, anatomical scans can also help us infer
brain function.– Do people with chronic epilepsy show brain atrophy?– Which brain regions atrophy with age?– Do people with good spatial memory (taxi drivers) have
different anatomy than other people? Voxel based morphometry is a tool to relate gray and
white matter concentration with medical history and behavior

3
Morphometry
Morphometry examines the shape, volume and integrity of structures.
Classically, morphometry was conducted by manually segmenting a few regions of interest.
Voxel based morphometry conducts an independent statistical comparison for each voxel in the brain.
Images from Christian Gaser

4
Voxel Based Morphometry
VBM has some advantages over manual tracing:– Automated: fast and not subject to individual bias.– Able to examine regions that are not anatomically
well defined.– Able to see the whole brain– Normalization compensates for overall differences
in brain volume, which can add variance to manual tracing of un-normalized images.

5
VBM disadvantages
VBM has clear disadvantages– Crucially depends on accurate normalization.– Low power: gray matter random fields are very
heterogenous (individual patterns of sulcal folding registration is always poor.
– Crucially depends on a priori probability maps.– Assumes normal gray-white contrast. Focal Cortical
Dysplasia – Looks for differences in volume, can be disrupted if shape
of brain is different: problem for developmental disorders

6
Segmentation
Start with high quality MRI scan
Classify tissue types (gray matter in this example)

7
Partitioning Tissue Types
VBM segments image into three tissue types: gray matter, white matter and CSF.– Typically done on T1 scans (best spatial resolution, good gray-white contrast).– Only three tissue types: will not cope with large lesions.– Probability map: each voxel has a 0..100% chance of being one of the 3 tissue types.
TT11 whitewhitegraygray CSFCSFImages from Christian Gaser
8
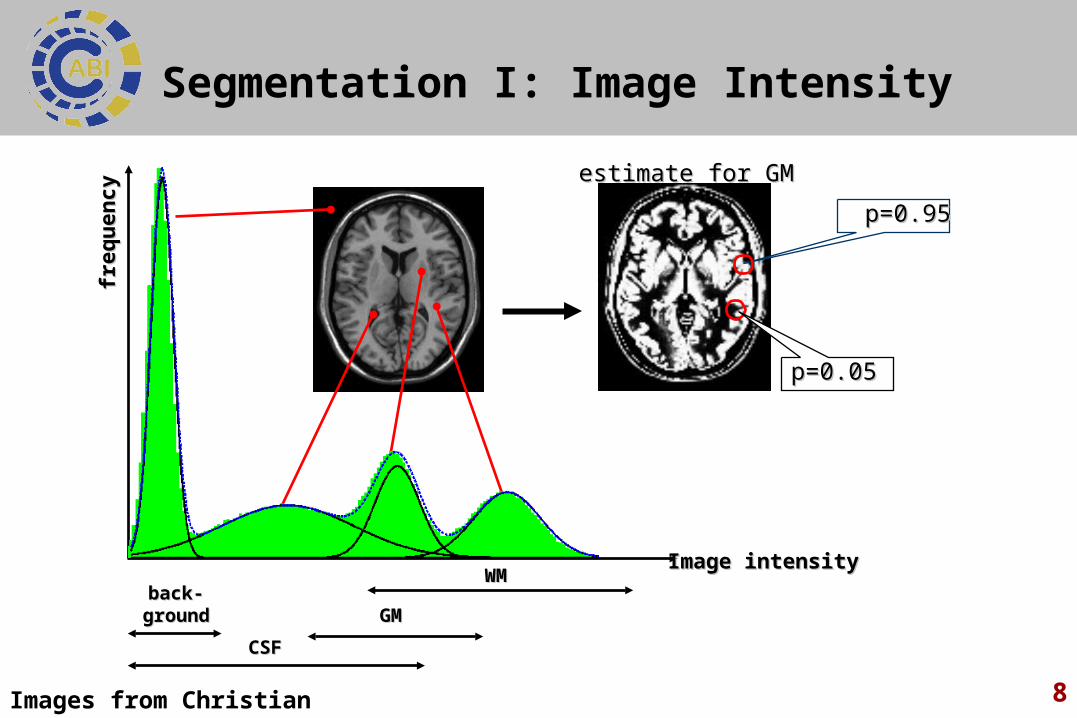
Segmentation I: Image Intensity
CSFCSF
WMWM
GMGMback-back-
groundground
Image intensityImage intensity
freq
uen
cyfr
equ
ency
estimate for GMestimate for GM
p=0.95p=0.95
p=0.05p=0.05
Images from Christian Gaser

9
Segmentation II: Voxel location
Maximization of a posteriori probability: Bayesian approach (expectation maximization)
Analogy:– We know that last year there were 248 of 365 days with rain in Norway (p=0.68)– the conditional (or posterior) probability for rain in Bergen will be p>0.5
TT11 WMWMGMGM CSFCSF
Probability maps (n=152)Probability maps (n=152)
Images and text from Christian Gaser
10
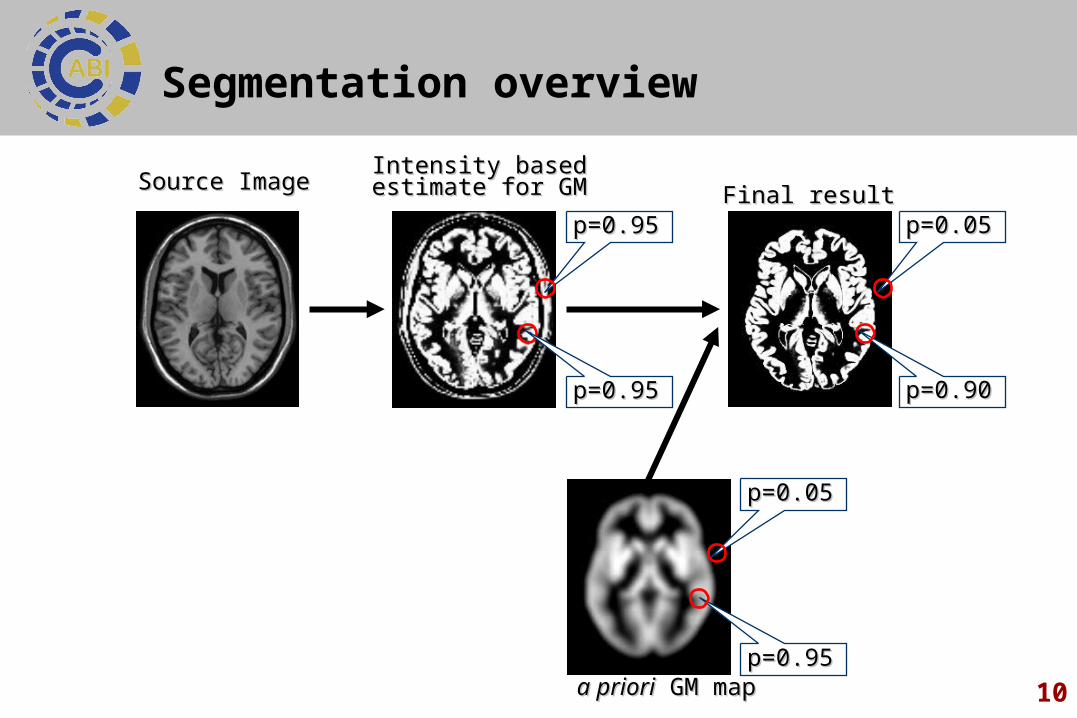
Segmentation overviewSegmentation overview
Intensity based Intensity based estimate for GMestimate for GM
p=0.95p=0.95
p=0.95p=0.95 p=0.90p=0.90
p=0.05p=0.05Final resultFinal result
a prioria priori GM map GM mapp=0.95p=0.95
p=0.05p=0.05
Source ImageSource Image

11
Voxel Based Morphometry Steps

12
Homogeneity correction crucial
Field inhomogeneity will disrupt intensity based segmentation. Bias correction required.
no correction
T1 WMGMEstimate

13
Normalization is crucial
Poor normalization has two problems– Image will not be registered with a priori map = poor
segmentation.– Images from different people will not be registered: we will
compare different brain areas. Custom template and prior is useful
– Accounts for characteristics of your scanner.– Accounts for characteristics of your population (e.g. age).– Must be independent of your analysis:
Either formed from combination of both groups (control+experimental) or from independent control group.
14
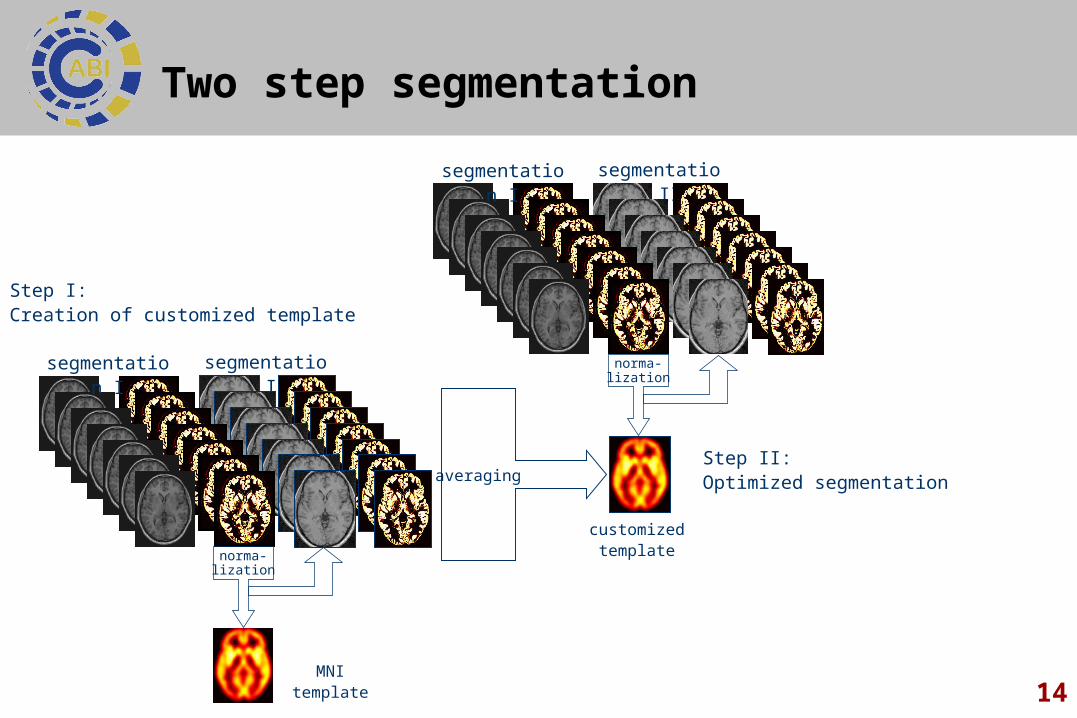
Two step segmentation
segmentation II
customized template
averaging
MNI template
segmentation I
norma-lization
segmentation II
Step I:Creation of customized template
segmentation I
norma-lization
Step II:Optimized segmentation

15
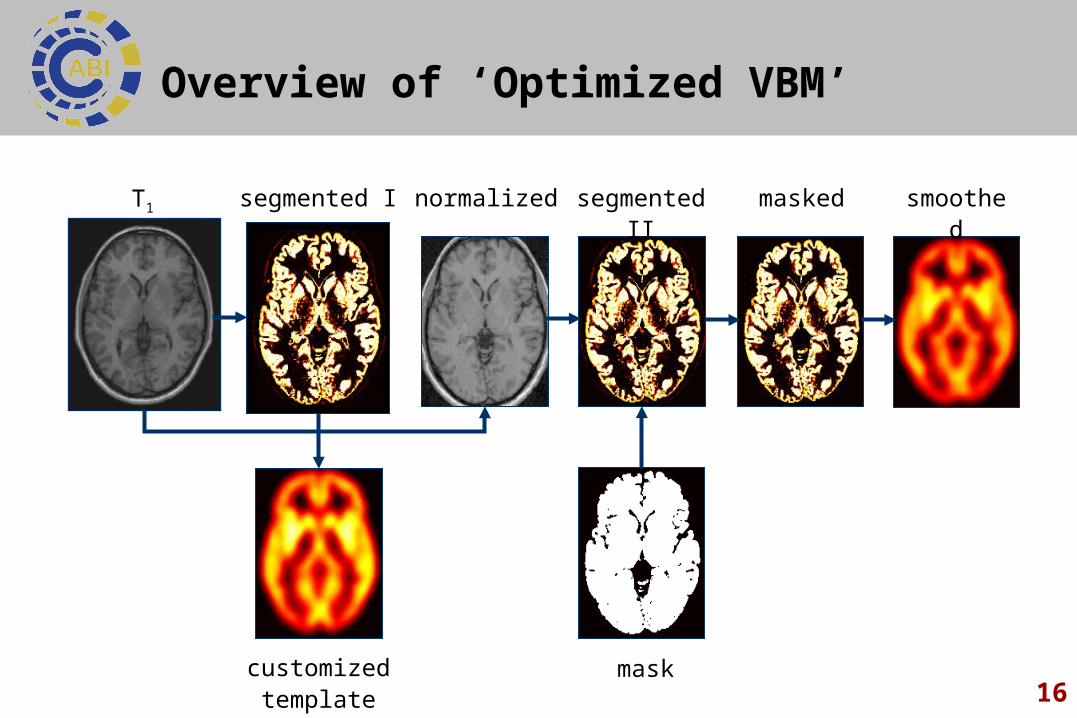
Image cleanup
segmented
mask
maskedT1
16
Overview of ‘Optimized VBM’
T1 normalized segmented II smoothedsegmented I masked
customized template
mask

17
VBM designs
Longitudinal VBM:– Sensitive way to detect atrophy through time.
Using the same individual reduces variability.Cross sectional studies
– Can compare two distinct populations– Can also examine atrophy through time, though
will require more people than longitudinal VBM.Most VBM studies use t-test (two group or
timepoints), but correlational analysis also powerful.

18
SPM5 segmentation
Unified segmentation• Iterated steps of segmentation estimation,
bias correction and warping
Impact• Warping of prior images during
segmentation makes segmentation more independent from size, position, and shape of prior images
• much slower than SPM2
40 iterationssegmentation
40 iterationsbias correction
20 iterationswarping
no significant change of estimate
significant change of estimate

19
Voxel Based Morphometry
We can statistically analyze gray matter atrophy
Epilepsy
20
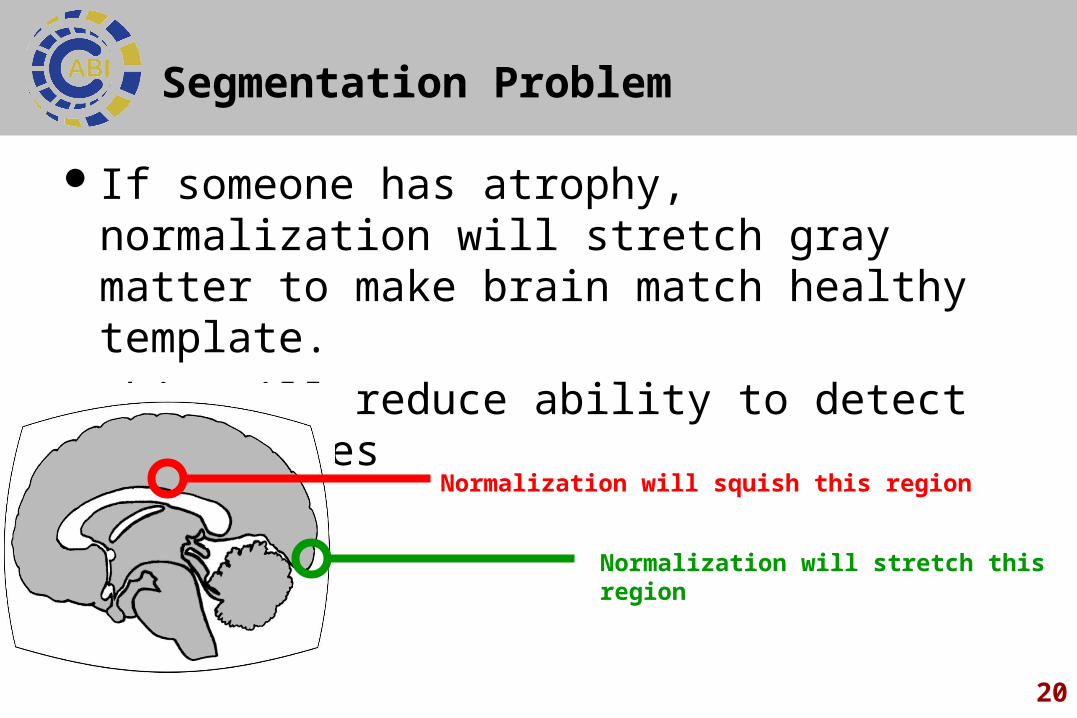
Segmentation Problem
If someone has atrophy, normalization will stretch gray matter to make brain match healthy template.
This will reduce ability to detect differences
Normalization will squish this region
Normalization will stretch this region

21
Image Modulation
– Analogy: as we blow up a balloon, the surface becomes thinner. Likewise, as we expand a brain area it’s volume is reduced.
Source TemplateModulated
Without modulation

22
Image Modulation
Optimized Segmentation can adjust for distortions caused during normalization.
Areas that had to be stretched are assumed to have less volume than areas that were compressed.– Corrects for changes in volume induced by nonlinear
normalization– Multiplies voxel intensities by a modulation matrix derived
from the normalization step – Allows us to make inferences about volume, instead of
concentration.
23
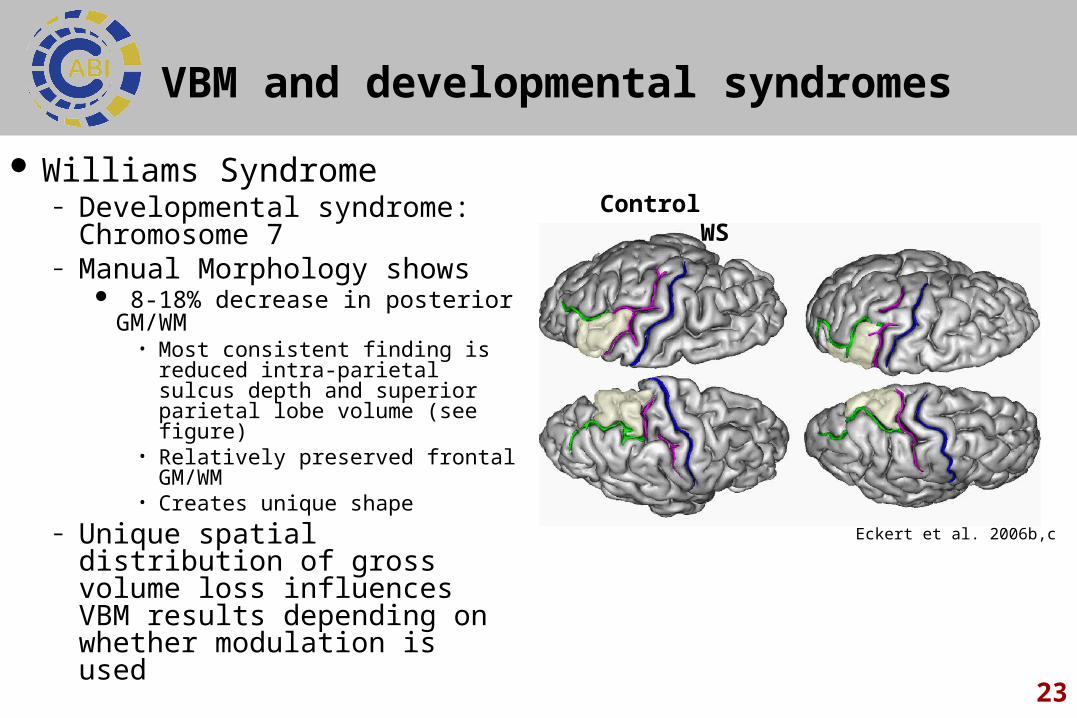
VBM and developmental syndromes
Williams Syndrome– Developmental syndrome:
Chromosome 7– Manual Morphology shows
8-18% decrease in posterior GM/WM
• Most consistent finding is reduced intra-parietal sulcus depth and superior parietal lobe volume (see figure)
• Relatively preserved frontal GM/WM
• Creates unique shape– Unique spatial distribution of
gross volume loss influences VBM results depending on whether modulation is used
Eckert et al. 2006b,c
Control WS

24
Modulation and shape
Eckert et al., 2006a
Shape differences influence modulated data.
Deformation Based Morphometry can identify shape/gross volumetric differences.
25
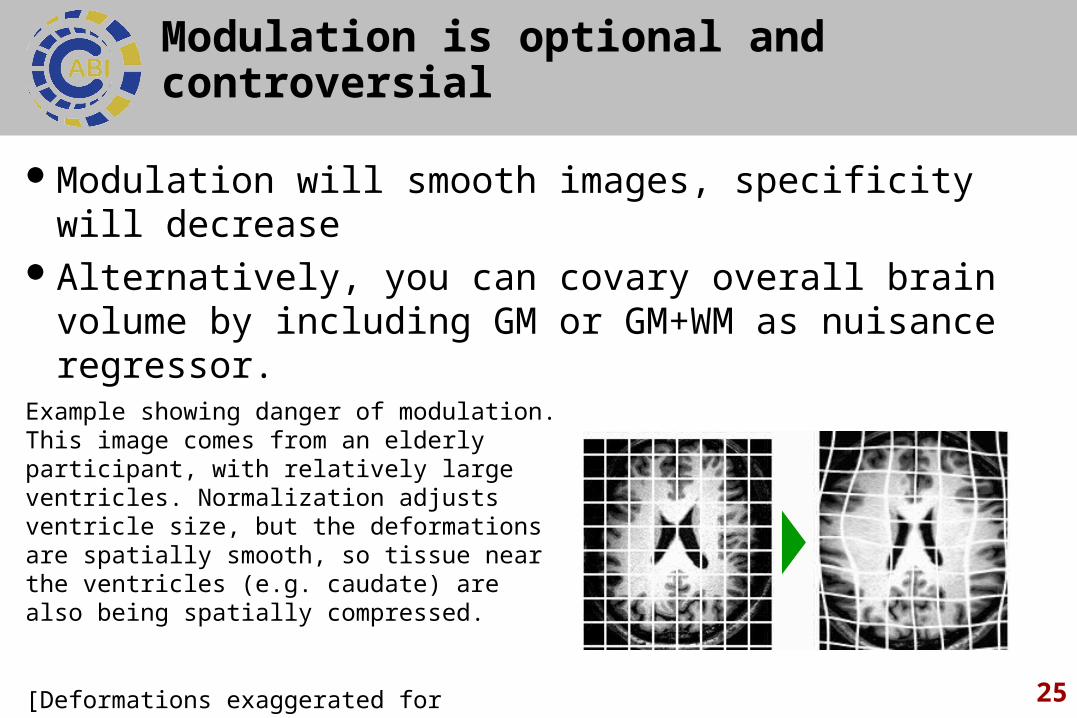
Modulation is optional and controversial
Modulation will smooth images, specificity will decrease
Alternatively, you can covary overall brain volume by including GM or GM+WM as nuisance regressor.
Example showing danger of modulation. This image comes from an elderly participant, with relatively large ventricles. Normalization adjusts ventricle size, but the deformations are spatially smooth, so tissue near the ventricles (e.g. caudate) are also being spatially compressed.
[Deformations exaggerated for exposition]

26
DBM (from Henson)
Deformation-based Morphometry examines absolute displacements.
E.G. Mean differences (mapping from an average female to male brain).
27
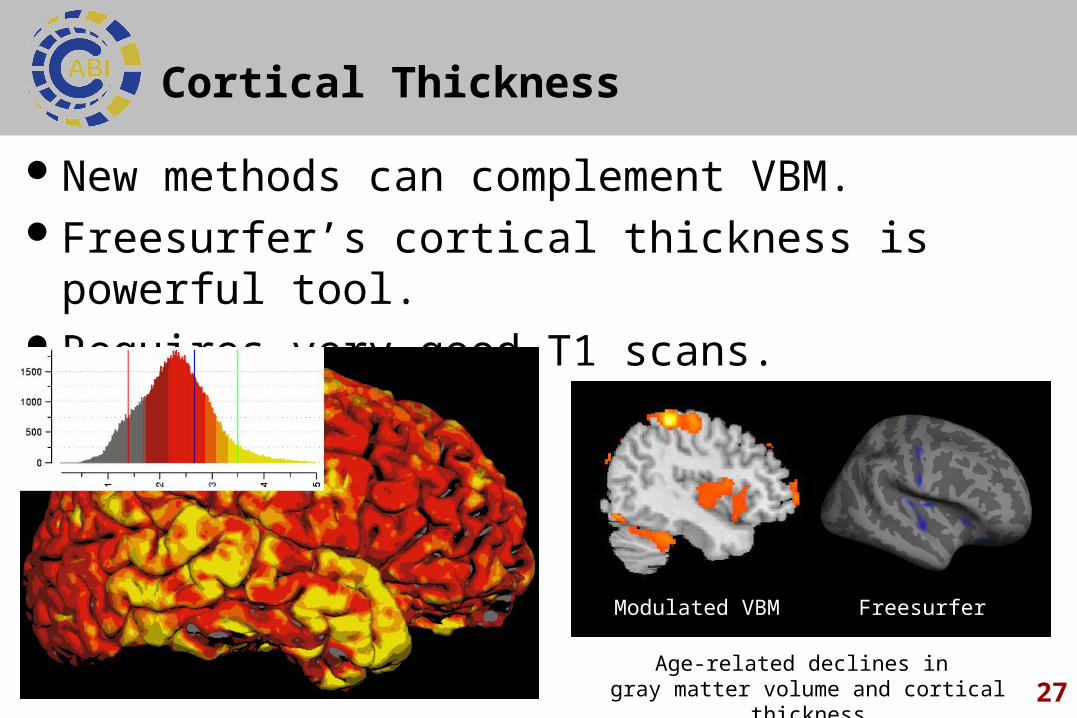
Cortical Thickness
New methods can complement VBM.Freesurfer’s cortical thickness is powerful tool.Requires very good T1 scans.
Modulated VBM Freesurfer
Age-related declines in gray matter volume and cortical thickness

28
VBM comments
VBM findings are first step in understanding strucutural changes.
Methods are a work in progress.– www.tina-vision.net/docs/memos/2003-011.pdf– Bookstein, 2001– Davatzikos, 2004– http://fmri.uib.no/workshops/2006/mai/fmri/index.shtml– Christian Gaser Markov Random Fields dbm.neuro.uni-
jena.de/home/
29
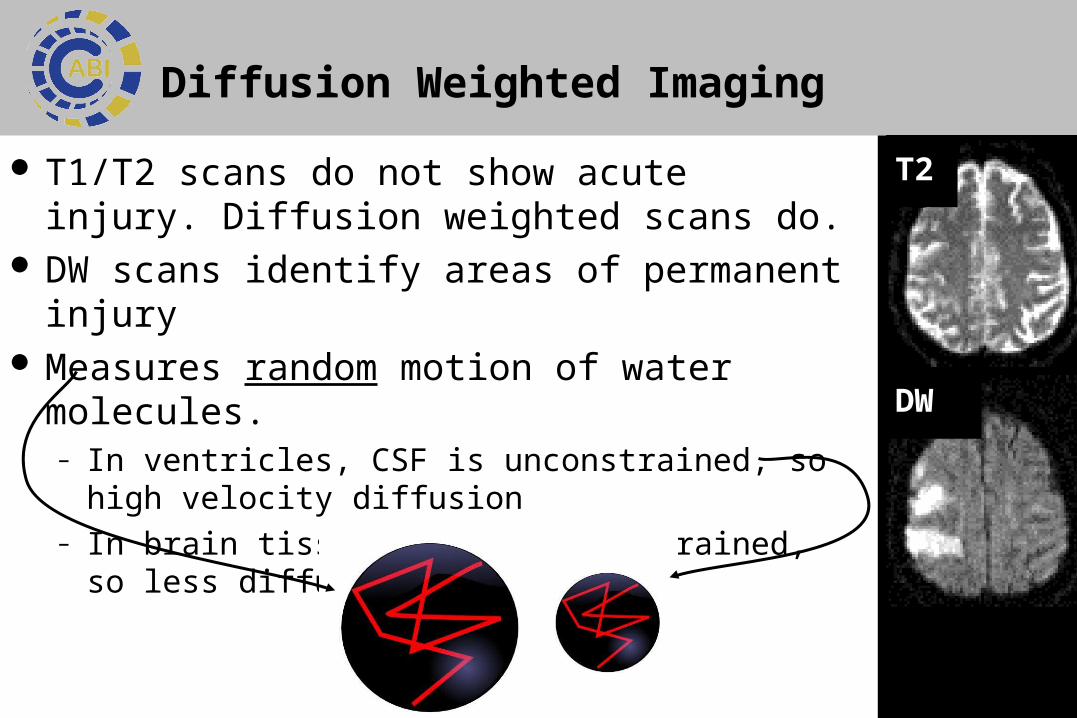
Diffusion Weighted Imaging
T1/T2 scans do not show acute injury. Diffusion weighted scans do.
DW scans identify areas of permanent injury Measures random motion of water molecules.
– In ventricles, CSF is unconstrained, so high velocity diffusion
– In brain tissue, CSF more constrained, so less diffusion.
T2
DW

30
Diffusion Tensor Imaging (DTI)
DTI is an extension of DWI that allows us to measure direction of motion.
DTI allows us to measure both the velocity and preferred direction of diffusion– In gray matter, diffusion is isotropic (similar in all directions)– In white matter, diffusion is anisotropic (prefers motion along
fibers).

31
DTI
The amount of diffusion occurring in one pixel of a MR image is termed the Apparent Diffusion Coefficient (ADC) or Mean Diffusivity (MD).
The non-uniformity of diffusion with direction is usually described by the term Fractional Anisotropy (FA).
MD differs FA differs
32
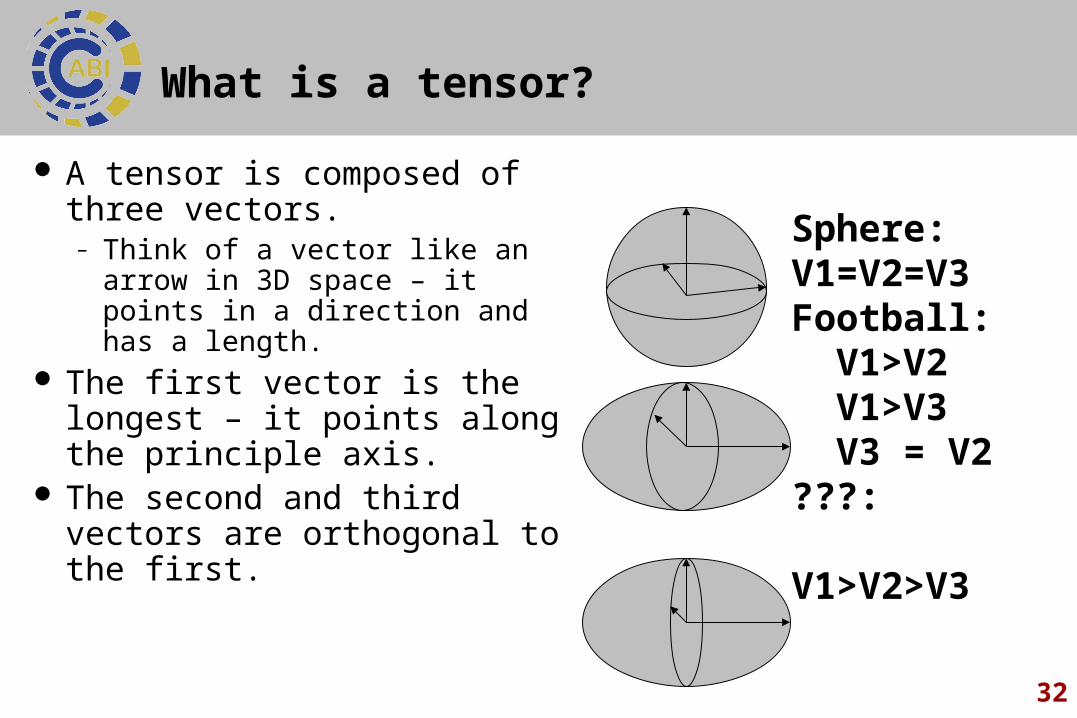
What is a tensor?
A tensor is composed of three vectors.– Think of a vector like an arrow
in 3D space – it points in a direction and has a length.
The first vector is the longest – it points along the principle axis.
The second and third vectors are orthogonal to the first.
Sphere: V1=V2=V3Football: V1>V2 V1>V3 V3 = V2???: V1>V2>V3

33
Diffusion Tensor Imaging
To create a tensor, we need to collect multiple directions.
Typically 12-16 directions.
More directions offer a better estimate of optimal tensor.

34
DTI
MD FA Principle Tensor Vector
DTI Tutorial
35
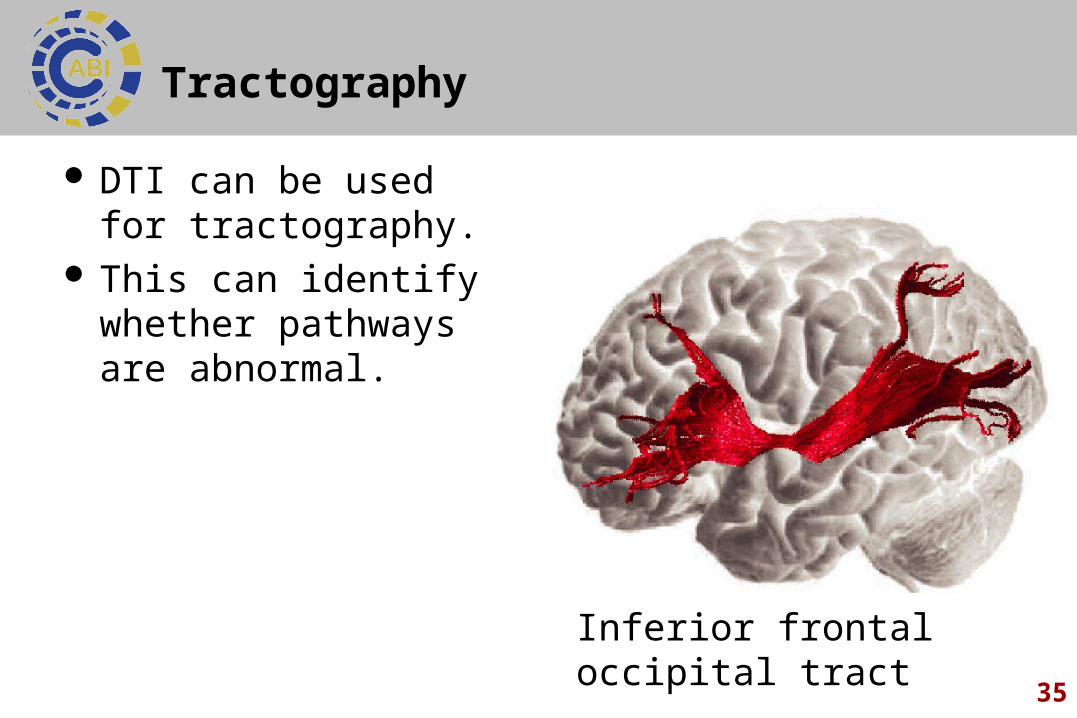
Tractography
DTI can be used for tractography.
This can identify whether pathways are abnormal.
Inferior frontal occipital tract

36
Kissing or crossing?
Modelling each voxel as a tensor has limitations.
Cannot model fiber crossings.