1 deeppap: deep convolutional networks for cervical cell ... · abnormal and normal nuclei, remains...
TRANSCRIPT

1
DeepPap: Deep Convolutional Networks forCervical Cell Classification
Ling Zhang, Le Lu, Senior Member, IEEE , Isabella Nogues, Ronald M. Summers, Shaoxiong Liu,and Jianhua Yao
F
Abstract—Automation-assisted cervical screening via Pap smear orliquid-based cytology (LBC) is a highly effective cell imaging basedcancer detection tool, where cells are partitioned into ”abnormal” and”normal” categories. However, the success of most traditional classifi-cation methods relies on the presence of accurate cell segmentations.Despite sixty years of research in this field, accurate segmentationremains a challenge in the presence of cell clusters and pathologies.Moreover, previous classification methods are only built upon the ex-traction of hand-crafted features, such as morphology and texture. Thispaper addresses these limitations by proposing a method to directlyclassify cervical cells – without prior segmentation – based on deepfeatures, using convolutional neural networks (ConvNets). First, theConvNet is pre-trained on a natural image dataset. It is subsequentlyfine-tuned on a cervical cell dataset consisting of adaptively re-sampledimage patches coarsely centered on the nuclei. In the testing phase,aggregation is used to average the prediction scores of a similar set ofimage patches. The proposed method is evaluated on both Pap smearand LBC datasets. Results show that our method outperforms previousalgorithms in classification accuracy (98.3%), area under the curve(AUC) (0.99) values, and especially specificity (98.3%), when applied tothe Herlev benchmark Pap smear dataset and evaluated using five-foldcross-validation. Similar superior performances are also achieved on theHEMLBC (H&E stained manual LBC) dataset. Our method is promisingfor the development of automation-assisted reading systems in primarycervical screening.
Index Terms—Cell classification, Deep learning, Neural networks, Papsmear, Cervical cytology.
1 INTRODUCTION
C ERVICAL cytology (conventional Pap smear or liquid-basedcytology) [1], the most popular screening test for prevention
and early detection of cervical cancer, has been widely used indeveloped countries and has significantly reduced its incidenceand number of deaths [2]. However, population-wide screening isstill unavailable in underdeveloped countries [2], partly due to thecomplexity and tedious nature of manually screening abnormal
L. Zhang, L. Lu, R. Summers, and J. Yao are with the Imaging Biomarkersand Computer-Aided Diagnosis Laboratory and also with the Clinical ImageProcessing Service, Radiology and Imaging Sciences Department, NationalInstitutes of Health Clinical Center, Bethesda, MD 20892 USA e-mail:([email protected]; [email protected]).I. Nogues is with the Imaging Biomarkers and Computer-Aided DiagnosisLaboratory, Radiology and Imaging Sciences Department, National Institutesof Health Clinical Center, Bethesda, MD 20892 USA.S. Liu is with the Department of Pathology, Peoples Hospital of NanshanDistrict, Shenzhen 518052 China.
cells from a cervical cytology specimen [3]. While automation-assisted reading techniques can boost efficiency, their currentperformance is not adequate for inclusion in primary cervicalscreening [4].
During the past few decades, extensive research has beendevoted to the creation of computer-assisted reading systems basedon automated image analysis methods [3], [5], [6]. Such systemsautomatically select potentially abnormal cells in a given cervicalcytology specimen, from which the cytoscreener/cytopathologistcompletes the classification. This task comprises three steps: cell(cytoplasm and nuclei) segmentation, feature extraction/selection,and cell classification.
Accurate cell segmentation is crucial to the success of areading system. However, despite recent significant progress inthis area [7]–[15], the presence of cell clusters (which is evenmore problematic in Pap smear than in liquid-based cytology),as well as the large shape and appearance variations betweenabnormal and normal nuclei, remains a major obstacle to theaccurate segmentation of individual cytoplasms and nuclei. Onthe Herlev benchmark dataset [16], [17], the attained nucleussegmentation accuracy ranging between 0.85 [11] and 0.92 [15].On an overlapping cervical cell dataset [13], the cytoplasm seg-mentation accuracy ranges from 0.87 to 0.89 [13]. On the otherhand, most cell classification studies assume that accurate segmen-tations of individual cytoplasms and nuclei are already available[17]–[19]. By optimizing features derived from the segmentedcytoplasm and nucleus, high classification accuracies (e.g., 96.8%)are achieved on the Herlev dataset, using 5-fold cross validation(CV) [18], [19]. However, these high values would decrease, oncethe automated segmentation error (deriving mainly from the error-prone abnormal nucleus segmentation [10], [14]), were taken intoaccount.
Several strategies to remove this dependence on segmentationhave been investigated. Classification based only on nucleus fea-tures (excluding cytoplasm features) is proposed [6], [20], [21].Comparable results on the Herlev dataset is obtained by usinga non-linear dimensionality reduction algorithm and supervisedlearning [20]. Another idea is to classify image patches containingfull cervical cells [22]–[24]. However, extraction of such patchesstill requires automated cell detection and segmentation. To avoidthe pre-segmentation step, pixel-level classification method is de-signed to directly screen abnormal nuclei with no prior cytoplasmand nucleus segmentation [25], but reports limited validationresults. Alternatively, a technique which classifies the croppedblocks from cell images is proposed [26]. However, arbitrary
arX
iv:1
801.
0861
6v1
[cs
.CV
] 2
5 Ja
n 20
18
2
ImageNet
Dataset
Convolutional
Neural Network
Cervical Cell
Dataset
Data
Preprocessing
Transfer
Learning
Test
Image
Data
Preprocessing
Convolutional
Neural Network
Tra
inin
gT
esti
ng
Abnormal
Score
Post-
Aggregation
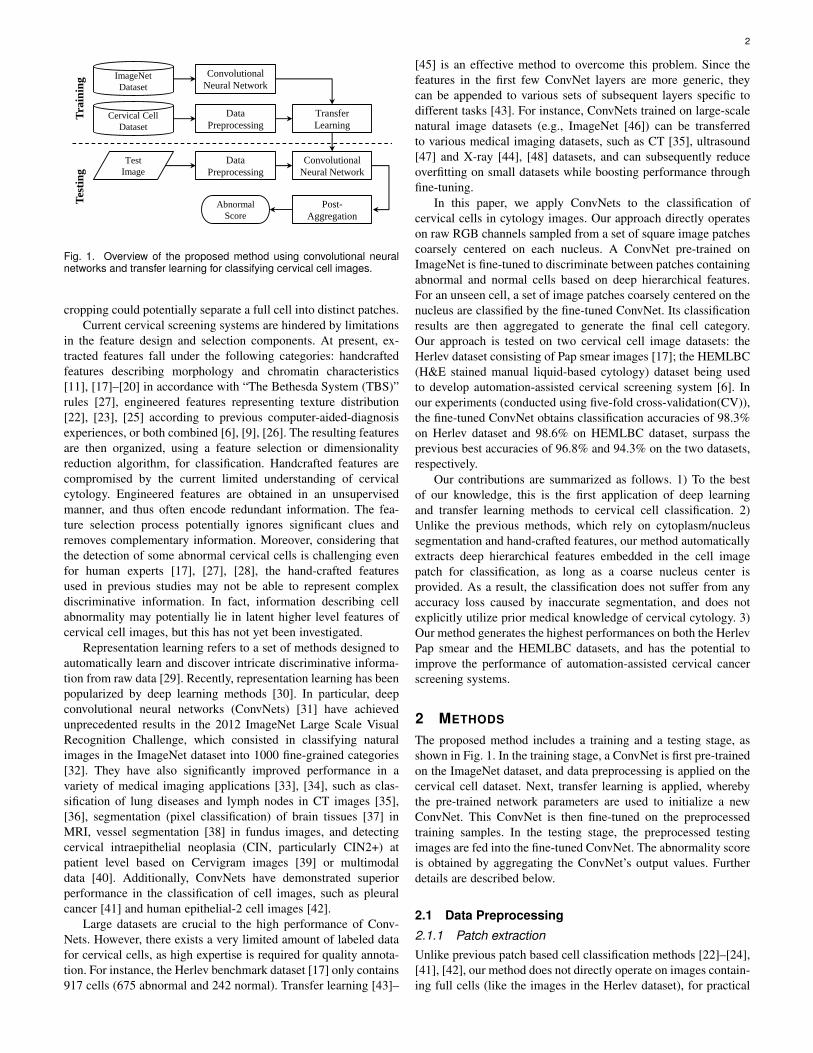
Fig. 1. Overview of the proposed method using convolutional neuralnetworks and transfer learning for classifying cervical cell images.
cropping could potentially separate a full cell into distinct patches.Current cervical screening systems are hindered by limitations
in the feature design and selection components. At present, ex-tracted features fall under the following categories: handcraftedfeatures describing morphology and chromatin characteristics[11], [17]–[20] in accordance with “The Bethesda System (TBS)”rules [27], engineered features representing texture distribution[22], [23], [25] according to previous computer-aided-diagnosisexperiences, or both combined [6], [9], [26]. The resulting featuresare then organized, using a feature selection or dimensionalityreduction algorithm, for classification. Handcrafted features arecompromised by the current limited understanding of cervicalcytology. Engineered features are obtained in an unsupervisedmanner, and thus often encode redundant information. The fea-ture selection process potentially ignores significant clues andremoves complementary information. Moreover, considering thatthe detection of some abnormal cervical cells is challenging evenfor human experts [17], [27], [28], the hand-crafted featuresused in previous studies may not be able to represent complexdiscriminative information. In fact, information describing cellabnormality may potentially lie in latent higher level features ofcervical cell images, but this has not yet been investigated.
Representation learning refers to a set of methods designed toautomatically learn and discover intricate discriminative informa-tion from raw data [29]. Recently, representation learning has beenpopularized by deep learning methods [30]. In particular, deepconvolutional neural networks (ConvNets) [31] have achievedunprecedented results in the 2012 ImageNet Large Scale VisualRecognition Challenge, which consisted in classifying naturalimages in the ImageNet dataset into 1000 fine-grained categories[32]. They have also significantly improved performance in avariety of medical imaging applications [33], [34], such as clas-sification of lung diseases and lymph nodes in CT images [35],[36], segmentation (pixel classification) of brain tissues [37] inMRI, vessel segmentation [38] in fundus images, and detectingcervical intraepithelial neoplasia (CIN, particularly CIN2+) atpatient level based on Cervigram images [39] or multimodaldata [40]. Additionally, ConvNets have demonstrated superiorperformance in the classification of cell images, such as pleuralcancer [41] and human epithelial-2 cell images [42].
Large datasets are crucial to the high performance of Conv-Nets. However, there exists a very limited amount of labeled datafor cervical cells, as high expertise is required for quality annota-tion. For instance, the Herlev benchmark dataset [17] only contains917 cells (675 abnormal and 242 normal). Transfer learning [43]–
[45] is an effective method to overcome this problem. Since thefeatures in the first few ConvNet layers are more generic, theycan be appended to various sets of subsequent layers specific todifferent tasks [43]. For instance, ConvNets trained on large-scalenatural image datasets (e.g., ImageNet [46]) can be transferredto various medical imaging datasets, such as CT [35], ultrasound[47] and X-ray [44], [48] datasets, and can subsequently reduceoverfitting on small datasets while boosting performance throughfine-tuning.
In this paper, we apply ConvNets to the classification ofcervical cells in cytology images. Our approach directly operateson raw RGB channels sampled from a set of square image patchescoarsely centered on each nucleus. A ConvNet pre-trained onImageNet is fine-tuned to discriminate between patches containingabnormal and normal cells based on deep hierarchical features.For an unseen cell, a set of image patches coarsely centered on thenucleus are classified by the fine-tuned ConvNet. Its classificationresults are then aggregated to generate the final cell category.Our approach is tested on two cervical cell image datasets: theHerlev dataset consisting of Pap smear images [17]; the HEMLBC(H&E stained manual liquid-based cytology) dataset being usedto develop automation-assisted cervical screening system [6]. Inour experiments (conducted using five-fold cross-validation(CV)),the fine-tuned ConvNet obtains classification accuracies of 98.3%on Herlev dataset and 98.6% on HEMLBC dataset, surpass theprevious best accuracies of 96.8% and 94.3% on the two datasets,respectively.
Our contributions are summarized as follows. 1) To the bestof our knowledge, this is the first application of deep learningand transfer learning methods to cervical cell classification. 2)Unlike the previous methods, which rely on cytoplasm/nucleussegmentation and hand-crafted features, our method automaticallyextracts deep hierarchical features embedded in the cell imagepatch for classification, as long as a coarse nucleus center isprovided. As a result, the classification does not suffer from anyaccuracy loss caused by inaccurate segmentation, and does notexplicitly utilize prior medical knowledge of cervical cytology. 3)Our method generates the highest performances on both the HerlevPap smear and the HEMLBC datasets, and has the potential toimprove the performance of automation-assisted cervical cancerscreening systems.
2 METHODS
The proposed method includes a training and a testing stage, asshown in Fig. 1. In the training stage, a ConvNet is first pre-trainedon the ImageNet dataset, and data preprocessing is applied on thecervical cell dataset. Next, transfer learning is applied, wherebythe pre-trained network parameters are used to initialize a newConvNet. This ConvNet is then fine-tuned on the preprocessedtraining samples. In the testing stage, the preprocessed testingimages are fed into the fine-tuned ConvNet. The abnormality scoreis obtained by aggregating the ConvNet’s output values. Furtherdetails are described below.
2.1 Data Preprocessing
2.1.1 Patch extractionUnlike previous patch based cell classification methods [22]–[24],[41], [42], our method does not directly operate on images contain-ing full cells (like the images in the Herlev dataset), for practical

3
Rotations Translations
…
…
…
…
…
…
…
…
…
Rotations Translations
…
…
…
…
…
…
…
…
…
(a) (b)
Fig. 2. Two set of image patches are generated from (a) an abnormal and (b) a normal cervical cell image by rotations and translations. Thecentroids of translated image patches are shown as yellow, indicating the potentially inaccurate detection of nucleus centers.
reasons. In particular, obtaining an individual cell requires cell pre-segmentation (at least cytoplasm segmentation), which remains anunsolved, challenging problem [13]. As mentioned in the TBSrules [27], different cervical cytology abnormalities are associatedwith different nucleus abnormalities. Hence, nucleus features inthemselves already include substantial discriminative information.We thus extract image patches of size m × m centered on thenucleus centroid. This strategy allows for embedding not only thenucleus scale/size information (an important discriminative featurebetween abnormal and normal cells), but also the contextual clues(e.g., the cytoplasm appearance) in the extracted patches. Weacknowledge that automated methods for extracting a nucleuspatch, e.g., Laplacian-of-Gaussian (LoG) [49], selective search[50], or ConvNets [51] exist. However, in this paper, we chooseto focus on the classification task. We adopt a simple method ofdirectly translating the centroid of the ground-truth nucleus maskto extract a set of image patches as described below.
2.1.2 Data Augmentation
Data augmentation improves the accuracy of ConvNets and re-duces overfitting [32]. Since cervical cells are rotationally invari-ant, we perform Nr rotations (with a step size of θ degrees) oneach cell image, and thus increase our number of image samples.Nr patches (one per rotated image) of size m×m centered at therotated nucleus centers are extracted as the training samples, asshown in the middle (blue) panel in Fig. 2. Note that rotatinga cell image may slightly degrade its high frequency contents(could be considered as a lower imaging quality), but shouldnot change its abnormality/normality for most cells. Actually theaugmentation step based on image rotation is crucial to the successof the ConvNet [35], and has been demonstrated to be importantfor improving accuracy of ConvNet-based cell image classificationproblem [42], given the limited number of images in the Herlevand HEMLBC dataset. Zero padding is used to void regions thatlie outside of the image boundary.
Considering that the detected nucleus center may be inaccuratein practice, we randomly translate (by up to d pixels) each nucleuscentroid Nt times to obtain Nt points as the coarse nucleuscenters. Accordingly, Nt patches of size m×m centered at theselocations are extracted as training samples, as shown in the right(green) panel in Fig. 2. These patches not only simulate inaccuratenucleus center detection, but also increase the amount of trainingsamples for ConvNets. Other data augmentation approaches such
as scale and color transformations are not used, as both the sizeand intensity of the nucleus are essential features to distinguishabnormal cervical cells from normal ones.
There are ∼ 3 times more abnormal cell images than normalcell images in the Herlev dataset. Classifiers tend to exhibit biastowards the majority class (abnormal cells). Although achievinga high sensitivity rate (correct classification of abnormal cells)is ideal from a medical point of view [17], a high false positiverate (mis-classification of normal cells as abnormal) is not desir-able from a practical standpoint [6]. A common solution to thisdilemma is to balance the proportions of positive and negativetraining samples [52]. Doing so also improves the accuracy andconvergence rate of ConvNets in training [32], [36]. Hence, wecreate a balanced training set by sampling a higher proportion ofnormal than abnormal patches.
2.2 Convolutional Neural NetworksA convolutional neural network (ConvNet) [31], [32] is a deeplearning model comprising multiple consecutive stages, namelyconvolutional (conv), non-linearity and pooling (pool) layers,followed by more conv and fully connected (fc) layers. The inputof the ConvNet is the raw pixel intensity image (in our case, theimage obtained by subtracting the mean image over the trainingset from the original image [32]). The output layer is composed ofseveral neurons each corresponding to one class. The weights (W )in the ConvNet are optimized by minimizing the classificationerror on the training set using the backpropagation algorithm [53].Fig. 3 shows two ConvNets. The upper network is trained on theImageNet dataset, and the lower network is trained on the cervicalcell dataset.
2.2.1 Convolutional layerThe conv layer takes local rectangular patches across (with offsetby stride and with/without spatial preservation by padding) theinput image (for the first layer) or feature maps (for the sub-sequent layers) as input, on which 2D convolution with a filteris performed. The sum x of the resulting convolutions is fedinto a non-linearity function, specifically a rectified linear unit(ReLU) f(x) = max(0, x) [32], in order to increased the speedof training. In a given layer, the same filter is shared in a featuremap, while different filters are used for different feature maps.This property of filter sharing in conv layer allows for detectingthe same pattern in different locations of the feature map.

4
… … …
conv & pool
conv & pool conv & pool
fc
fc Image patch extraction
Input image (RGB)
Feature maps
Feature maps Feature maps
output
… … …
ImageNet dataset …
…
W1 W2 W3, …, Wk
Parameter Transfer
Fine-Tuning
Pre-Training
filters
filters filters
Fig. 3. A ConvNet is fine-tuned on the cervical cell dataset with parameters transferred from another ConvNet pre-trained on the ImageNet dataset.In this example, the parameters (W1, W2, ... Wk) in the purple region in the pre-trained model (upper panel) are transferred to the same locationsin another model (lower panel) for fine-tuning on cervical cell dataset.
2.2.2 Pooling layer
The pooling operation down-samples the feature map by sum-marizing feature responses in each non-overlapping local patch,often by computing the maximum activations (max-pooling). Thisyields features invariant to minor translations in the data.
2.2.3 Fully connected layer
conv and pool generate feature maps of smaller dimensions thanthe input image, which are then passed through several fc layers.The first few fc layers fuse these feature maps into a featurevector. The last fc layer contains two neurons which compute theclassification probability for each class using softmax regression.To reduce overfitting, “dropout” [54] is used to constrain the fully-connected layers.
2.2.4 Network training
The weights W in ConvNets are initialized with values from theGaussian distribution. During training, these weights are itera-tively updated with the gradients of the loss function, computedvia stochastic gradient descent (SGD) over a mini-batch (size of256) of training samples. The initial learning rate is decreased aftercertain epochs. As in Ref. [32], momentum and weight decay areused to speed up the learning and reduce overfitting. The trainingprocess is terminated after a pre-determined number of epochs.The model with the lowest validation loss value is selected as thefinal network.
2.3 Transfer Learning
Transfer learning refers to the fine-tuning of deep learning modelsthat are pre-trained on other large-scale image datasets. In thisstudy, the first few conv and pool layers of a ConvNet pre-trainedon the ImageNet classification dataset (ILSVRC2012) (purpleregion in the upper part in Fig. 3) are used as the base of ournetwork, on top of which several task-specific fc layers withrandom initialized weights are attached. In order to facilitate thetransfer of features, the same network layers (conv and pool) withthe BVLC CaffeNet [55] are transferred to the same locationsin our model (purple regions in Fig. 3). Like our network, theCaffeNet also takes RGB channels as input. All of these layers arejointly trained (fine-tuned) on our cervical cell dataset, for whicha learning rate 10 times smaller than the original CaffeNet valueis used to fine-tune the transferred layers, and the original learningrate is used to train the fc layers from scratch.
2.4 Testing
To classify an unseen image, we combine random-view aggre-gation [36] and multiple crop testing [32] to produce the finalprediction score. In particular, our data augmentation methodgenerates Nv image patches (rotations and translations about thenucleus centroid). From each of these patches, Nc sub-patchesare cropped (including its corner, center and mirrored patches).Hence, for each test cervical cell image, Nv ×Nc sub-patches arefed into the ConvNet. The final prediction score is obtained byaveraging the scores of these Nv ×Nc predictions.

5
TABLE 1The 917 cells (242 normal and 675 abnormal) from Herlev dataset.
Category Class Cell type Num.Normal 1 Superficial squamous epithelial 74Normal 2 Intermediate squamous epithelial 70Normal 3 Columnar epithelial 98Abnormal 4 Mild squamous non-keratinizing dysplasia 182Abnormal 5 Moderate squamous non-keratinizing dysplasia 146Abnormal 6 Severe squamous non-keratinizing dysplasia 197Abnormal 7 Squamous cell carcinoma in situ intermediate 150
3 EXPERIMENTAL METHODS
3.1 Data setThe cell data used to train and test the ConvNets comes fromtwo datasets with two types of cervical cytology images, whichwere acquired by different slide preparation, staining methods,and imaging conditions.
3.1.1 Herlev DatasetThe first one is from a publicly available dataset (http://mde-lab.aegean.gr/downloads) collected at the Herlev University Hos-pital by a digital camera and microscope [17]. The image reso-lution is 0.201 µm per pixel [16]. The specimens are preparedvia conventional Pap smear and Pap staining. The Herlev datasetconsists of 917 images – each containing one cervical cell – withground truth segmentation and classification. There are a total ofseven different classes – diagnosed by two cyto-technicians anda doctor, in order to maximize certainty of the diagnosis. Theseseven classes belong to two categories: class 1-3 are normal, andclass 4-7 are abnormal, as shown in Table 1. Examples of somecells are provided in Fig. 4(a). As can be seen, most abnormalcells have larger nucleus size than normal cells. However, thenormal columnar nucleus may have similar size (also maybesimilar chromatin distribution) as severe and/or carcinoma nuclei,which makes the classification challenging.
For each abnormal cell image in the Herlev dataset, Nr = 10rotations (θ = 36◦) and Nt = 10 translations (up to 10 pixels)are performed. For each normal cell, we use Nr = 20 (θ =18◦) and Nt = 14, resulting in 100 and 280 image patches foreach abnormal and normal cell image, respectively. This yieldsa relatively balanced data distribution. Note that such differentsteps of rotation/translation for abnormal and normal cells areonly for training not testing set. The image patch size is set tom = 128 pixels to cover some cytoplasm region for most cells,and to contain most of the full nucleus region for the largest one.These image patches are then up-sampled to a size of 256 × 256× 3 pixels via bi-linear interpolation, in order to facilitate thetransfer of pre-trained ConvNet model [35].
3.1.2 HEMLBC DatasetThe second one is from our own dataset collected at the People’sHospital of Nanshan District by using our previously developedautofocusing system (Olympus BX41 microscope with 20× ob-jective, Jenoptik ProgRes CF Color 1.4 Megapixel Camera, andMS300 motorized stage) [6]. Each pixel has a size of 0.208 µm2.The specimens are prepared by manual liquid-based cytology withH&E staining. The dataset used in this paper is a subset used totrain the abnormal/normal nucleus classifier for our automation-assisted cervical screening system [6]. There are totally 989
abnormal cells from 8 biopsy-confirmed CIN slides and 1381normal cells from another 8 NILM (negative for intraepitheliallesion and malignancy) slide available. To create a balanceddata distribution, 989 normal cells are randomly selected. Theabnormal cells are diagnosed by two experienced pathologists.Most of them are segmented by an automated algorithm [6] andthe ill-segmented ones are manually segmented by a pathologist.The normal cells are formed by two subsets: the first subsetis collected by a pathologist with automated segmentation; thesecond subset is some false positive cells (e.g., cells with largenuclei, atrophic cells, etc.) collected during bootstrap process fromvalidation images with manual segmentation for the ill-segmentedones by an engineer. More details are described in [6]. Examplesof some cells are shown in Fig. 4(b).
For both abnormal and normal cell image in the HEMLBCdataset, Nr = 10 rotations (θ = 36◦) and Nt = 10 translations(up to 10 pixels) are performed, resulting in 100 image patchesfor each cell image. The image patch size is also set to m = 128pixels and then up-sampled to a size of 256 × 256 × 3 pixels asin Herlev dataset.
3.2 Network Architectures and Implementation
Fig. 3 illustrates our network architecture. The base ConvNet (de-note as ConvNet-B) is pre-trained on the ImageNet classificationdataset. ConvNet-B contains five conv layers (conv1 − conv5),three pool layers (pool1, pool2, pool5), and three fc layers(fc6 − fc8). Layers from conv1 to pool5 are transferred tothe same locations in our model (denote as ConvNet-T). In otherword, the first 5 weight layers (conv1 to pool5) of ConvNet-T arecopied from the pre-trained ConvNet-B, and fc6− fc8 layers ofConvNet-T are initialized with random Gaussian distributions. Thedetailed configurations of our ConvNet-T are listed in Table. 2.Local response normalization is used for conv1 and conv2 layersusing the same setting as [32], and all hidden layers are equippedwith the ReLU activation function. Note that the ConvNet-Band ConvNet-T share the same network structure from conv1to pool5, but the number of neurons of the three fc layers inConvNet-B and ConvNet-T are 4096-4096-1000 and 1024-256-2,respectively. The 1024 and 256 are set based on our empiricalevaluation, and 2 is to accommodate the new object categoriesin our 2-class (abnormal/normal) classification problem. Actually,setting the number of neurons of fc6 and fc7 layers in the rangeof 1024∼256 will result in similar accuracy, while more numberof neurons (e.g., 4096-4096) tend to have slightly lower accuracy(1%-2% lower) on our data, which is more compact and specificcompared to ImageNet. ConvNet-T is run on the Caffe platform[55], using a Nvidia GeForce GTX TITAN Z GPU with 12 GB ofmemory.
3.3 Training and Testing Protocols
From each 256 × 256 training image patch or its mirrored version,a 227 × 227 sub-patch is randomly cropped, from which the meanimage over the training set is then subtracted. Stochastic GradientDescent (SGD), with a mini-batch size of 256, is used to train theConvNet-T for 30 epochs. The learning rates of layers conv1 −pool5 and layers fc6−fc8 start from 0.001 and 0.01, respectively,and are decreased by a factor of 10 at every tenth epoch. Weightdecay and momentum are set to 0.0005 and 0.9. A dropout ratioof 0.5 is used to constrain the fc6 and fc7 layers.

6
superficial intermediate columnar
mild moderate severe carcinoma
Normal
Abnormal
Normal
Abnormal
(a) Herlev (b) HEMLBC
Fig. 4. Example images of normal and abnormal cervical cells from the (a) Herlev and (b) HEMLBC dataset. All these examples keep their originallyrelative scales for better illustrating the different characteristics (mainly nucleus size) between normal and abnormal cells.
TABLE 2ConvNet-T architectures for cervical cell classification.
Input conv1 pool1 conv2 pool2 conv3 conv4 conv5 pool5 fc6 fc7 fc8Filter size - 11×11 3×3 5×5 3×3 3×3 3×3 3×3 3×3 - -Channels 3 96 96 256 256 384 384 256 256 1024 256 2Stride - 4 2 1 2 1 1 1 2 - - -Padding - - - 2 - 1 1 1 - - - -
In testing, we obtain the final score by averaging the scores ofthe fc8 output on 1000 patches (Nv = 100 augmentations eachwith Nc = 10 sub-crops).
3.4 Evaluation Methods
We evaluate the cervical cell classification using five-fold CV onboth Herlev and HEMLBC datasets, to facilitate comparison withmost previously reported results. In each of the 5 iterations of theConvNet, 4 of 5 folds are used as training data, and the remainingone as validation. It’s worth mentioning that data augmentationis after the training/validation splitting of cell population. Weobtain the model’s final performance values by averaging resultsfrom the 5 validation sets. The performance evaluation metricsinclude sensitivity (Sens), specificity (Spec), accuracy (Acc),harmonic mean (H-mean), F -measure, and area under the ROCcurve (AUC), where Sens measures the proportion of correctlyidentified abnormal cells, and Spec the proportion of correctlyidentified normal cells; Acc is the global percentage of correctlyclassified cells; H-mean = 2 × Sens×Spec
Sens+Spec , used in [20], takesinto account the imbalanced data distribution; F -measure, theharmonic mean of precision and recall, is used in [21]. The ROCcurve is computed by varying thresholds on the final classificationscores (each final score is the average score of 1000 predictions).To test the robustness of our method against localization error ofnucleus center, we randomly translate the ground truth centers ofthe test cells up to 5 or 10 pixels in both x and y directions, and theresulting performances on Herlev dataset are reported. In addition,the numbers of correct classification (normal vs. abnormal) and thedistribution (shown by box plots) of the predicted abnormal scores
of all cells for each of the seven cell classes (listed in Table 1)are reported. Finally, we further consider the 7-class classificationproblem by simply modifying the number of neurons in the lastfc layer from 2 to 7, and report the overall error (OE)% as in [17],[19].
4 RESULTS
4.1 ConvNet Learning Results
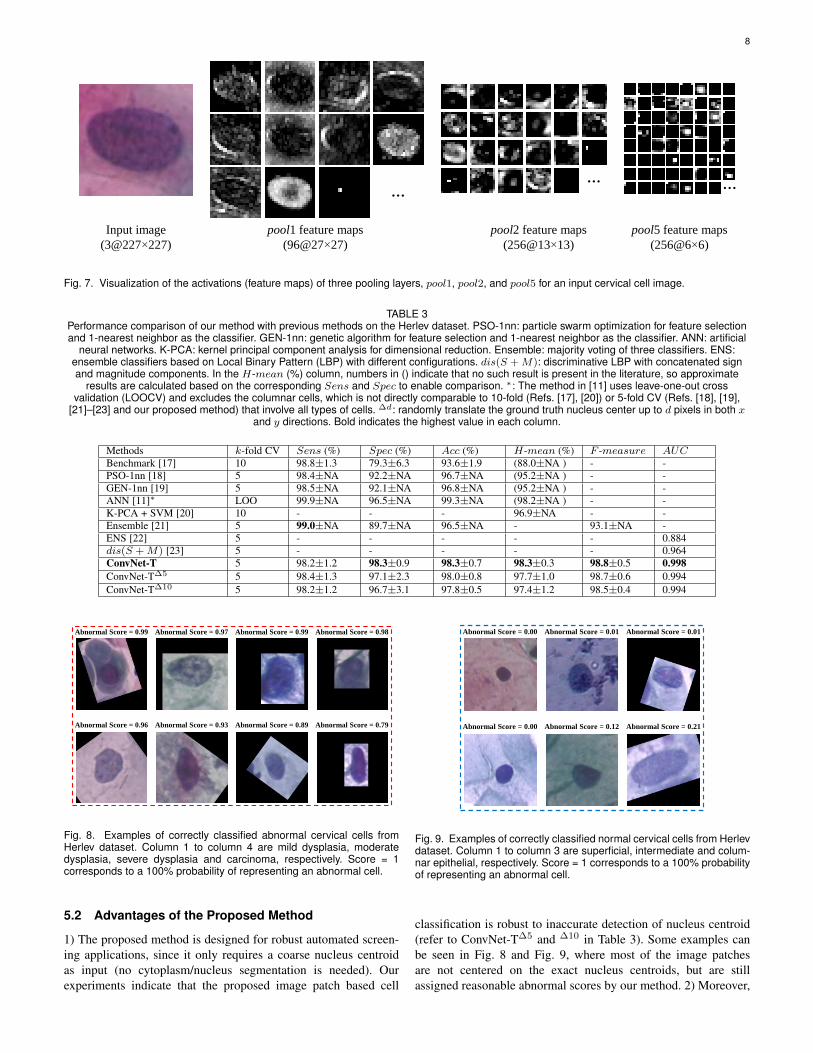
Fig. 5 illustrates a fine-tuning process of ConvNet-T during 30training epochs on the Herlev dataset. As shown in the figure, after6 epochs, the validation loss reaches its minimum value (0.119),with a corresponding validation accuracy of 0.972. Fig. 6 showsthe learned filters of the first convolutional layer of ConvNet-T trained on the Herlev Pap smear dataset. These automaticallylearned filters mainly consist of gradients of different frequenciesand orientations and blobs of color, which are necessary for thecervical cell classification task. Along with these learned filters,the activations (feature maps) of an example cell at differentpooling layers (pool1, pool2, and pool5) are provided in Fig.7. One can observe that the pooling operation summarizes theinput cell image or previous feature maps by highlighting the ac-tivated spatial locations, and that the features become increasinglyabstract in deeper layers of the ConvNet.

7
(a) (b)
Fig. 5. (a) Training and validation loss, and (b) validation accuracyversus number of training epochs.
Fig. 6. Visualization of the 96 filters with size of 11 × 11 × 3 in the firstconvolutional layer of ConvNet-T fine-tuned on Pap smear dataset.
4.2 Qualitative Results
Fig. 8 and Fig. 9 contain examples of correctly classified ab-normal and normal cell patches from the validation Herlev dataset,respectively. Fig. 10 provides examples of misclassified cervicalcells from both Herlev and HEMLBC datasets, including bothfalse negatives and false positives. The first two false negativesare instances of carcinoma, and the third one is an example ofsevere dysplasia. All false positives are columnar epithelial cells.
4.3 Quantitative Results on Herlev Dataset
Table 3 shows the classification performance (Sens, Spec,Acc, H-mean, F -measure, and AUC) of our method in com-parison with previous methods [11], [17]–[20], [22], [23] on theHerlev dataset. The mean values of Sens, Spec, Acc, H-mean,F -measure, andAUC from our method (ConvNet-T) are 98.2%,98.3%, 98.3%, 98.3%, 98.8%, and 0.998, respectively. We thusoutperform previous methods in all metrics but Sens, which isslightly below others. Among these metrics, our Spec (98.3%)substantially surpasses the previous highest result (92.2%). Alsonote that certain degree of localization error (up to 10 pixels) ofnucleus center only results in a small reduction of performancesof our method (e.g., Acc from 98.3% to 97.8%).
Table 4 provides the numbers (and corresponding percentages)of correct classification for each of the seven cell classes. Ourmethod shows perfect performance on two types of normal cell(superficial and intermediate squamous epithelial), as well as onetype of abnormal cell (mild dysplasia). While the performancesare relatively lower for columnar epithelial and severe squamousnon-keratinizing dysplasia (both are 95.9%). The distribution ofthe abnormal scores of all cells for the seven cell classes areshown as box plots in Fig. 11. The proposed method returnsabnormality-scores close to 0 or 1 for most normal and abnormalcells, respectively. The few misclassifications mainly occur to
normal columnar and severe squamous cells, given the probabilitythreshold at 0.5.
Finally, for the 7-class problem, an overall error (OE) of 1.6%is achieved on average. Such an error is lower than errors ofprevious methods, such as 7.9% [17] and 3.9% [19].
4.4 Quantitative Results on HEMLBC Dataset
Table 5 compares the classification performance betweenthe proposed deep ConvNet-based method and our previousMLP (multilayer perceptron)-based method [6] on the HEMLBCdataset. Although the dataset used in this paper is a subset slightlysmaller than that used in [6], an obvious trend of performanceimprovement can be observed.
4.5 Computational Speed
The average training time of a ConvNet-T running over upto 30 epochs is about 4 hours. Using the Nv × Nc = 1000classification strategy, the testing time for one cervical cell is 3.5seconds on average.
5 DISCUSSION
5.1 Comparison With Previous Methods
The methods in [17]–[21] follow the traditional cell classifica-tion pipeline – with features derived from manually segmentedcytoplasms/nuclei. The techniques presented in [22], [23] performdirect texture classification of the input image. In contrast, ourmethod automatically learns from the input image patch, andthus is not limited by the shortcomings of cell segmentation orfeature design. The Sens values of previous methods are slightlyhigher than those from our method (99.0% vs. 98.2% under 5-fold CV). Such high Sens results mainly from the imbalanceddata distribution – number of abnormal cells ∼ 3 X higher thanthe number of normal cells – which induces the classifier topredict more cells as abnormal. High Sens even at the expenseof fairly low Spec is required for specimen level diagnosis, asall positives will be reexamined by human experts. However,considering the abundance of normal cells (up to 300,000) in aPap smear slide, the resulting lower Spec will generate many falsepositives in clinical practice. For example, a 92% specificity [18],[19] will result in about 24,000 false positive cells. As a result,extensive and tedious targeted reading from a human observerwill be necessary to refine the accuracy of the screening. Ourapproach substantially decreases the number of false positives.Although there are still about 1.7% false positives, they onlycome from columnar epithelial cells (Table 4). Actually, the dif-ferentiation between some columnar epithelial cells and (severe)abnormal cells are also challenging for experienced pathologists.Our method perfectly eliminates the majority types of normalcells (superficial and intermediate epithelial) in a specimen, andthus alleviates the labor burden of targeted reading and potentiallyreduces screening errors. Compared to our previous MLP method[6] on HEMLBC dataset, the deep ConvNet method achieves bothhigher Sens and Spec at cell level. Actually, the automation-assisted screening system [6] built upon the MLP method has asatisfyingly high Sens=88% and a perfect Spec=100% at slidelevel by pathologist’s targeted reading. Therefore, our new methodhas a high potential to further improve the Sens of screeningsystem while reducing the labor burden of targeted reading.
8
Input image
(3@227×227)
pool1 feature maps
(96@27×27)
… …
…
pool2 feature maps
(256@13×13)
pool5 feature maps
(256@6×6)
Fig. 7. Visualization of the activations (feature maps) of three pooling layers, pool1, pool2, and pool5 for an input cervical cell image.
TABLE 3Performance comparison of our method with previous methods on the Herlev dataset. PSO-1nn: particle swarm optimization for feature selectionand 1-nearest neighbor as the classifier. GEN-1nn: genetic algorithm for feature selection and 1-nearest neighbor as the classifier. ANN: artificial
neural networks. K-PCA: kernel principal component analysis for dimensional reduction. Ensemble: majority voting of three classifiers. ENS:ensemble classifiers based on Local Binary Pattern (LBP) with different configurations. dis(S +M): discriminative LBP with concatenated signand magnitude components. In the H-mean (%) column, numbers in () indicate that no such result is present in the literature, so approximate
results are calculated based on the corresponding Sens and Spec to enable comparison. ∗: The method in [11] uses leave-one-out crossvalidation (LOOCV) and excludes the columnar cells, which is not directly comparable to 10-fold (Refs. [17], [20]) or 5-fold CV (Refs. [18], [19],
[21]–[23] and our proposed method) that involve all types of cells. ∆d: randomly translate the ground truth nucleus center up to d pixels in both xand y directions. Bold indicates the highest value in each column.
Methods k-fold CV Sens (%) Spec (%) Acc (%) H-mean (%) F -measure AUCBenchmark [17] 10 98.8±1.3 79.3±6.3 93.6±1.9 (88.0±NA ) - -PSO-1nn [18] 5 98.4±NA 92.2±NA 96.7±NA (95.2±NA ) - -GEN-1nn [19] 5 98.5±NA 92.1±NA 96.8±NA (95.2±NA ) - -ANN [11]∗ LOO 99.9±NA 96.5±NA 99.3±NA (98.2±NA ) - -K-PCA + SVM [20] 10 - - - 96.9±NA - -Ensemble [21] 5 99.0±NA 89.7±NA 96.5±NA - 93.1±NA -ENS [22] 5 - - - - - 0.884dis(S +M) [23] 5 - - - - - 0.964ConvNet-T 5 98.2±1.2 98.3±0.9 98.3±0.7 98.3±0.3 98.8±0.5 0.998ConvNet-T∆5 5 98.4±1.3 97.1±2.3 98.0±0.8 97.7±1.0 98.7±0.6 0.994ConvNet-T∆10 5 98.2±1.2 96.7±3.1 97.8±0.5 97.4±1.2 98.5±0.4 0.994
Abnormal Score = 0.99 Abnormal Score = 0.97 Abnormal Score = 0.99 Abnormal Score = 0.98
Abnormal Score = 0.96 Abnormal Score = 0.93 Abnormal Score = 0.89 Abnormal Score = 0.79
Fig. 8. Examples of correctly classified abnormal cervical cells fromHerlev dataset. Column 1 to column 4 are mild dysplasia, moderatedysplasia, severe dysplasia and carcinoma, respectively. Score = 1corresponds to a 100% probability of representing an abnormal cell.
5.2 Advantages of the Proposed Method
1) The proposed method is designed for robust automated screen-ing applications, since it only requires a coarse nucleus centroidas input (no cytoplasm/nucleus segmentation is needed). Ourexperiments indicate that the proposed image patch based cell
Abnormal Score = 0.00 Abnormal Score = 0.01 Abnormal Score = 0.01
Abnormal Score = 0.00 Abnormal Score = 0.12 Abnormal Score = 0.21
Fig. 9. Examples of correctly classified normal cervical cells from Herlevdataset. Column 1 to column 3 are superficial, intermediate and colum-nar epithelial, respectively. Score = 1 corresponds to a 100% probabilityof representing an abnormal cell.
classification is robust to inaccurate detection of nucleus centroid(refer to ConvNet-T∆5 and ∆10 in Table 3). Some examples canbe seen in Fig. 8 and Fig. 9, where most of the image patchesare not centered on the exact nucleus centroids, but are stillassigned reasonable abnormal scores by our method. 2) Moreover,

9
(a) Herlev
(b) HEMLBC
Abnormal misclassified as normal Normal misclassified as abnormal
Abnormal misclassified as normal Normal misclassified as abnormal
Fig. 10. Examples of misclassified cervical cells from (a) Herlev dataset;(b) HEMLBC dataset. All images are shown at their original scales.
TABLE 4Numbers (and percentages) of correct classification (normal vs.abnormal) for each of the seven cell classes in Herlev dataset.
Cell type Correct classificationSuperficial squamous epithelial 74 (100%)Intermediate squamous epithelial 70 (100%)Columnar epithelial 94 (95.9%)Mild squamous non-keratinizing dysplasia 182 (100%)Moderate squamous non-keratinizing dysplasia 145 (99.3%)Severe squamous non-keratinizing dysplasia 189 (95.9%)Squamous cell carcinoma in situ intermediate 147 (98.0%)
Fig. 11. Box plots shown the distribution of abnormal scores of all cellsin the seven classes from Herlev dataset. Blue and red backgroundsindicate normal and abnormal cell categories, respectively. Black dashline is the score threshold 0.5.
TABLE 5Performance comparison of our method with a previous method on theHEMLBC dataset. ConvNet-T∗— It’s worth mention that the 989/989abnormal/normal cells used in this paper is a subset of 1,126/1,126
abnormal/normal cells used in [6] due to data missing of someabnormal cells.
Methods k-fold CV Sens (%) Spec (%) Acc (%)MLP [6] 5 92.5±NA 96.0±NA 94.3±NAConvNet-T∗ 5 98.3±0.7 99.0±1.0 98.6±0.3
our method is able to distinguish the abnormal and normal cellseven for some “difficult” cases. For example, the two columnarepithelial cells in the third column in Fig. 9 appear to exhibit afar greater level of abnormality than a severe dysplasia cell (lowerone in the third column in Fig. 8), as these columnar cells havemuch larger nuclei or nonuniform chromatin distributions. Un-
like traditional morphology/texture based classification methods,which simply classify both cells as abnormal, our method providesa much higher abnormal score (0.89) for the severe dysplasiacell than the two columnar cells (0.01 and 0.21). This indicatesthat the ConvNet-T captures some latent but essential featuresembedded in the cell images. 3) Finally, the deep learning basedmethod has high Sens and especially high Spec, and producesthe highest performances on a Pap-stained Pap smear (Herlev) anda H&E stained liquid-based cytology (HEMLBC) datasets. Sucha strong performance has the potential to boost the developmentof automation-assisted reading systems in primary cervical cancerscreening.
5.3 LimitationsDespite its high performance, our method demonstrates a fewlimitations hindering its inclusion in existing cervical screeningsystems. 1) Classification of a single patch requires 3.5 seconds,which is far too slow in a clinical setting. One could addressthis issue by eliminating the image patch augmentation step (100variants per patch) from the testing phase, thus reducing speedto 0.035 seconds while compromising accuracy by only ∼ 1%.2) Despite high classification accuracy on the Herlev dataset, ourmethod misclassify a few severe dysplasia (4.1%) and carcinoma(2%) cells as normal (Table 4 and Fig. 11). As shown in Fig.10(a), two dark stained carcinoma nuclei and a very large severedysplasia nucleus are incorrectly classified as normal. An idealscreening system should not miss such severe abnormalities. Tobetter handle such mis-classifications, cytoplasm/nucleus segmen-tation based features could be integrated into the system, either viadeep learning or via “TBS” rules. Furthermore, both Herlev andHEMLBC are mainly consisted of expert-selected “typical” cells.The real life situation is more complex so more investigations areneeded before transferring the results of this study to practice. Forexample, refer to the last two false positive cells in Fig. 10(b), theyare from NILM slides, but it’s hard to tell whether: the first oneis an abnormal or normal cell due to poor imaging quality, andthe second one is a normal atrophic cell or an abnormal cell. 3) Anucleus center is pre-required for applying our method, and is ob-tained from the ground truth segmentation in this paper. However,screening of abnormal cells within a given field-of-view requiresautomated detection of nucleus centers. Our ongoing study showsthat this may easily be achieved using the fully convolutionalnetworks (FCN) [15], [56] for semantic segmentation of cervicalcells. And we already show that our method is robust to certainamount of inaccurate nucleus center detection. 4) The currentexperiments are conducted on a majority of images with individualcells. The effect of overlapping nuclei, cell clumps and artifactson classification accuracy needs to be analyzed more extensivelyin the future investigation, since a screening system is expected toable to avoid misclassifying such objects as abnormal cells. Task-specific classifiers (mostly likely relying on deep learning) may beneeded to handle these problems [3], [5], [6].
6 CONCLUSION
This paper proposes a convolutional neural network-based methodto classify cervical cells. Unlike previous methods, which relyon cytoplasm/nucleus segmentation and hand-crafted features,our method automatically extracts deep features embedded inthe cell image patch for classification. It consists in extractingimage patches coarsely centered on the nucleus as network input,

10
transferring features from another pre-trained model into a newConvNet for fine-tuning on the cell image patches, and aggregatingmultiple predictions to form the final network output. The pro-posed method yields the highest performance on both the HerlevPap smear and the HEMLBC liquid-based cytology datasets,compared to previous methods. We anticipate that a segmentation-free, highly accurate cervical cell classification system of this typeis promising for the development of automation-assisted readingsystems for primary cervical screening.
ACKNOWLEDGMENTS
This work was supported in part by the Intramural ResearchProgram at the NIH Clinical Center, and the National NaturalScience Foundation of China (81501545). The authors thankNvidia for the TITAN Z GPU donation.
REFERENCES
[1] E. Davey, A. Barratt, L. Irwig, S. F. Chan, P. Macaskill, P. Mannes, andA. M. Saville, “Effect of study design and quality on unsatisfactory rates,cytology classifications, and accuracy in liquid-based versus conventionalcervical cytology: a systematic review,” The Lancet, vol. 367, no. 9505,pp. 122–132, 2006.
[2] D. Saslow, D. Solomon, H. W. Lawson, M. Killackey, S. L. Kulasingam,J. Cain, F. A. Garcia, A. T. Moriarty, A. G. Waxman, D. C. Wilburet al., “American cancer society, american society for colposcopy andcervical pathology, and american society for clinical pathology screeningguidelines for the prevention and early detection of cervical cancer,” CA:A Cancer Journal for Clinicians, vol. 62, no. 3, pp. 147–172, 2012.
[3] G. G. Birdsong, “Automated screening of cervical cytology specimens,”Human Pathology, vol. 27, no. 5, pp. 468–481, 1996.
[4] H. C. Kitchener, R. Blanks, G. Dunn, L. Gunn, M. Desai, R. Albrow,J. Mather, D. N. Rana, H. Cubie, C. Moore, R. Legood, A. Gray,and S. Moss, “Automation-assisted versus manual reading of cervicalcytology (MAVARIC): a randomised controlled trial,” Lancet Oncol.,vol. 12, no. 1, pp. 56–64, 2011.
[5] E. Bengtsson and P. Malm, “Screening for cervical cancer using auto-mated analysis of pap-smears,” Comput. Math. Method Med., vol. 2014,pp. 1–12, 2014.
[6] L. Zhang, H. Kong, C. T. Chin, S. Liu, X. Fan, T. Wang, and S. Chen,“Automation-assisted cervical cancer screening in manual liquid-basedcytology with hematoxylin and eosin staining,” Cytom. Part A, vol. 85,no. 3, pp. 214–230, 2014.
[7] A. Genctav, S. Aksoy, and S. Onder, “Unsupervised segmentation andclassification of cervical cell images,” Pattern Recognit., vol. 45, no. 12,pp. 4151–4168, 2012.
[8] M. E. Plissiti and C. Nikou, “Overlapping cell nuclei segmentation usinga spatially adaptive active physical model,” IEEE Trans. Image Process.,vol. 21, no. 11, pp. 4568–4580, 2012.
[9] Y.-F. Chen, P.-C. Huang, K.-C. Lin, H.-H. Lin, L.-E. Wang, C.-C. Cheng,T.-P. Chen, Y.-K. Chan, and J. Y. Chiang, “Semi-automatic segmentationand classification of pap smear cells,” IEEE Journal of Biomedical andHealth Informatics, vol. 18, no. 1, pp. 94–108, 2014.
[10] L. Zhang, H. Kong, C. T. Chin, S. Liu, Z. Chen, T. Wang, and S. Chen,“Segmentation of cytoplasm and nuclei of abnormal cells in cervicalcytology using global and local graph cuts,” Comput. Med. ImagingGraph., vol. 38, no. 5, pp. 369–380, 2014.
[11] T. Chankong, N. Theera-Umpon, and S. Auephanwiriyakul, “Automaticcervical cell segmentation and classification in pap smears,” Comput.Meth. Programs Biomed., vol. 113, no. 2, pp. 539–556, 2014.
[12] Y. Song, L. Zhang, S. Chen, D. Ni, B. Lei, and T. Wang, “Accuratesegmentation of cervical cytoplasm and nuclei based on multi-scaleconvolutional network and graph partitioning,” IEEE Trans. Biomed.Eng., vol. 62, no. 10, pp. 2421–2433, 2015.
[13] Z. Lu, G. Carneiro, A. Bradley, D. Ushizima, M. S. Nosrati, A. Bianchi,C. Carneiro, and G. Hamarneh, “Evaluation of three algorithms for thesegmentation of overlapping cervical cells,” IEEE Journal of Biomedicaland Health Informatics, 2016.
[14] L. Zhang, H. Kong, S. Liu, T. Wang, S. Chen, and M. Sonka, “Graph-based segmentation of abnormal nuclei in cervical cytology,” Computer-ized Medical Imaging and Graphics, vol. 56, pp. 38–48, 2017.
[15] L. Zhang, M. Sonka, L. Lu, R. M. Summers, and J. Yao, “Combiningfully convolutional networks and graph-based approach for automatedsegmentation of cervical cell nuclei,” in 2017 IEEE 14th InternationalSymposium on Biomedical Imaging, 2017.
[16] E. Martin, “Pap-smear classification,” Master Thesis, Technical Univer-sity of Denmark, 2003.
[17] J. Jantzen, J. Norup, G. Dounias, and B. Bjerregaard, “Pap-smear bench-mark data for pattern classification,” Nature inspired Smart InformationSystems (NiSIS 2005), pp. 1–9, 2005.
[18] Y. Marinakis, M. Marinaki, and G. Dounias, “Particle swarm optimiza-tion for pap-smear diagnosis,” Expert Systems with Applications, vol. 35,no. 4, pp. 1645–1656, 2008.
[19] Y. Marinakis, G. Dounias, and J. Jantzen, “Pap smear diagnosis usinga hybrid intelligent scheme focusing on genetic algorithm based featureselection and nearest neighbor classification,” Computers in Biology andMedicine, vol. 39, no. 1, pp. 69–78, 2009.
[20] M. E. Plissiti and C. Nikou, “On the importance of nucleus features inthe classification of cervical cells in pap smear images,” in Intl WorkshopPattern Recogn Health Anal, vol. 2012, 2012, p. 11.
[21] K. Bora, M. Chowdhury, L. B. Mahanta, M. K. Kundu, and A. K.Das, “Automated classification of pap smear images to detect cervicaldysplasia,” Computer Methods and Programs in Biomedicine, vol. 138,pp. 31–47, 2017.
[22] L. Nanni, A. Lumini, and S. Brahnam, “Local binary patterns variants astexture descriptors for medical image analysis,” Artificial Intelligence inMedicine, vol. 49, no. 2, pp. 117–125, 2010.
[23] Y. Guo, G. Zhao, and M. PietikaInen, “Discriminative features for texturedescription,” Pattern Recognition, vol. 45, no. 10, pp. 3834–3843, 2012.
[24] B. Sokouti, S. Haghipour, and A. D. Tabrizi, “A framework for diagnos-ing cervical cancer disease based on feedforward MLP neural networkand thinprep histopathological cell image features,” Neural Computingand Applications, vol. 24, no. 1, pp. 221–232, 2014.
[25] J. Zhang and Y. Liu, “Cervical cancer detection using svm based featurescreening,” in International Conference on Medical Image Computingand Computer-Assisted Intervention. Springer, 2004, pp. 873–880.
[26] M. Zhao, A. Wu, J. Song, X. Sun, and N. Dong, “Automatic screeningof cervical cells using block image processing,” Biomedical EngineeringOnline, vol. 15, no. 1, p. 1, 2016.
[27] D. Solomon and R. Nayar, The Bethesda System for reporting cervicalcytology: definitions, criteria, and explanatory notes. Springer Science& Business Media, 2004.
[28] M. Desai, “Role of automation in cervical cytology,” DiagnosticHistopathology, vol. 15, no. 7, pp. 323–329, 2009.
[29] Y. Bengio, A. Courville, and P. Vincent, “Representation learning: Areview and new perspectives,” IEEE Transactions on Pattern Analysisand Machine intelligence, vol. 35, no. 8, pp. 1798–1828, 2013.
[30] Y. LeCun, Y. Bengio, and G. Hinton, “Deep learning,” Nature, vol. 521,no. 7553, pp. 436–444, 2015.
[31] Y. LeCun, B. Boser, J. S. Denker, D. Henderson, R. E. Howard, W. Hub-bard, and L. D. Jackel, “Backpropagation applied to handwritten zip coderecognition,” Neural Computation, vol. 1, no. 4, pp. 541–551, 1989.
[32] A. Krizhevsky, I. Sutskever, and G. E. Hinton, “ImageNet classificationwith deep convolutional neural networks,” in Advances in Neural Infor-mation Processing Systems, 2012, pp. 1097–1105.
[33] H. Greenspan, B. van Ginneken, and R. M. Summers, “Guest editorialdeep learning in medical imaging: Overview and future promise of anexciting new technique,” IEEE Transactions on Medical Imaging, vol. 35,no. 5, pp. 1153–1159, 2016.
[34] R. M. Summers, “Progress in fully automated abdominal CT interpreta-tion,” American Journal of Roentgenology, pp. 1–13, 2016.
[35] H.-C. Shin, H. R. Roth, M. Gao, L. Lu, Z. Xu, I. Nogues, J. Yao,D. Mollura, and R. M. Summers, “Deep convolutional neural networksfor computer-aided detection: CNN architectures, dataset characteristicsand transfer learning,” IEEE Transactions on Medical Imaging, vol. 35,no. 5, pp. 1285–1298, 2016.
[36] H. R. Roth, L. Lu, J. Liu, J. Yao, A. Seff, K. Cherry, L. Kim, and R. M.Summers, “Improving computer-aided detection using convolutionalneural networks and random view aggregation,” IEEE Transactions onMedical Imaging, vol. 35, no. 5, pp. 1170–1181, 2016.
[37] P. Moeskops, M. A. Viergever, A. M. Mendrik, L. S. de Vries, M. J.Benders, and I. Isgum, “Automatic segmentation of mr brain images witha convolutional neural network,” IEEE Transactions on Medical Imaging,vol. 35, no. 5, pp. 1252–1261, 2016.
[38] P. Liskowski and K. Krawiec, “Segmenting retinal blood vessels withdeep neural networks,” IEEE Transactions on Medical Imaging, 2016.
[39] T. Xu, H. Zhang, C. Xin, E. Kim, L. R. Long, Z. Xue, S. Antani,and X. Huang, “Multi-feature based benchmark for cervical dysplasia

11
classification evaluation,” Pattern Recognition, vol. 63, pp. 468–475,2017.
[40] T. Xu, H. Zhang, X. Huang, S. Zhang, and D. N. Metaxas, “Multimodaldeep learning for cervical dysplasia diagnosis,” in International Confer-ence on Medical Image Computing and Computer-Assisted Intervention.Springer, 2016, pp. 115–123.
[41] P. Buyssens, A. Elmoataz, and O. Lezoray, “Multiscale convolutionalneural networks for vision–based classification of cells,” in Asian Con-ference on Computer Vision. Springer, 2012, pp. 342–352.
[42] Z. Gao, L. Wang, L. Zhou, and J. Zhang, “Hep-2 cell image classificationwith deep convolutional neural networks,” IEEE Journal of Biomedicaland Health Informatics, 2016.
[43] J. Yosinski, J. Clune, Y. Bengio, and H. Lipson, “How transferable arefeatures in deep neural networks?” in Advances in Neural InformationProcessing Systems, 2014, pp. 3320–3328.
[44] Y. Bar, I. Diamant, L. Wolf, S. Lieberman, E. Konen, and H. Greenspan,“Chest pathology detection using deep learning with non-medical train-ing,” in 2015 IEEE 12th International Symposium on Biomedical Imag-ing, 2015, pp. 294–297.
[45] R. Girshick, J. Donahue, T. Darrell, and J. Malik, “Region-based convo-lutional networks for accurate object detection and segmentation,” IEEETransactions on Pattern Analysis and Machine intelligence, vol. 38, no. 1,pp. 142–158, 2016.
[46] O. Russakovsky, J. Deng, H. Su, J. Krause, S. Satheesh, S. Ma, Z. Huang,A. Karpathy, A. Khosla, M. Bernstein et al., “ImageNet large scale visualrecognition challenge,” International Journal of Computer Vision, vol.115, no. 3, pp. 211–252, 2015.
[47] H. Chen, D. Ni, J. Qin, S. Li, X. Yang, T. Wang, and P. A. Heng, “Stan-dard plane localization in fetal ultrasound via domain transferred deepneural networks,” IEEE Journal of Biomedical and Health Informatics,vol. 19, no. 5, pp. 1627–1636, 2015.
[48] G. Carneiro, J. Nascimento, and A. P. Bradley, “Unregistered multiviewmammogram analysis with pre-trained deep learning models,” in Interna-tional Conference on Medical Image Computing and Computer-AssistedIntervention. Springer, 2015, pp. 652–660.
[49] T. Lindeberg, “Feature detection with automatic scale selection,” Inter-national Journal of Computer Vision, vol. 30, no. 2, pp. 79–116, 1998.
[50] J. R. Uijlings, K. E. van de Sande, T. Gevers, and A. W. Smeulders, “Se-lective search for object recognition,” International Journal of ComputerVision, vol. 104, no. 2, pp. 154–171, 2013.
[51] F. Xing, Y. Xie, and L. Yang, “An automatic learning-based frameworkfor robust nucleus segmentation,” IEEE Transactions on Medical Imag-ing, vol. 35, no. 2, pp. 550–566, 2016.
[52] H. He and E. A. Garcia, “Learning from imbalanced data,” IEEETransactions on Knowledge and Data Engineering, vol. 21, no. 9, pp.1263–1284, 2009.
[53] Y. LeCun, L. Bottou, G. B. Orr, and K.-R. Muller, “Efficient backprop,”in Neural Networks: Tricks of the Trade. Springer, 2012, pp. 9–48.
[54] G. E. Hinton, N. Srivastava, A. Krizhevsky, I. Sutskever, and R. R.Salakhutdinov, “Improving neural networks by preventing co-adaptationof feature detectors,” arXiv preprint arXiv:1207.0580, 2012.
[55] Y. Jia, E. Shelhamer, J. Donahue, S. Karayev, J. Long, R. Girshick,S. Guadarrama, and T. Darrell, “Caffe: Convolutional architecture forfast feature embedding,” in Proceedings of the 22nd ACM InternationalConference on Multimedia. ACM, 2014, pp. 675–678.
[56] J. Long, E. Shelhamer, and T. Darrell, “Fully convolutional networksfor semantic segmentation,” in Proceedings of the IEEE Conference onComputer Vision and Pattern Recognition, 2015, pp. 3431–3440.