1 date: 12 november 2013 jing chen hisham haider dewan harout sahakian
TRANSCRIPT

1
Date: 12 November 2013Jing Chen
Hisham Haider DewanHarout Sahakian
Date: 12 November 2013Jing Chen
Hisham Haider DewanHarout Sahakian
2
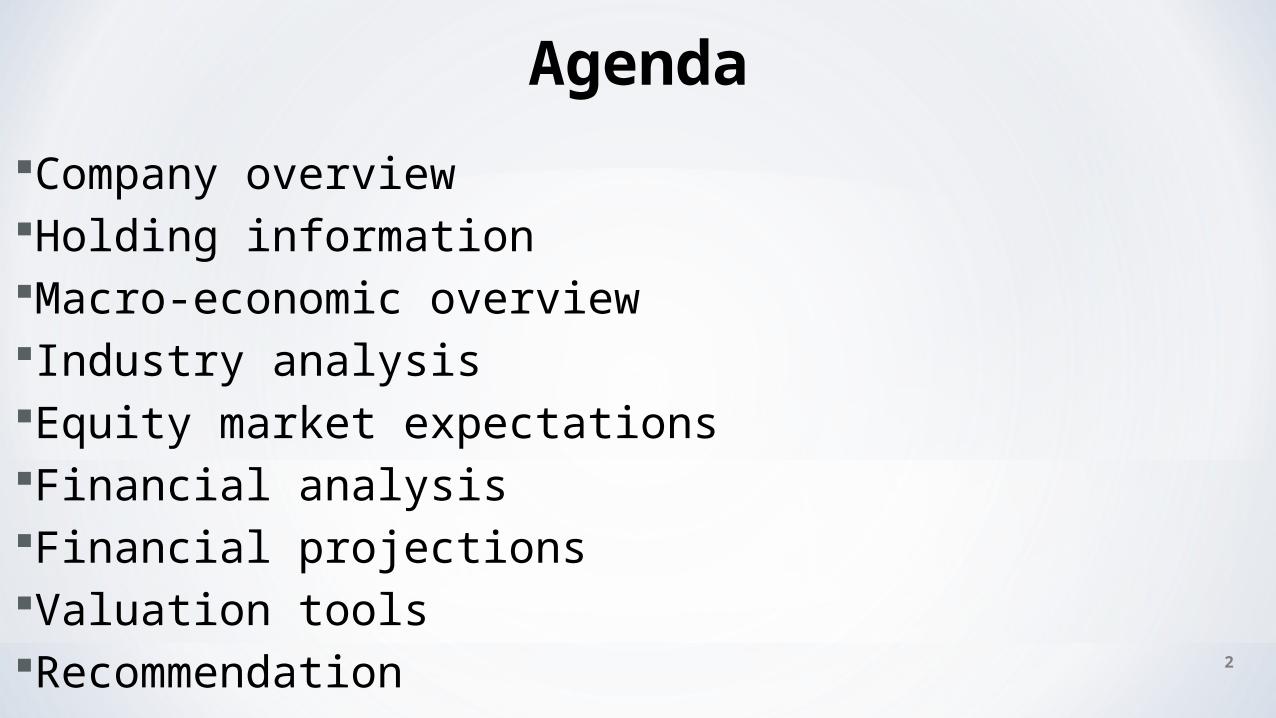
Agenda
Company overviewHolding informationMacro-economic overviewIndustry analysisEquity market expectationsFinancial analysisFinancial projectionsValuation toolsRecommendation
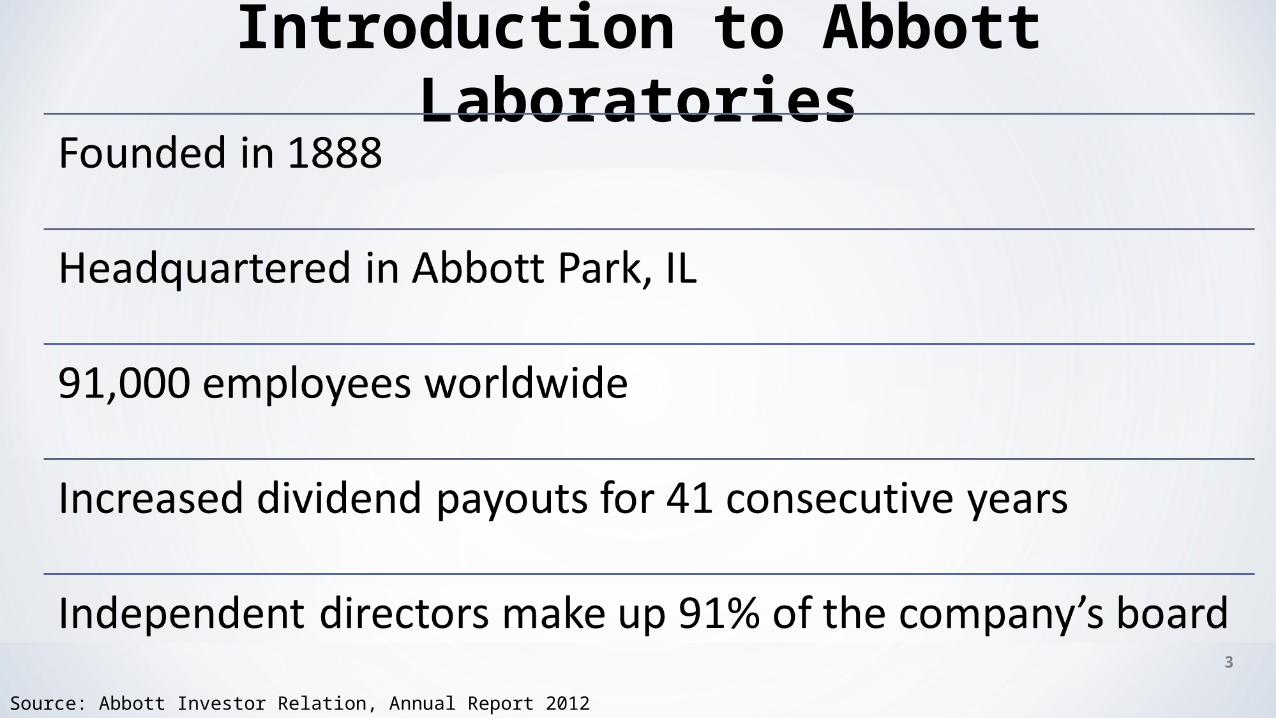
Introduction to Abbott Laboratories
Source: Abbott Investor Relation, Annual Report 2012
3
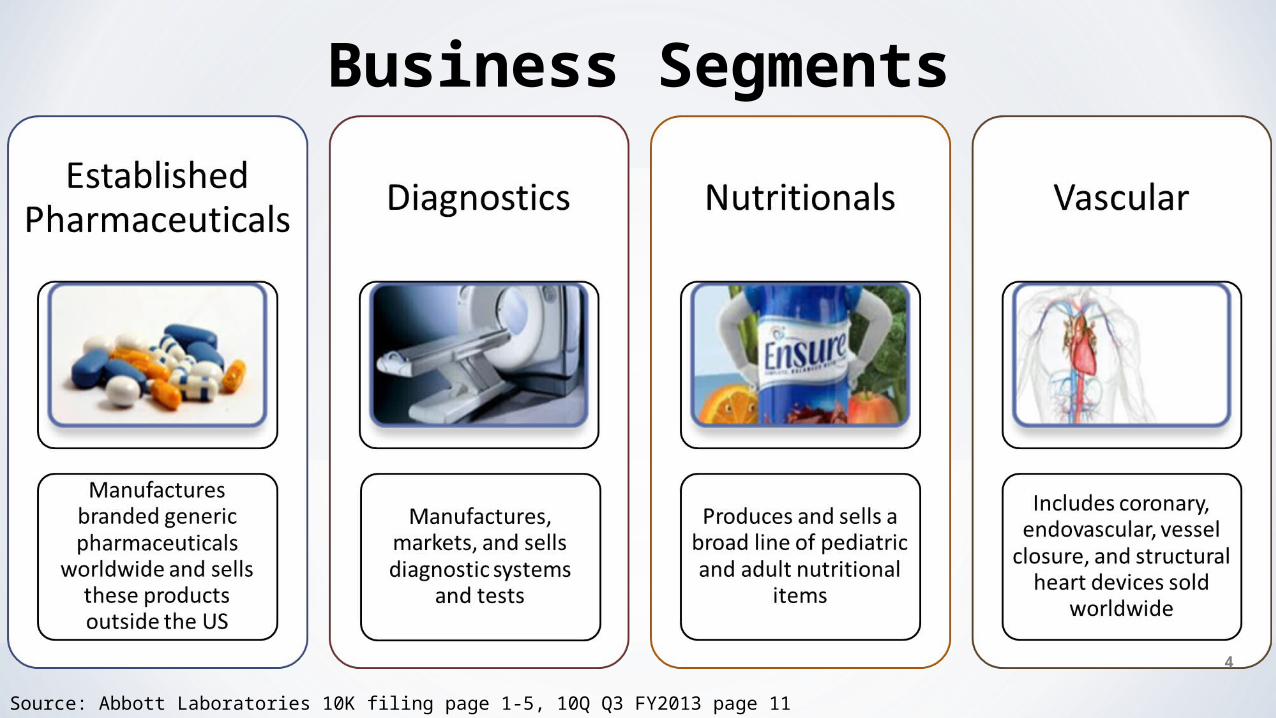
Business Segments
4
Source: Abbott Laboratories 10K filing page 1-5, 10Q Q3 FY2013 page 11
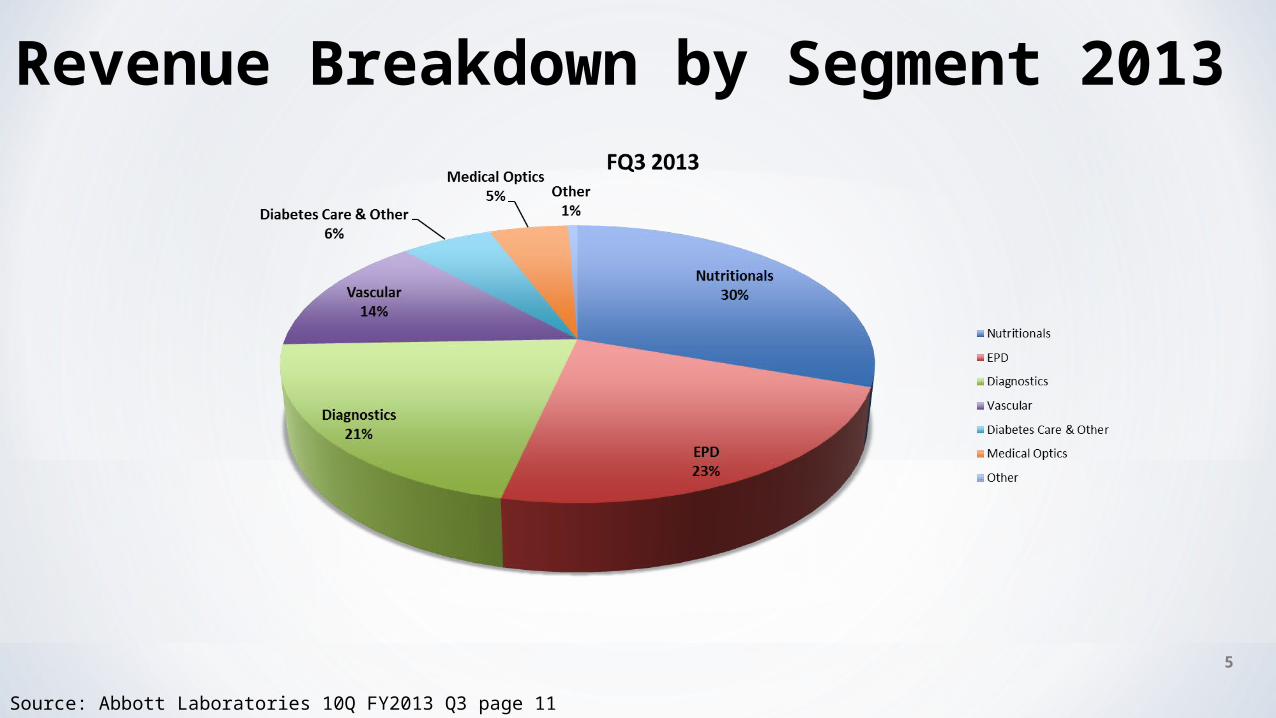
Revenue Breakdown by Segment 2013
5
Source: Abbott Laboratories 10Q FY2013 Q3 page 11
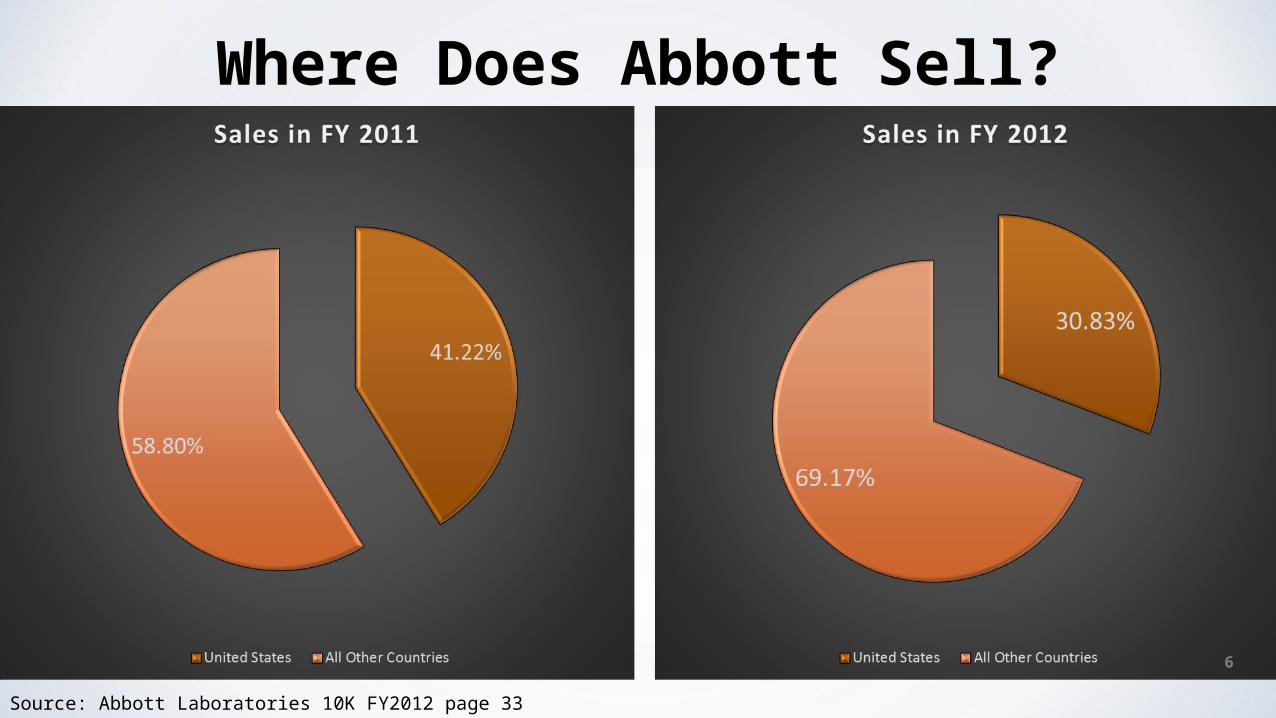
Where Does Abbott Sell?
Source: Abbott Laboratories 10K FY2012 page 33
6
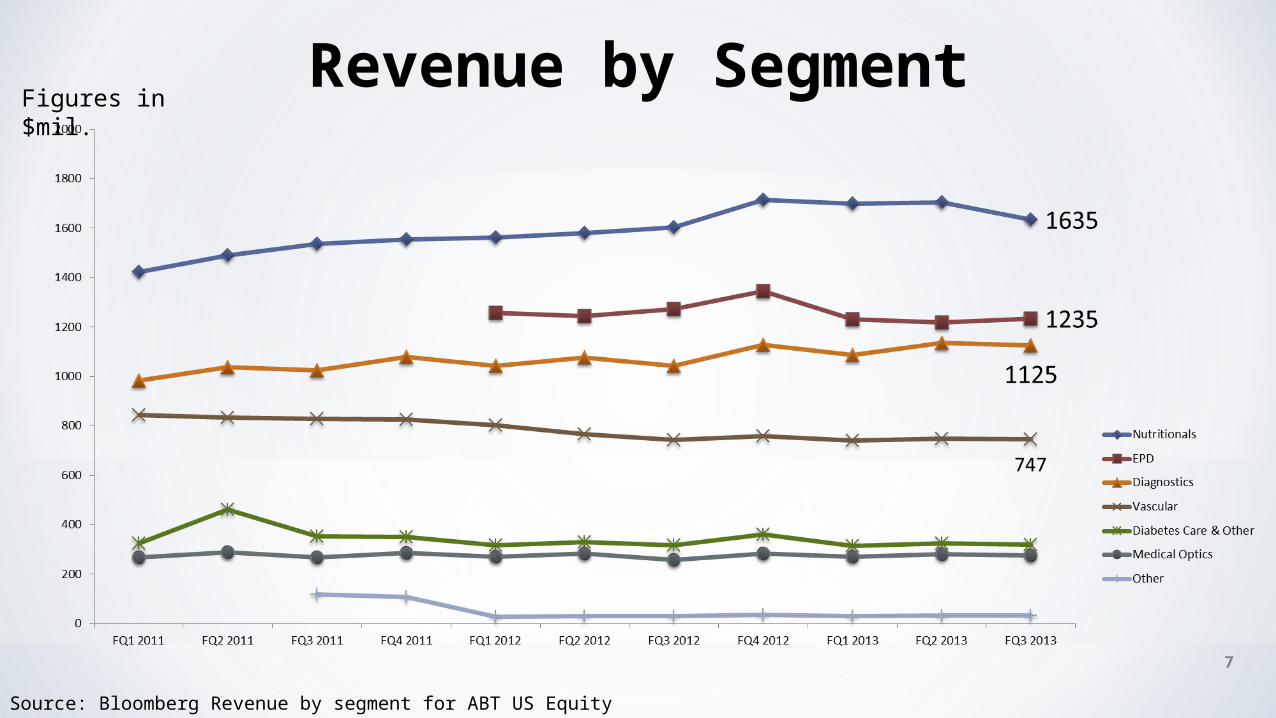
Revenue by Segment
7
Source: Bloomberg Revenue by segment for ABT US Equity
Figures in $mil.
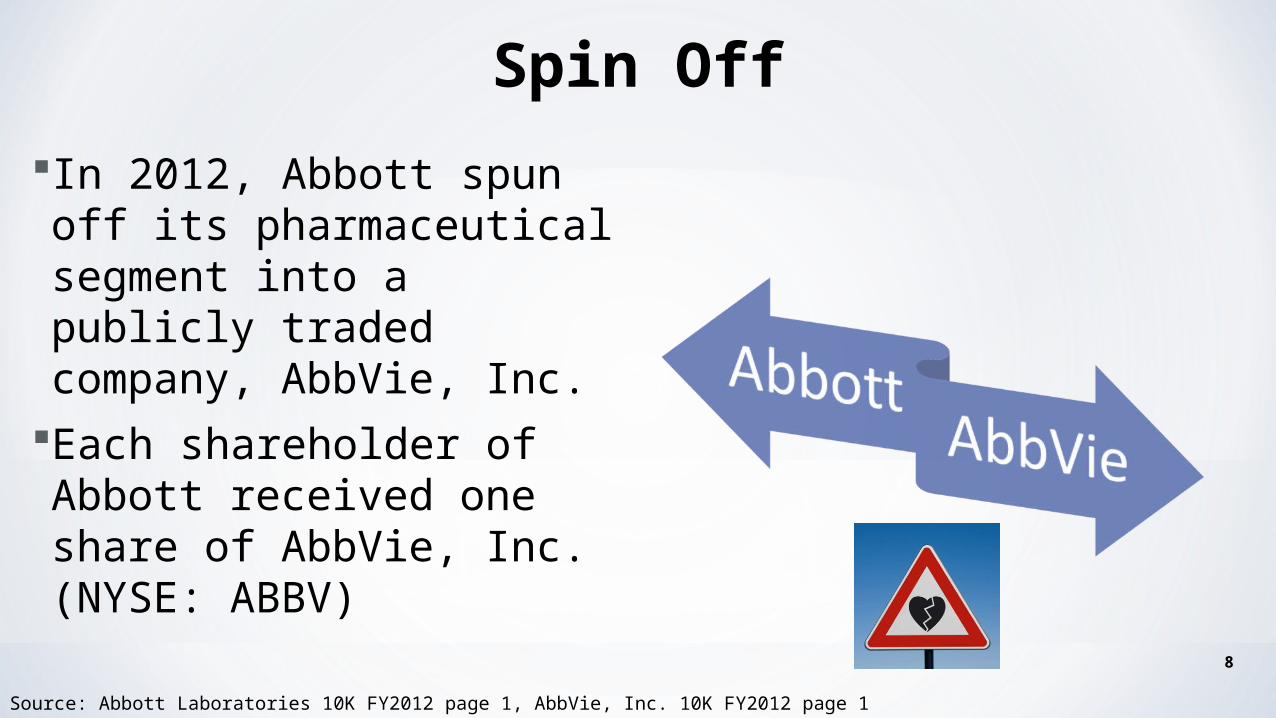
Spin Off
In 2012, Abbott spun off its pharmaceutical segment into a publicly traded company, AbbVie, Inc.
Each shareholder of Abbott received one share of AbbVie, Inc. (NYSE: ABBV)
8
Source: Abbott Laboratories 10K FY2012 page 1, AbbVie, Inc. 10K FY2012 page 1
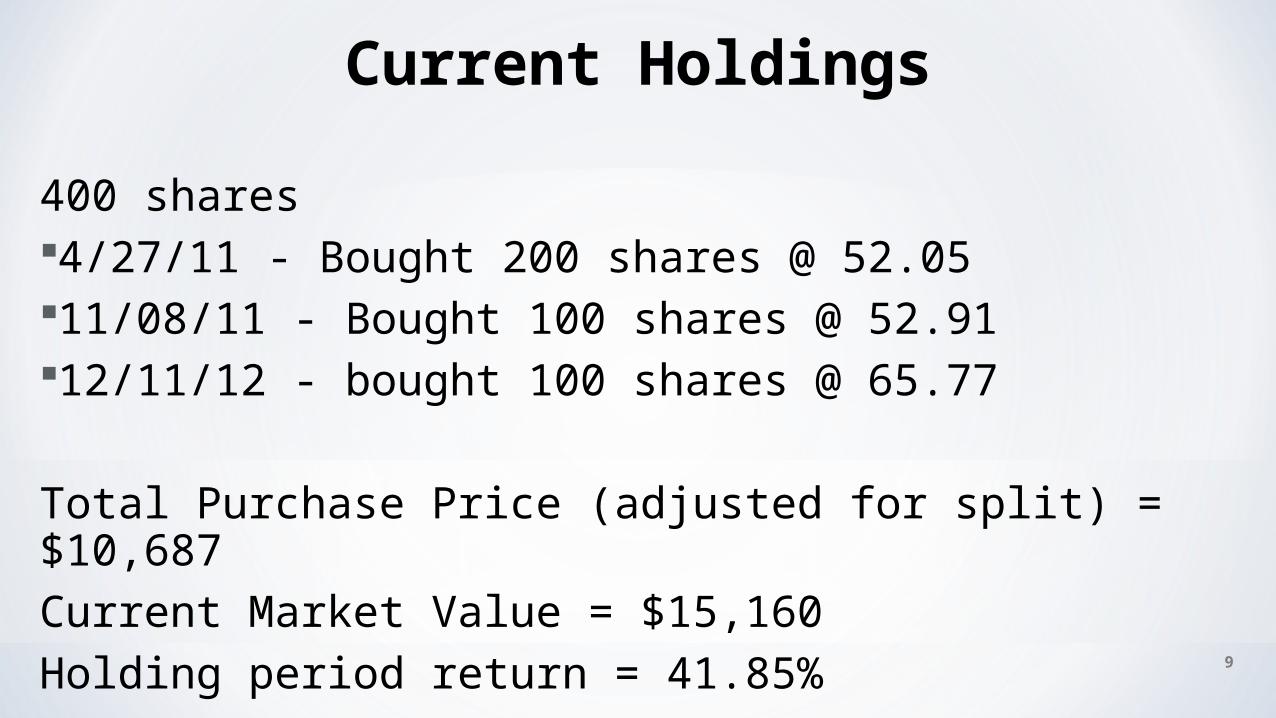
400 shares4/27/11 - Bought 200 shares @ 52.0511/08/11 - Bought 100 shares @ 52.9112/11/12 - bought 100 shares @ 65.77
Total Purchase Price (adjusted for split) = $10,687Current Market Value = $15,160Holding period return = 41.85%
Current Holdings
9
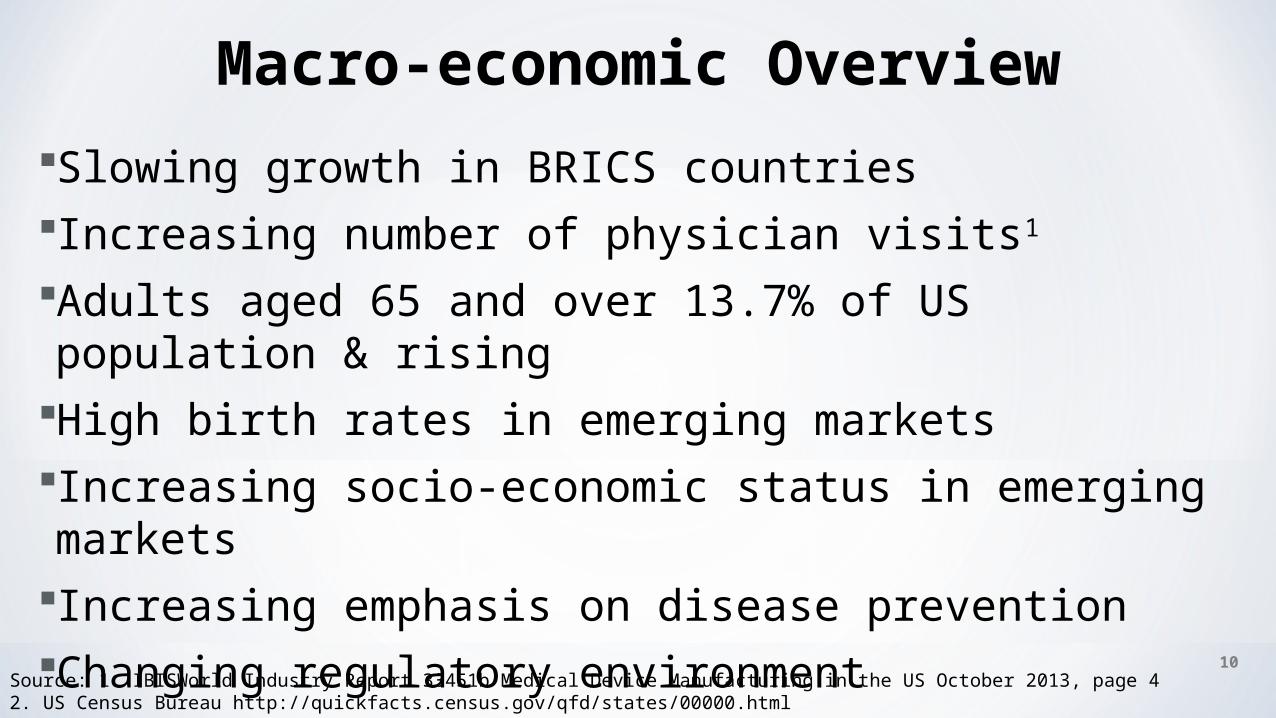
Macro-economic Overview
Slowing growth in BRICS countriesIncreasing number of physician visits1
Adults aged 65 and over 13.7% of US population & risingHigh birth rates in emerging marketsIncreasing socio-economic status in emerging marketsIncreasing emphasis on disease preventionChanging regulatory environment
10Source: 1. IBISWorld Industry Report 33451b Medical Device Manufacturing in the US October 2013, page 42. US Census Bureau http://quickfacts.census.gov/qfd/states/00000.html
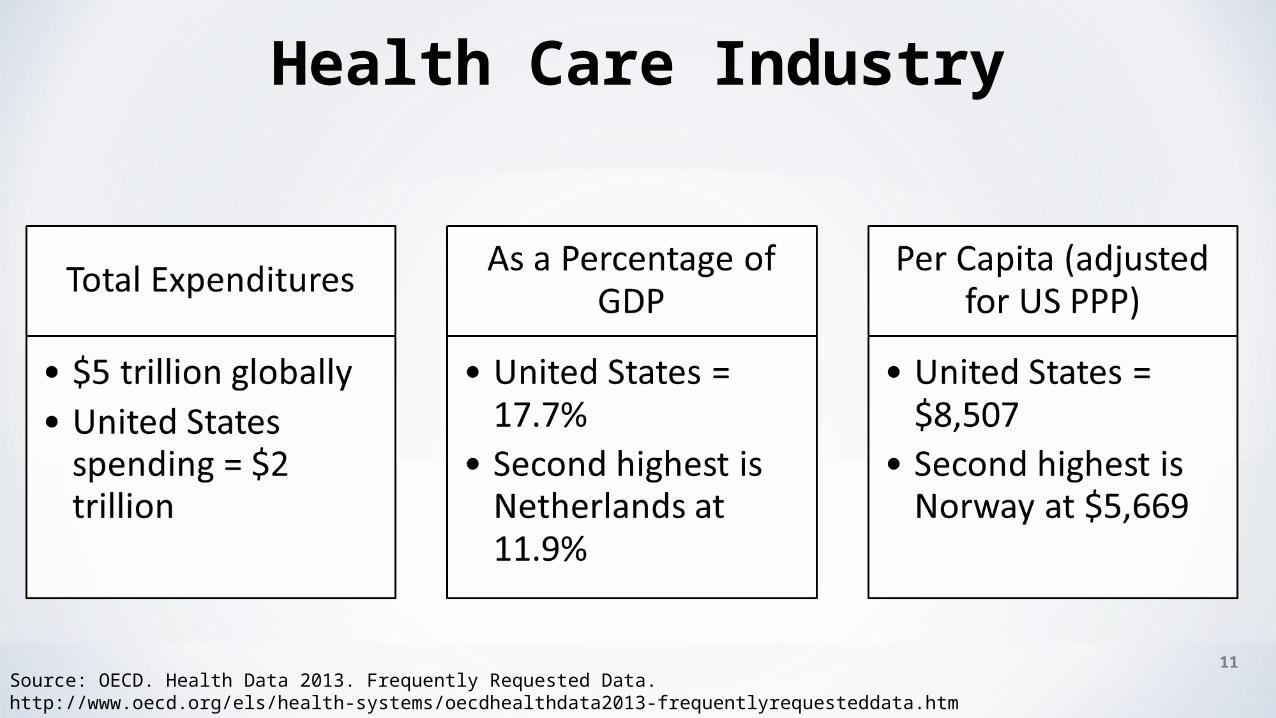
Health Care Industry
Source: OECD. Health Data 2013. Frequently Requested Data. http://www.oecd.org/els/health-systems/oecdhealthdata2013-frequentlyrequesteddata.htm 11
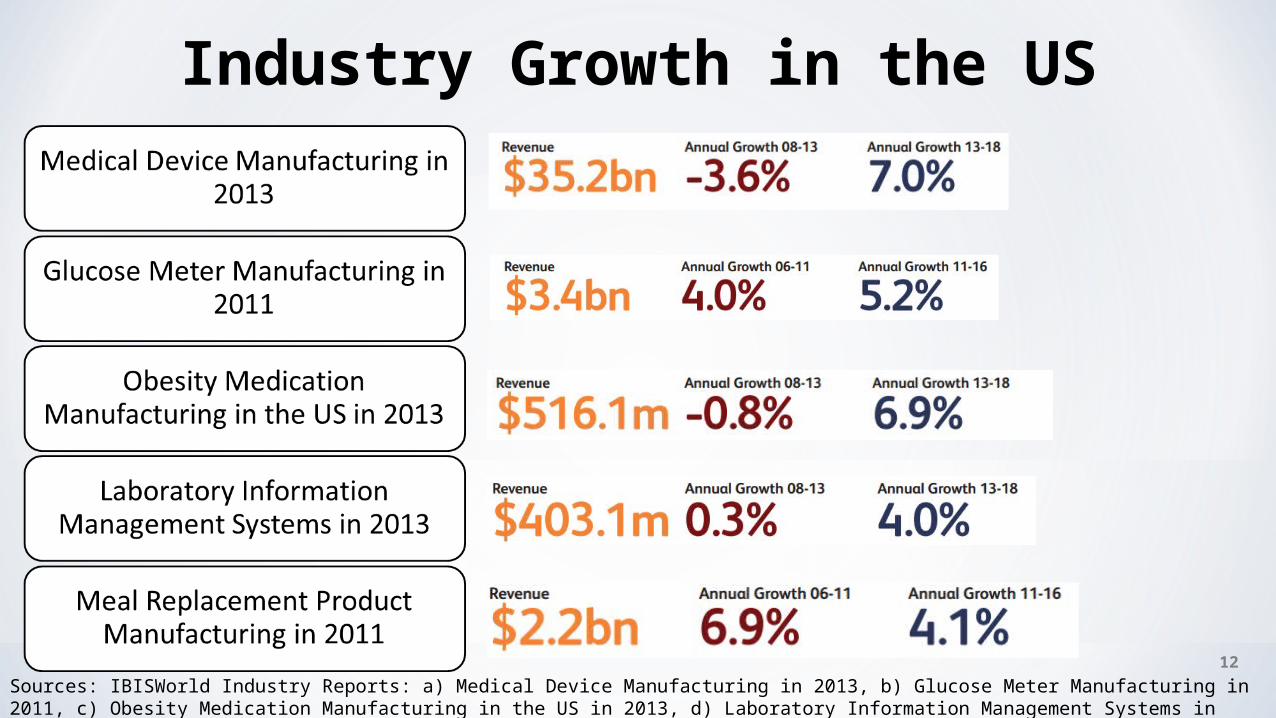
Industry Growth in the US
Sources: IBISWorld Industry Reports: a) Medical Device Manufacturing in 2013, b) Glucose Meter Manufacturing in 2011, c) Obesity Medication Manufacturing in the US in 2013, d) Laboratory Information Management Systems in 2013, e) Meal Replacement Product Manufacturing in 2011
12
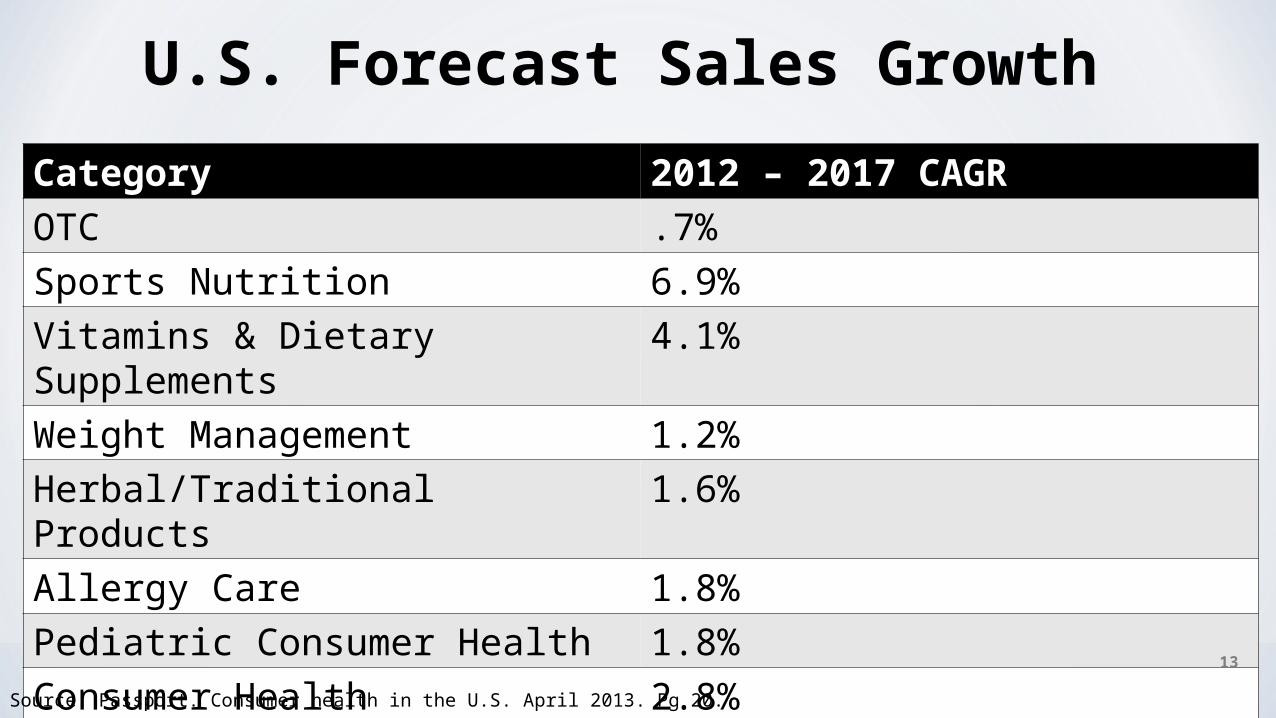
U.S. Forecast Sales Growth
Category 2012 – 2017 CAGROTC .7%Sports Nutrition 6.9%Vitamins & Dietary Supplements 4.1%Weight Management 1.2%Herbal/Traditional Products 1.6%Allergy Care 1.8%Pediatric Consumer Health 1.8%Consumer Health 2.8%
Source: Passport. Consumer health in the U.S. April 2013. Pg 20.
13
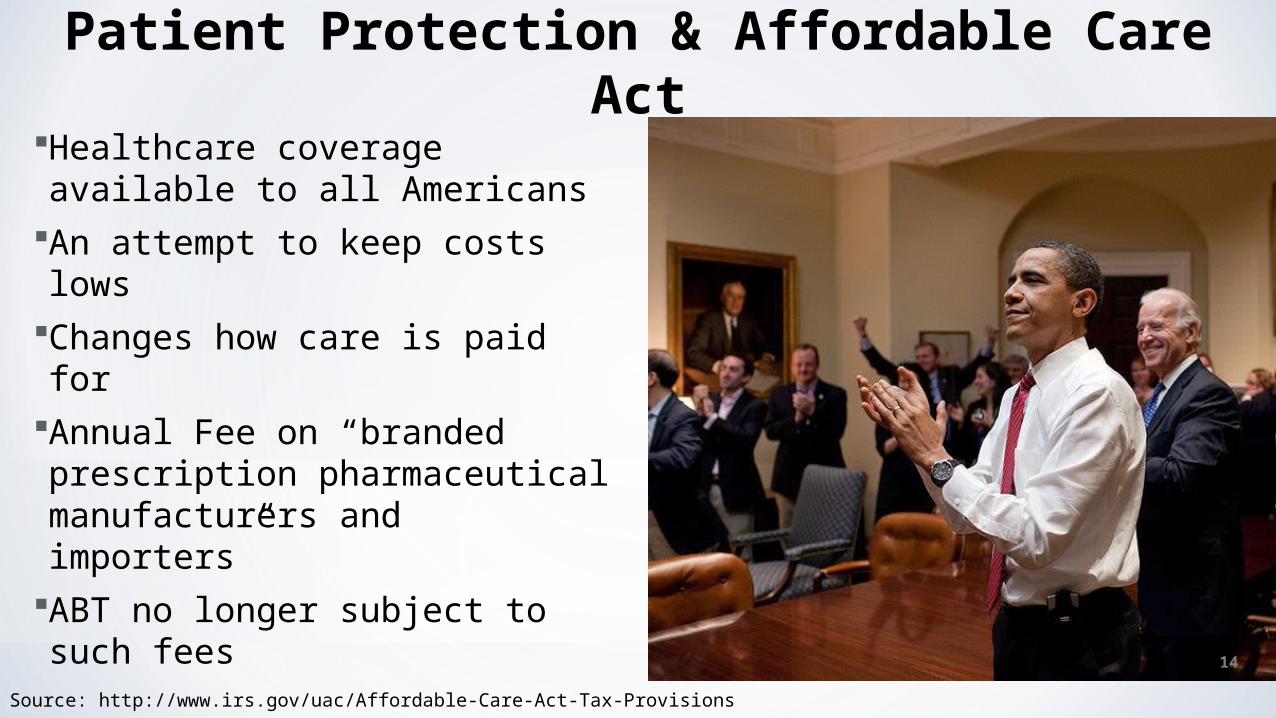
Patient Protection & Affordable Care ActHealthcare coverage available to all Americans
An attempt to keep costs lowsChanges how care is paid forAnnual Fee on “branded prescription pharmaceutical manufacturers and importers”
ABT no longer subject to such fees
14
Source: http://www.irs.gov/uac/Affordable-Care-Act-Tax-Provisions
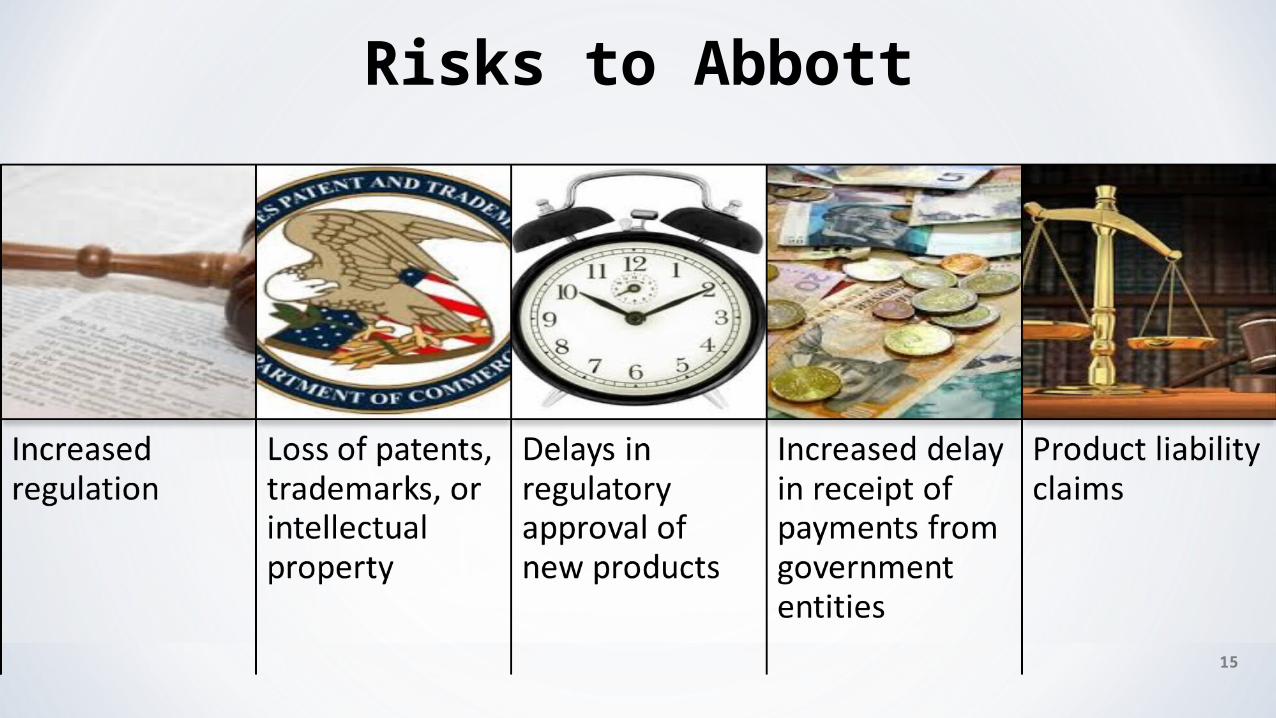
Risks to Abbott
15
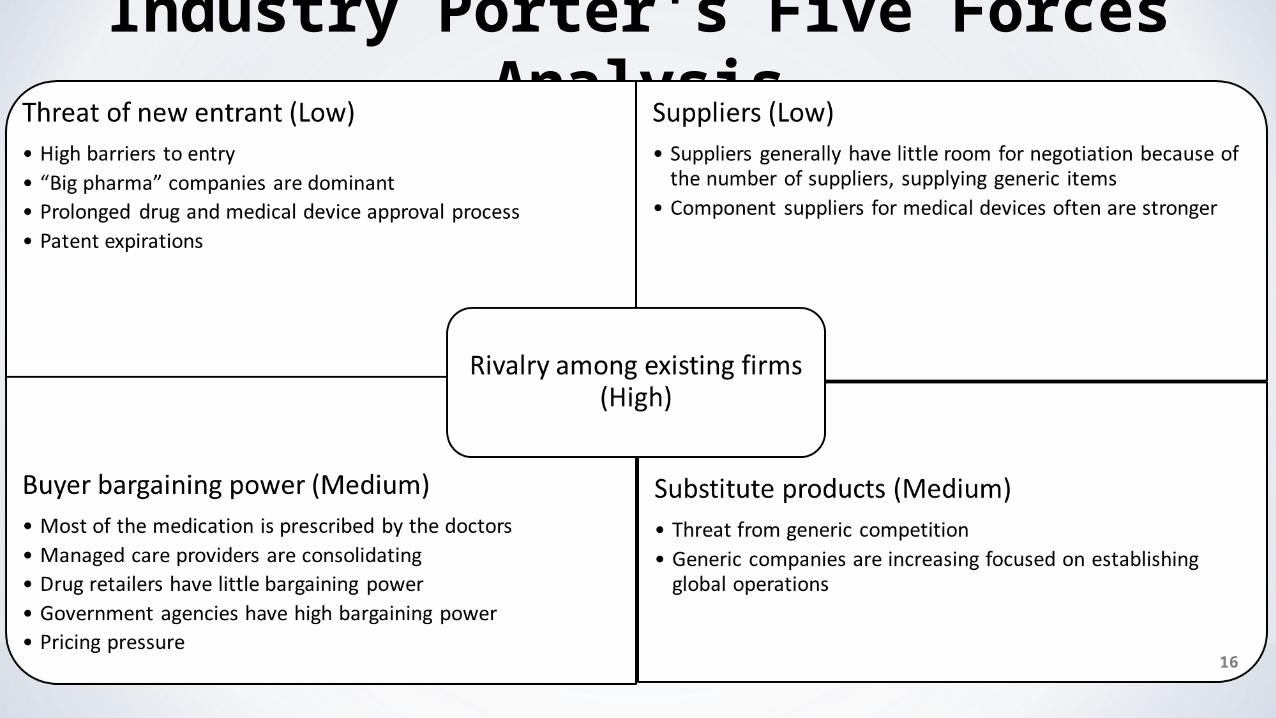
Industry Porter's Five Forces Analysis
16
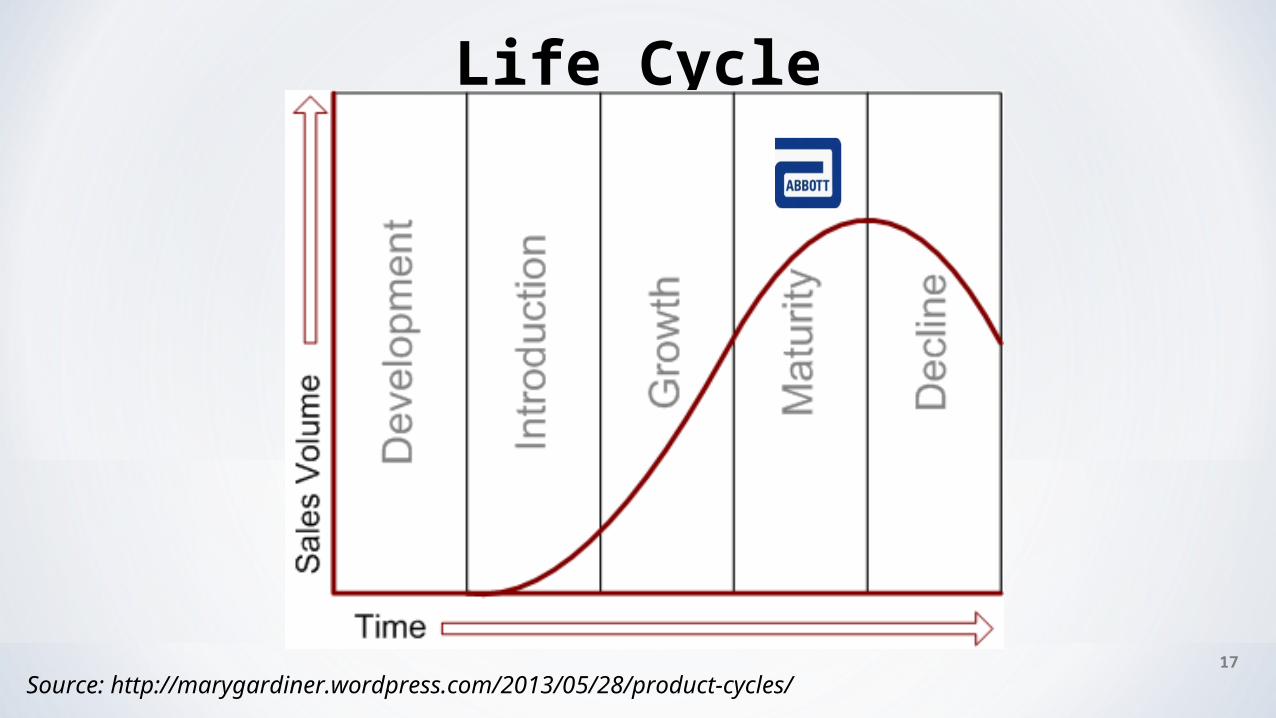
Life Cycle
17
Source: http://marygardiner.wordpress.com/2013/05/28/product-cycles/
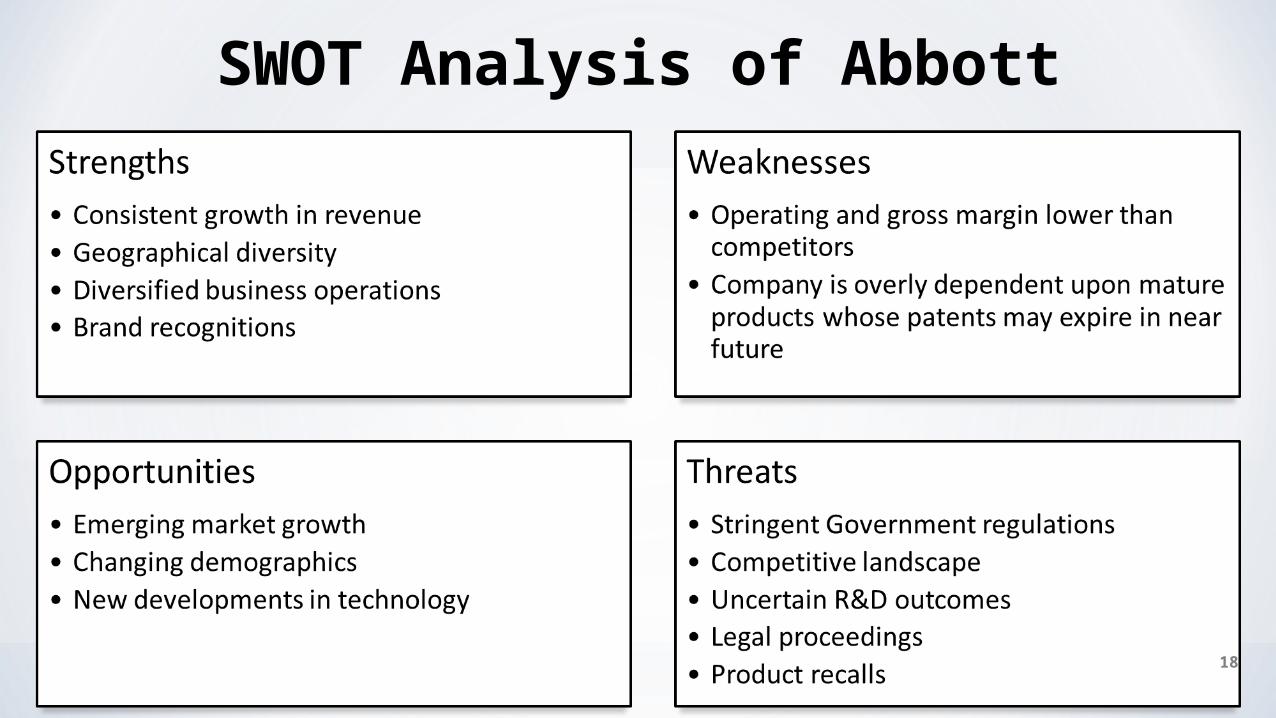
SWOT Analysis of Abbott
18
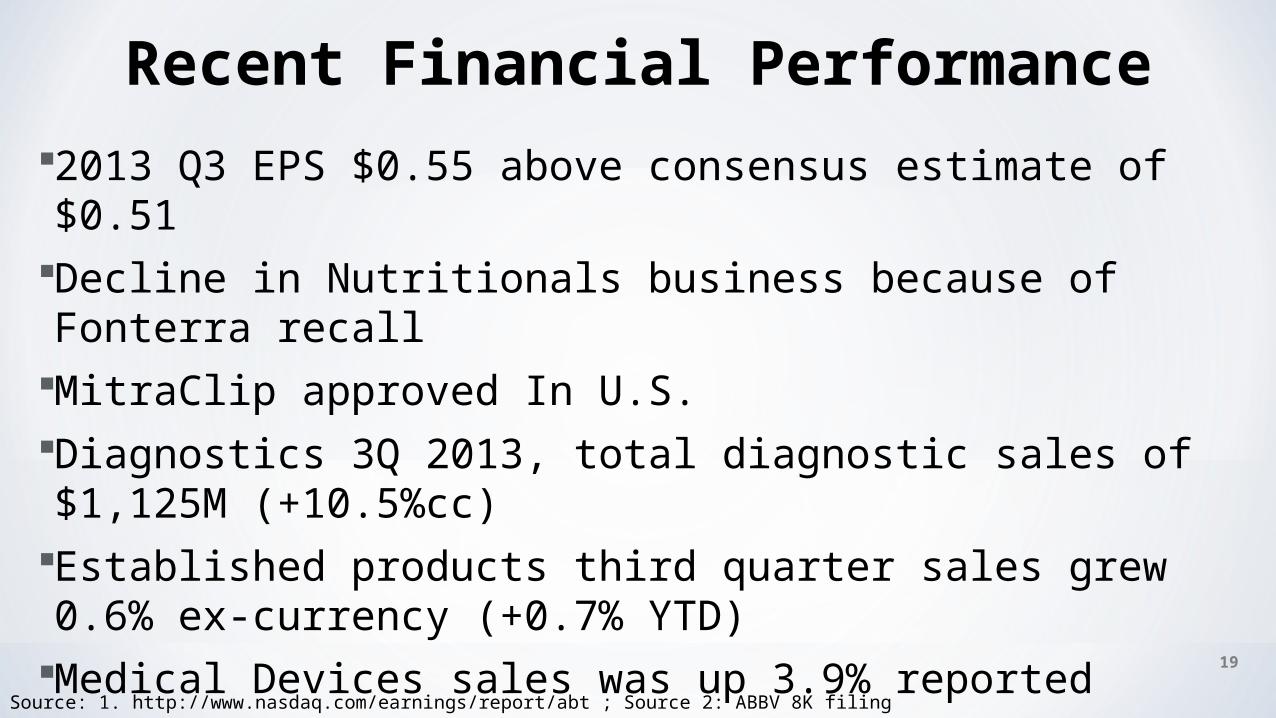
Recent Financial Performance
2013 Q3 EPS $0.55 above consensus estimate of $0.51Decline in Nutritionals business because of Fonterra recallMitraClip approved In U.S.Diagnostics 3Q 2013, total diagnostic sales of $1,125M (+10.5%cc)
Established products third quarter sales grew 0.6% ex-currency (+0.7% YTD)
Medical Devices sales was up 3.9% reported 19
Source: 1. http://www.nasdaq.com/earnings/report/abt ; Source 2: ABBV 8K filing
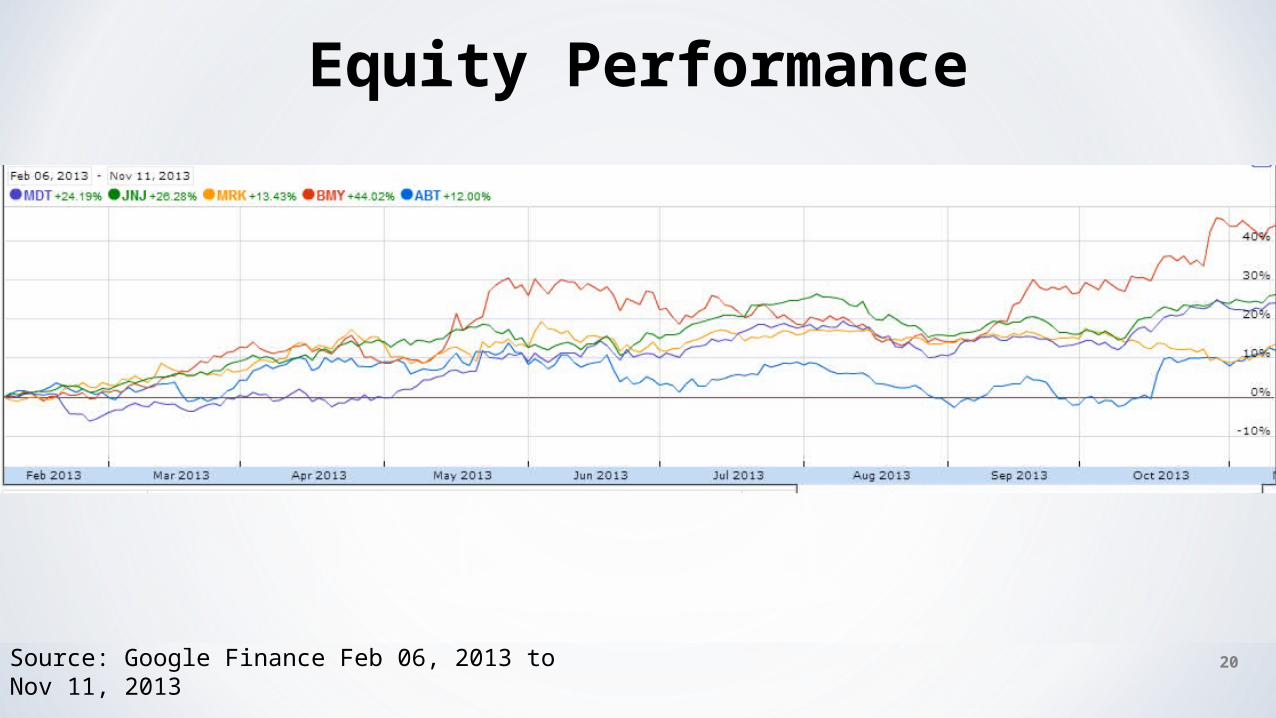
Equity Performance
20Source: Google Finance Feb 06, 2013 to Nov 11, 2013
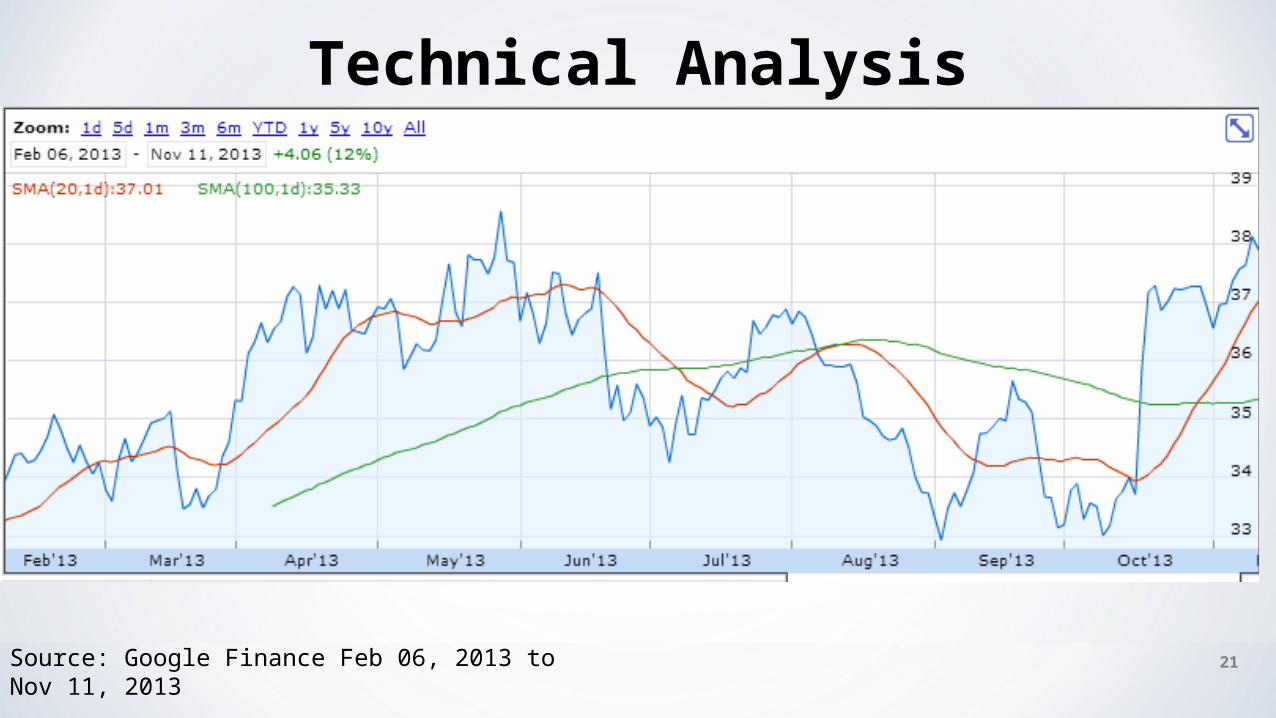
Technical Analysis
21Source: Google Finance Feb 06, 2013 to Nov 11, 2013
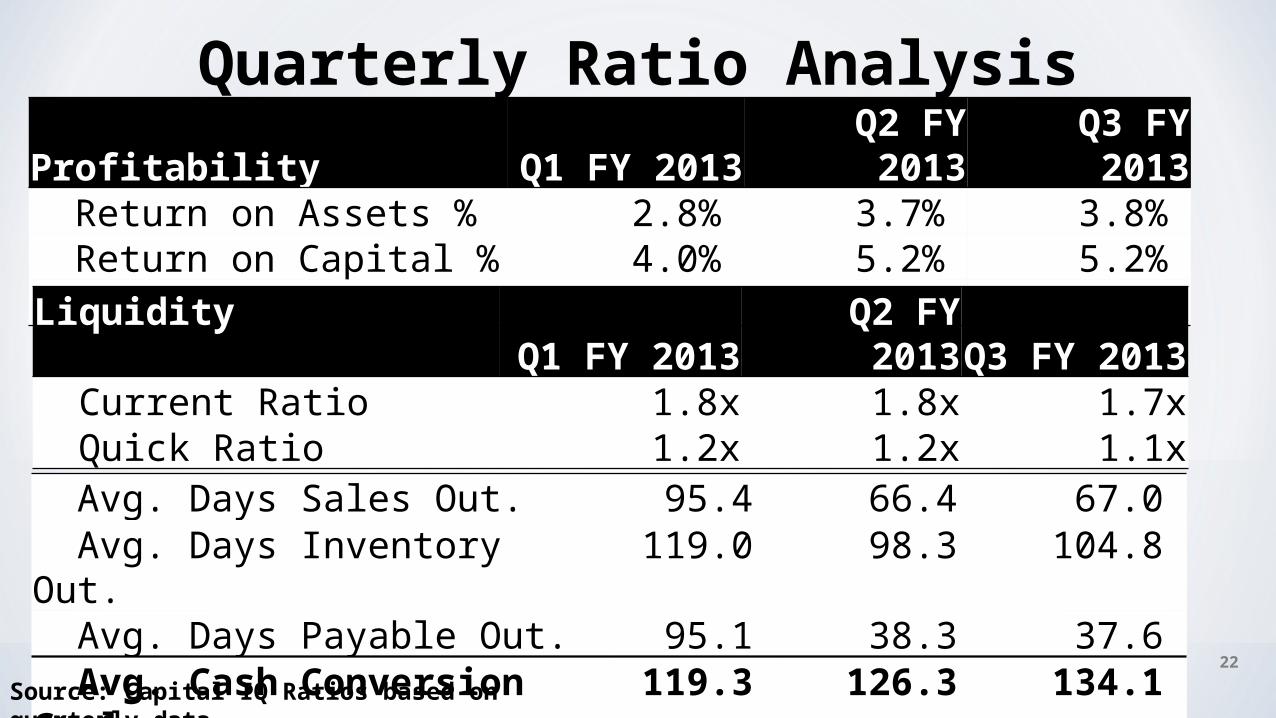
Quarterly Ratio Analysis
22
Profitability Q1 FY 2013 Q2 FY 2013 Q3 FY 2013 Return on Assets % 2.8% 3.7% 3.8% Return on Capital % 4.0% 5.2% 5.2% Return on Equity % 8.8% 8.4% 13.4% Liquidity
Q1 FY 2013 Q2 FY 2013 Q3 FY 2013 Current Ratio 1.8x 1.8x 1.7x Quick Ratio 1.2x 1.2x 1.1x
Avg. Days Sales Out. 95.4 66.4 67.0 Avg. Days Inventory Out. 119.0 98.3 104.8 Avg. Days Payable Out. 95.1 38.3 37.6 Avg. Cash Conversion Cycle 119.3 126.3 134.1
Source: Capital IQ Ratios based on quarterly data
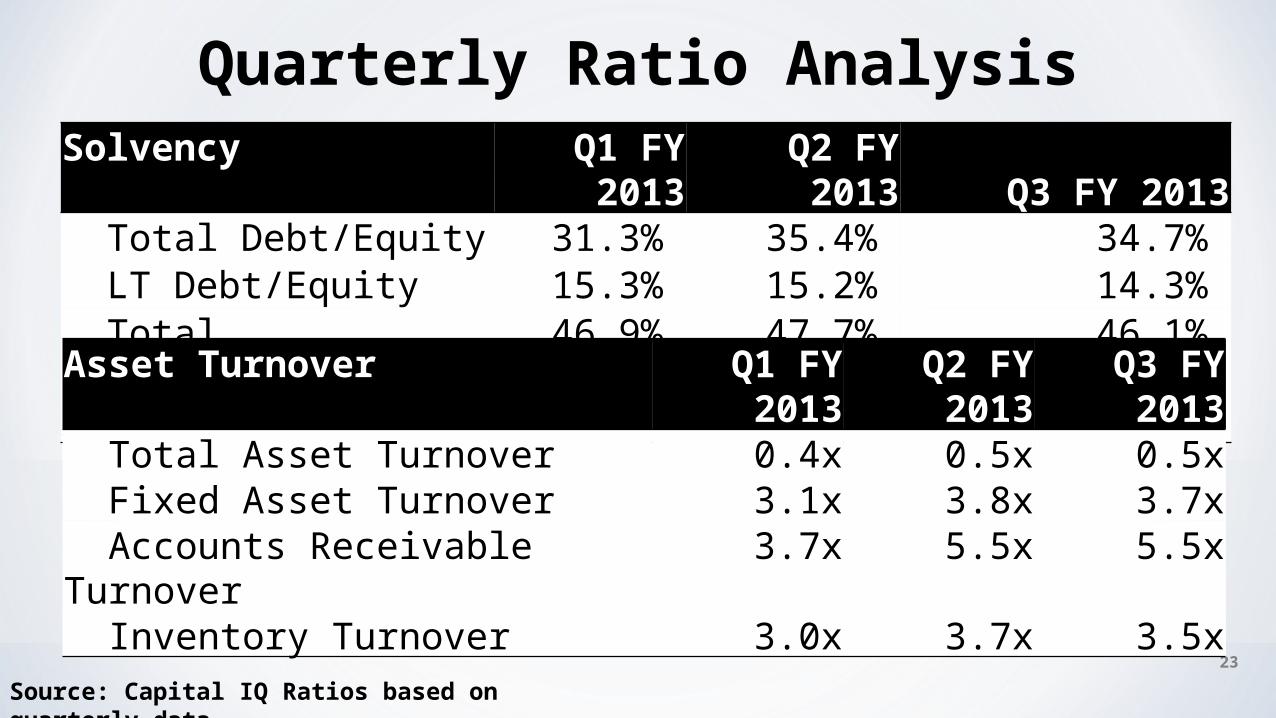
Quarterly Ratio Analysis
23
Solvency Q1 FY 2013 Q2 FY 2013 Q3 FY 2013 Total Debt/Equity 31.3% 35.4% 34.7% LT Debt/Equity 15.3% 15.2% 14.3% Total Liabilities/Total Assets
46.9% 47.7% 46.1%
Asset Turnover Q1 FY 2013 Q2 FY 2013 Q3 FY 2013 Total Asset Turnover 0.4x 0.5x 0.5x Fixed Asset Turnover 3.1x 3.8x 3.7x Accounts Receivable Turnover 3.7x 5.5x 5.5x Inventory Turnover 3.0x 3.7x 3.5x
Source: Capital IQ Ratios based on quarterly data
Valuation DCF, Comparable, Ben Graham’s formula
24
25
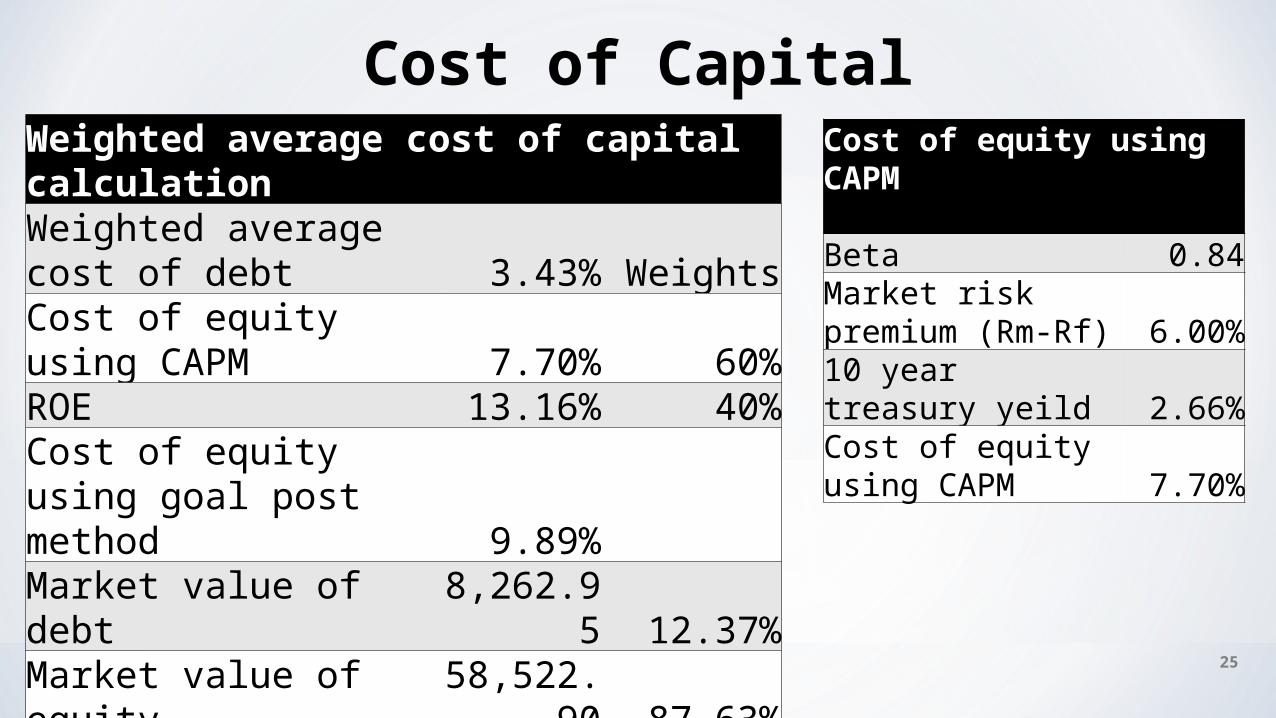
Cost of CapitalCost of equity using CAPM Beta 0.84Market risk premium (Rm-Rf) 6.00%10 year treasury yeild 2.66%Cost of equity using CAPM 7.70%
Weighted average cost of capital calculationWeighted average cost of debt 3.43% WeightsCost of equity using CAPM 7.70% 60%ROE 13.16% 40%Cost of equity using goal post method 9.89%Market value of debt 8,262.95 12.37%Market value of equity 58,522.90 87.63%Tax rate 20.00%Number of shares outstanding 1574.466WACC 9.00%
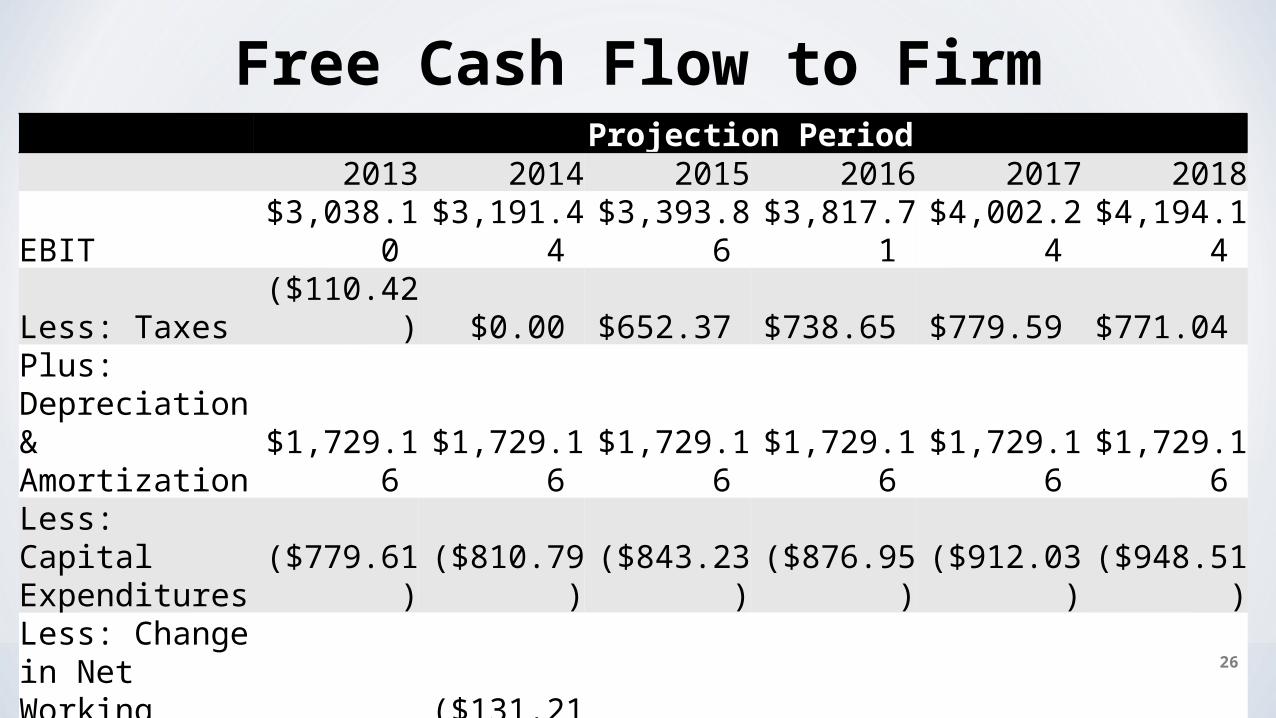
Projection Period 2013 2014 2015 2016 2017 2018EBIT $3,038.10 $3,191.44 $3,393.86 $3,817.71 $4,002.24 $4,194.14 Less: Taxes ($110.42) $0.00 $652.37 $738.65 $779.59 $771.04 Plus: Depreciation & Amortization $1,729.16 $1,729.16 $1,729.16 $1,729.16 $1,729.16 $1,729.16 Less: Capital Expenditures ($779.61) ($810.79) ($843.23) ($876.95) ($912.03) ($948.51)Less: Change in Net Working Capital $902.76 ($131.21) $205.48 $204.81 $238.28 $247.81 Free Cash Flow to Firm $3,195.30 $4,241.01 $3,421.94 $3,726.45 $3,801.49 $3,955.93
26
Free Cash Flow to Firm
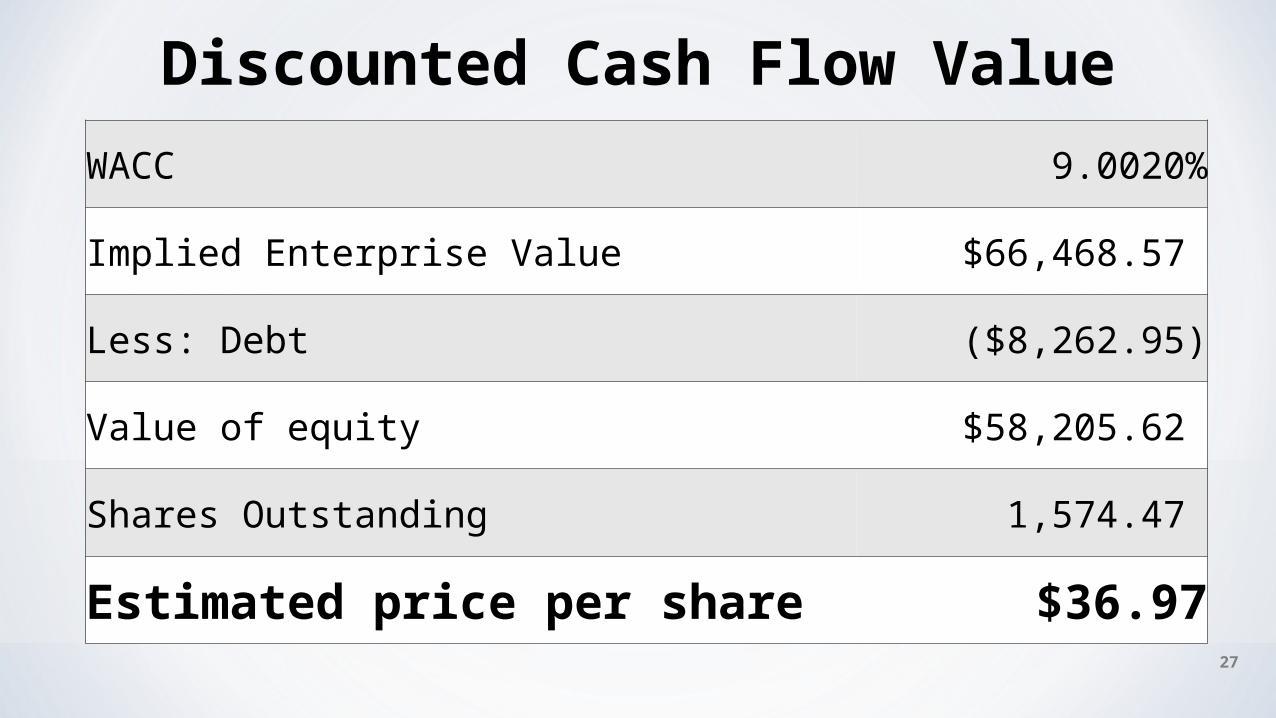
Discounted Cash Flow Value
WACC 9.0020%
Implied Enterprise Value $66,468.57
Less: Debt ($8,262.95)
Value of equity $58,205.62
Shares Outstanding 1,574.47
Estimated price per share $36.9727
28
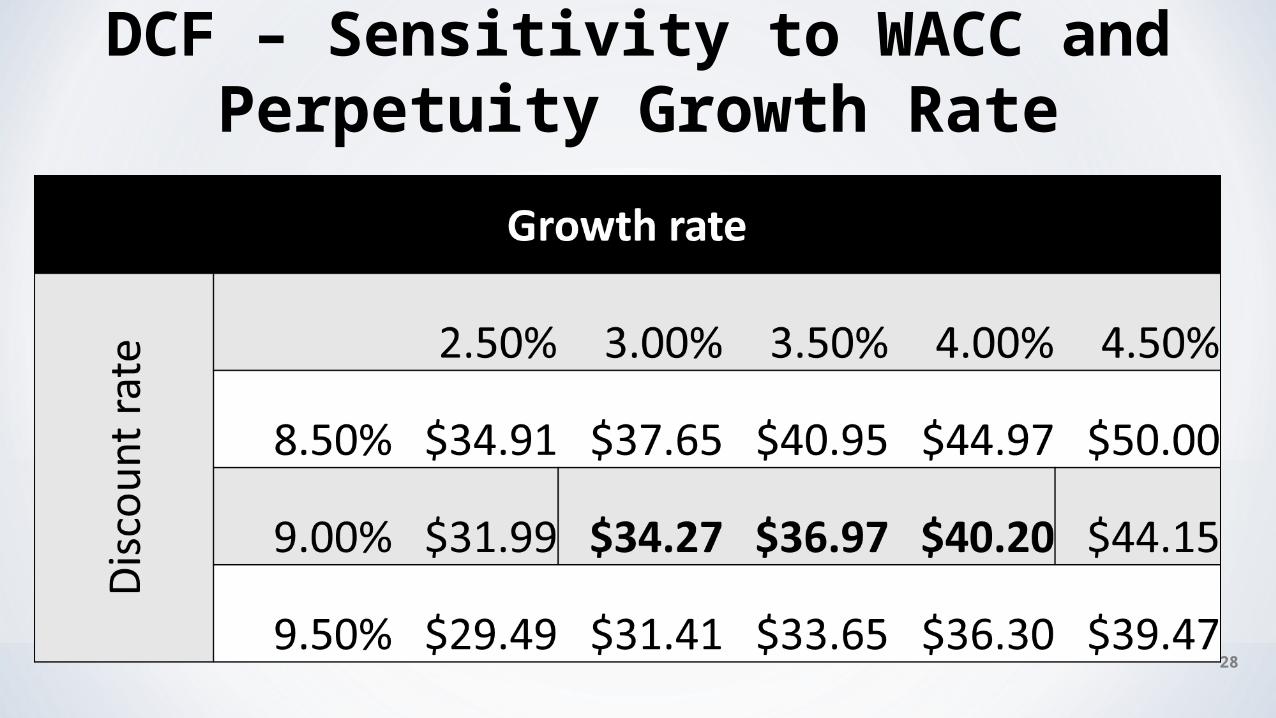
DCF – Sensitivity to WACC and Perpetuity Growth Rate
29
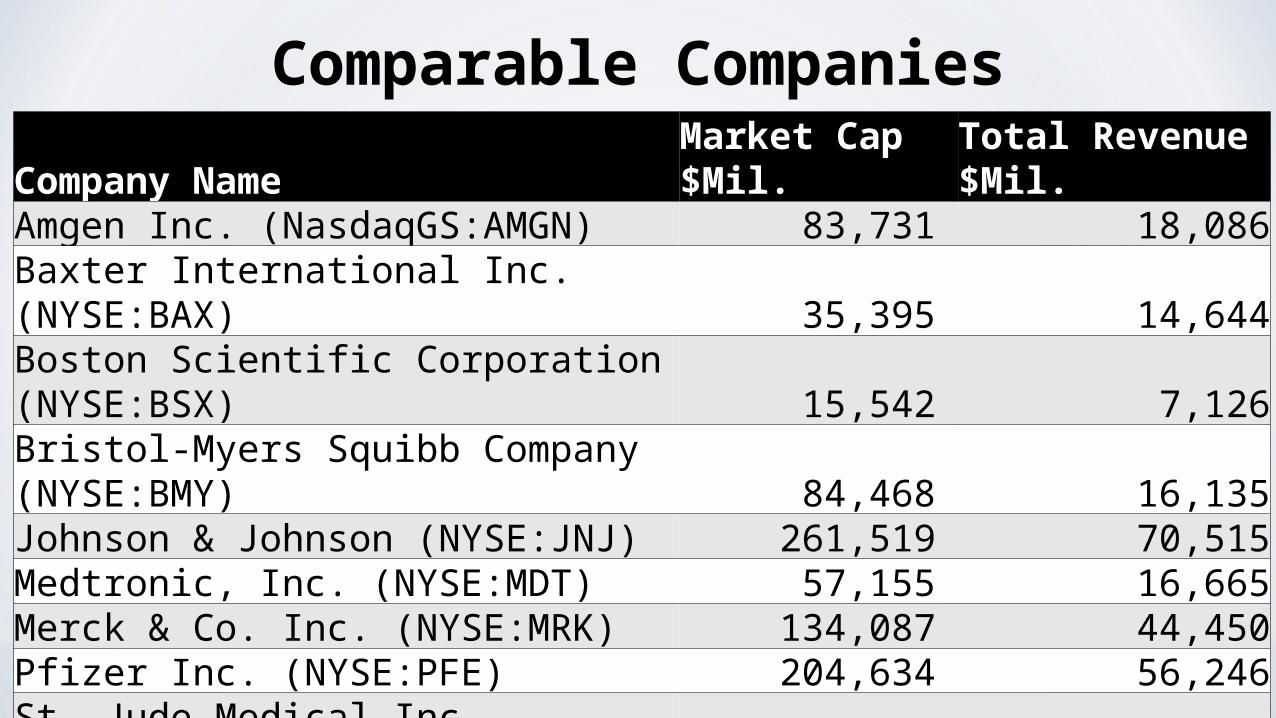
Comparable CompaniesCompany Name Market Cap $Mil. Total Revenue $Mil.Amgen Inc. (NasdaqGS:AMGN) 83,731 18,086Baxter International Inc. (NYSE:BAX) 35,395 14,644Boston Scientific Corporation (NYSE:BSX) 15,542 7,126Bristol-Myers Squibb Company (NYSE:BMY) 84,468 16,135Johnson & Johnson (NYSE:JNJ) 261,519 70,515Medtronic, Inc. (NYSE:MDT) 57,155 16,665Merck & Co. Inc. (NYSE:MRK) 134,087 44,450Pfizer Inc. (NYSE:PFE) 204,634 56,246St. Jude Medical Inc. (NYSE:STJ) 16,406 5,451Stryker Corporation (NYSE:SYK) 27,587 8,891Zimmer Holdings, Inc. (NYSE:ZMH) 14,981 4,563.2
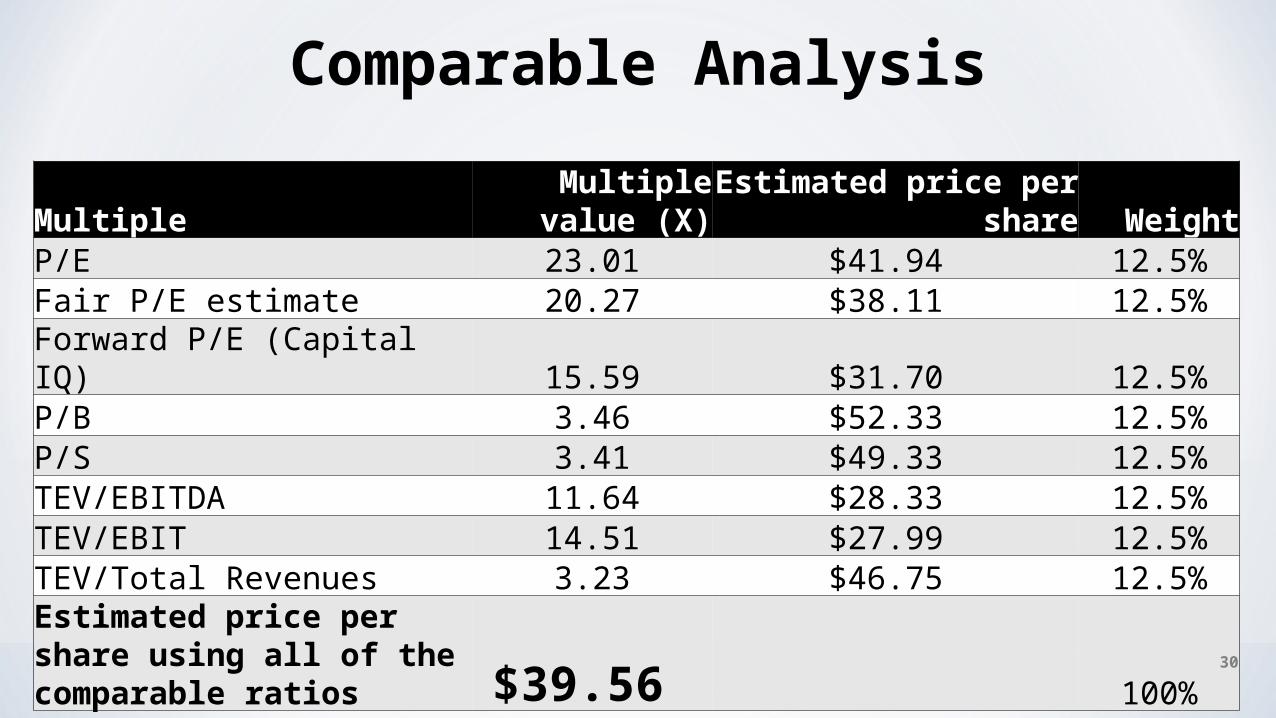
Multiple Multiple value (X) Estimated price per share WeightP/E 23.01 $41.94 12.5%Fair P/E estimate 20.27 $38.11 12.5%Forward P/E (Capital IQ) 15.59 $31.70 12.5%P/B 3.46 $52.33 12.5%P/S 3.41 $49.33 12.5%TEV/EBITDA 11.64 $28.33 12.5%TEV/EBIT 14.51 $27.99 12.5%TEV/Total Revenues 3.23 $46.75 12.5%Estimated price per share using all of the comparable ratios $39.56 100%
30
Comparable Analysis
31
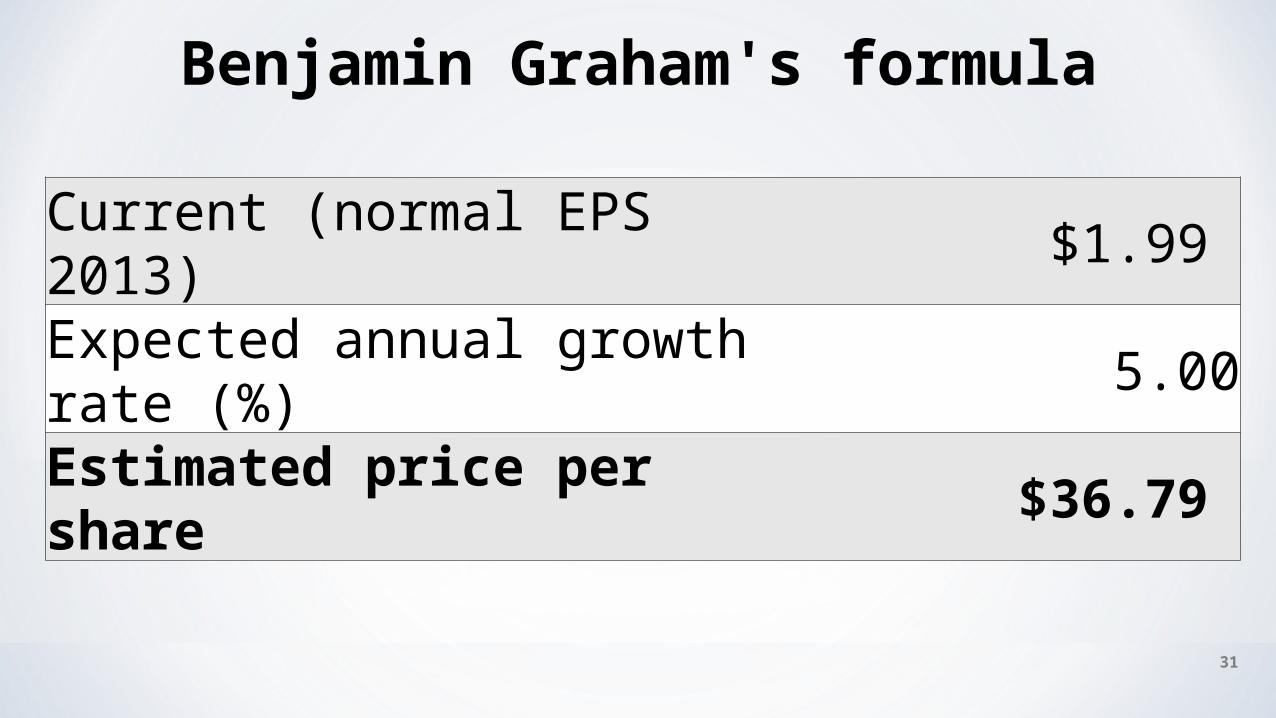
Benjamin Graham's formula
Current (normal EPS 2013) $1.99
Expected annual growth rate (%) 5.00
Estimated price per share $36.79
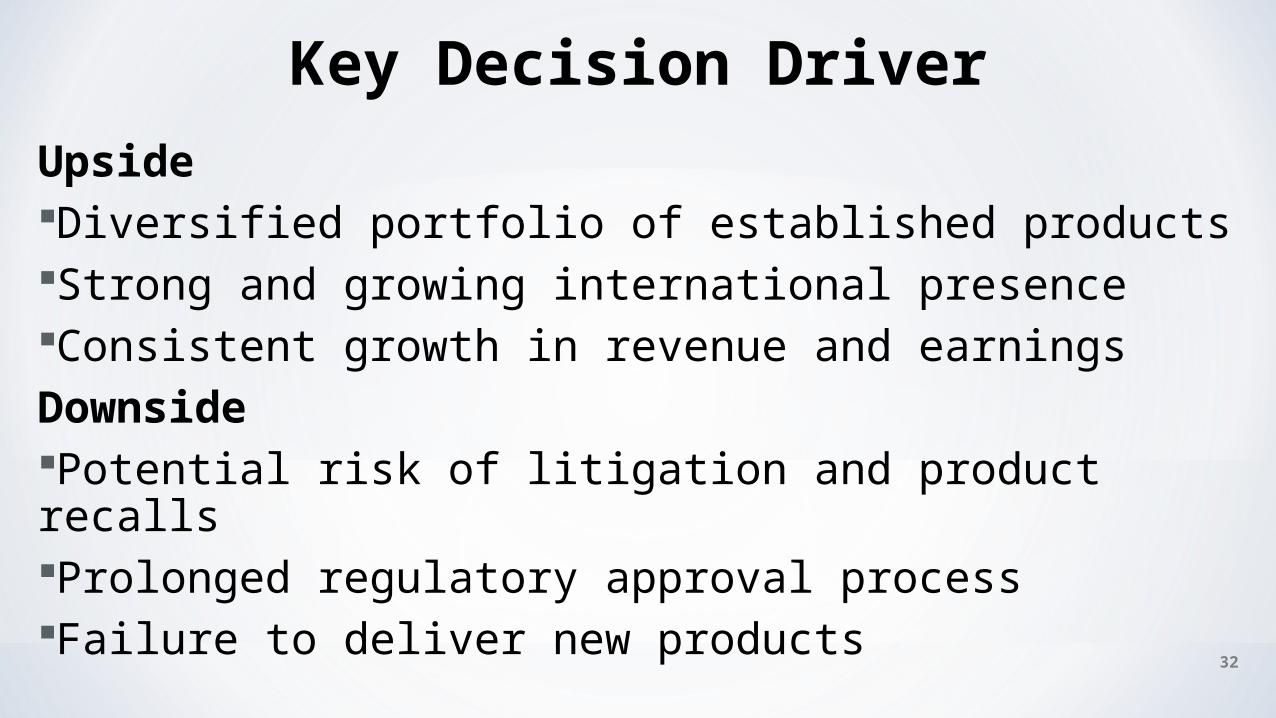
UpsideDiversified portfolio of established productsStrong and growing international presenceConsistent growth in revenue and earningsDownsidePotential risk of litigation and product recallsProlonged regulatory approval processFailure to deliver new products
32
Key Decision Driver
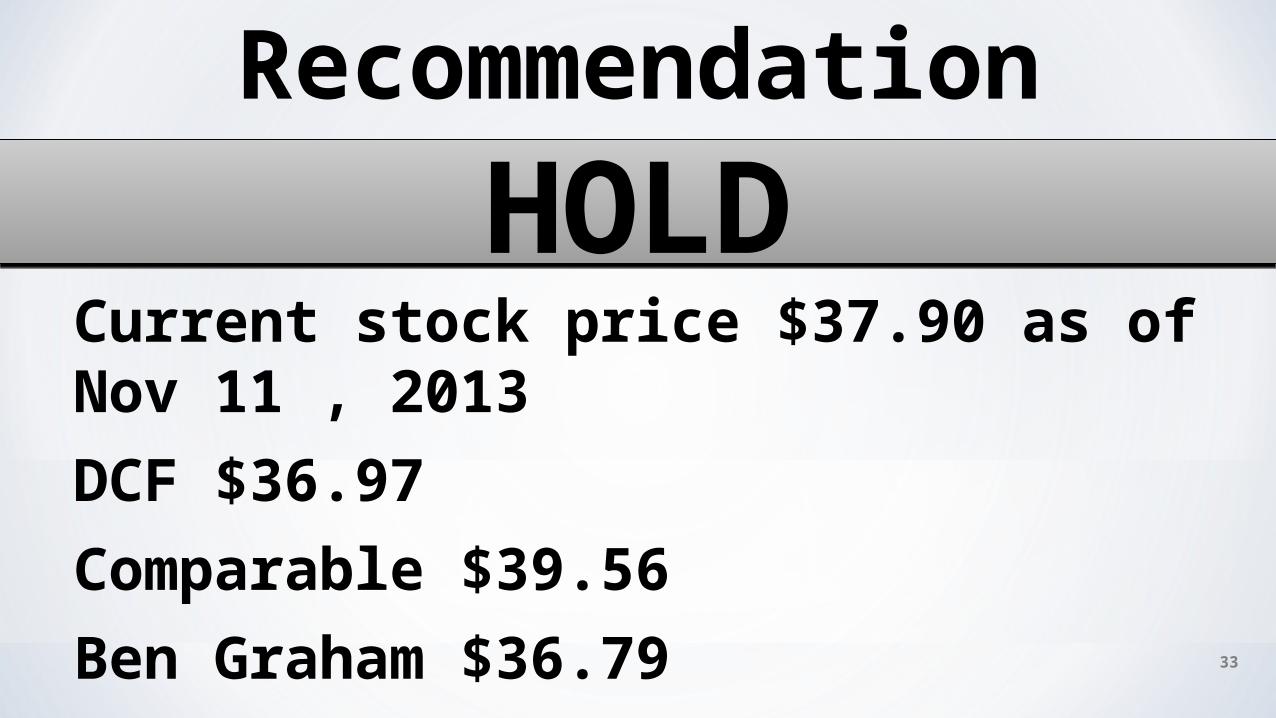
Recommendation
Current stock price $37.90 as of Nov 11 , 2013DCF $36.97Comparable $39.56 Ben Graham $36.79
33
HOLDHOLD