1-d mathematical modeling and cfd investigation on ...steam ejector is an economical device that...
TRANSCRIPT

1876-6102 © 2015 The Authors. Published by Elsevier Ltd. This is an open access article under the CC BY-NC-ND license (http://creativecommons.org/licenses/by-nc-nd/4.0/).Peer-review under responsibility of Applied Energy Innovation Institutedoi: 10.1016/j.egypro.2015.07.690
Energy Procedia 75 ( 2015 ) 3239 – 3252
ScienceDirect
The 7th International Conference on Applied Energy – ICAE2015
1-D Mathematical Modeling and CFD Investigation on Supersonic Steam Ejector in MED-TVC
A.S.Hanafia , G.M.Mostafaa , A.Waheeda* , A.Fathya aDepartment of power mechncial engineering, Cairo university, Cairo, Egypt
Abstract
Thermo Vapour Compressor TVC is the heart or prime mover of Multi-Effect Desalination MED system, it is also described as a steam ejector. Steam ejector is an economical device that utilizes high pressure steam to compress low pressure steam without any rotating parts or external power sources. The ejector performance is highly dependent on its geometry and operating conditions. The aim of the present work is to design and obtain steam ejector geometry, based on pre-specified operating conditions, and to investigate the flow behavior inside the ejector by using Computational Fluid Dynamics CFD through using “ANSYS FLUENT 14.5” software. In first section of this paper, 1-D mathematical model is carried out to predict the ejector geometry at designed operating conditions. The second part, describes the flow behavior inside the designed model of the ejector by CFD. CFD is a most reliable tool to reveal the phenomenon of the mixing process at different parts of the supersonic turbulent flow ejector and to study the effect of operating conditions on the effective ejector area. Obtaining such effects, using experimental work, is much costly and difficult. Finally, the results show the effect of the operating conditions on the entrainment ratio and the critical back pressure. © 2015 The Authors. Published by Elsevier Ltd. Selection and/or peer-review under responsibility of ICAE Keywords: Thermocompressor; ejector; performance evaluation; entrainment ratio; MED desalination; CFD.
1. Introduction Thermo Vapour Compressor TVC is simply a steam ejector which is widely used as an essential part in Multi-Effect Desalination MED system, due to its simple construction, easy installation and maintenance and low capital and operating costs. TVC is responsible for the energy recovery in the MED unit, through transferring the energy contained in the high pressure steam to lower pressure vapour, in order to produce a mixed discharge vapour at intermediate pressure. Steam ejector is also applied in MED system to maintain vacuum levels and remove non-condensable gases inside the successive effects and low pressure condenser. Accordingly, increasing TVC efficiency will result higher MED overall performance. Good understanding of flow behaviour, shock interaction and mixing process inside the ejector is necessary in designing high performance ejector. Keenan and Neumann developed a classical one-dimensional theory based on the gas dynamics rules in order to design the ejectors [1]. Then, Emas et al. [2] modified this
* Corresponding author. Tel.: +2-0100-846-2025. E-mail address: [email protected]
Available online at www.sciencedirect.com
© 2015 The Authors. Published by Elsevier Ltd. This is an open access article under the CC BY-NC-ND license (http://creativecommons.org/licenses/by-nc-nd/4.0/).Peer-review under responsibility of Applied Energy Innovation Institute
3240 A.S.Hanafi et al. / Energy Procedia 75 ( 2015 ) 3239 – 3252
theory to consider the loss coefficient at different parts of the ejector. However, this theory is used to predict performance, only when the ejector operates at its design conditions. Huang et al. [3] developed a 1-D model for analyzing ejector performance at critical mode operation, considering hypothetical throat. El-Dessouky et al. [4] developed a simple empirical model to design and evaluate the performance of steam jet ejectors, based on a large database, that have been extracted from several ejector manufacturers and a number of experimental literatures. Due to the difficulty of predicting flow behaviour inside the ejector, because of highly turbulent and supersonic speed flow, computational fluid dynamic CFD and numerical simulation became the most efficient and reliable method to obtain the flow field inside complex geometries with less time and lower cost than the experimental methods. CFD software shows very good agreement with the experimental results that has been proved by a number of researchers. Rusly et al. [5, 6] investigated the flow characteristics of the ejector in a refrigeration system by using the real gas model through the commercial code, “FLUENT”, and found a good agreement. Sriveera kul et al. [7] used CFD to analyze the flow phenomenon inside a steam ejector, according to the validation of the static pressure profile along the wall of the ejector, entrainment ratio, and critical back pressure. CFD is also applied for visualizing the change in the flow structure and the mixing process inside the steam ejector as influenced by interested parameters, ejector’s operating conditions and geometries. Pianthong et al. [8] investigated the flow phenomenon and performance of two typical ejectors used in refrigeration systems. The results are validated with experimental work and simulation in other various conditions. MyoungKuk et al. [9] used CFD technique to study the effects of compressibility and turbulence on the flow structure inside steam ejector in MED system. The study examines the effects of operating pressure and ejector geometry on the performance of the steam ejector. Ariafar, K. [10] studied the flow behaviour along the axis of a designed model ejector. The author investigated the pressure distribution profile along the axis. Then, the author analyzed the ejector performance by choosing different operating conditions at the boundaries. In the present work, operating conditions of the considered steam ejector are according to that of Abu-Qir power station, which uses MED-TVC unit to produce distilled water from sea water for the steam generator make-up. 1-D model is used to obtain ejector geometry. The flow behaviour inside the ejector is investigated, using CFD code “ANSYS FLUENT 14.5”, by showing the Mach number and pressure distributions along the axis and analyzing the performance to obtain the optimum operating points by changing boundary conditions. 2. Principal of operation
The main function of the ejector is to suck vapours or gases from low pressure places to high pressure ones, by converting the kinetic energy into pressure energy. The ejector consists of three main parts; nozzle, mixing chamber and diffuser. The present ejector as well as its nozzle has the converging diverging form. The high pressure steam that enters the nozzle is referred to as “the motive steam” or “primary fluid”. The recovered low pressure steam is known as “the entrained vapour” or “secondary fluid”, and the steam that exits the ejector from the diffuser is named as “the discharge steam”. Fig.(1) shows a schematic of the ejector with pressure-velocity profile along its axis. Motive steam enters the nozzle at point "P", with high pressure and low velocity. The motive steam velocity in the nozzle increases until reaches sonic value at the nozzle throat. Beyond the throat, the steam velocity increases to supersonic until reaches the nozzle exit at point "2", while the pressure decreases to lower than entrained vapour pressure at point "e". The mixing process begins in the suction chamber. At point "3" in the converging section of the ejector, mixing between the two streams is completed. Pressure recovery of the mixed stream begins at the later section of the converging ejector and continues until the outlet of the ejector. After the mixed stream leaves the converging part of the ejector, it reaches the constant area throat of the ejector, where sudden rise in the pressure occurs and flow becomes subsonic again due to normal shock wave that formed at point "4". As the fluid moves further down the diverging part of ejector, the velocity drops further and pressure is more recovered. Finally, the fluid reaches the design outlet pressure at the exit of the subsonic diffuser.

A.S.Hanafi et al. / Energy Procedia 75 ( 2015 ) 3239 – 3252 3241
Fig. 1. Variation in stream pressure and velocity as function of location along the ejector.
3. Mathematical model Sun and Eames [11] pointed out that there are two basic approaches for ejector analysis, based on mixing of motive steam and entrained vapour, namely constant pressure and constant area. Keenan [1] concluded that, the constant pressure ejector shows better performance than the constant area ejector. Consequently, the constant pressure model is commonly applied in the ejector mathematical modeling. Mundy and Bagster [12] developed constant pressure mixing model by assuming that the motive steam doesn’t mix with the entrained vapour after the primary nozzle exit immediately. Primary fluid creates a convergent duct for entrained vapour, subsequently the entrained vapour is accelerated until reached its sonic speed at the hypothetical throat area (effective area), as seen from Fig. (2), after which the mixing of two streams starts at uniform pressure [3]. In the present work, constant pressure model is applied, as indicated in Fig.(3), based on the following assumptions:
Steam follows ideal gas behavior with constant specific heat. Steady, 1-D conditions and adiabatic flow. Inner wall of the ejector is adiabatic. Velocities of motive steam, entrained vapour and discharge flow are negligible. Friction losses are introduced by applying isentropic efficiency to primary nozzle, diffuser and mixing chamber. Hypothetical throat occurs at constant area section of the ejector. Two streams mixing occurs at uniform pressure Ppy = Psy = Pm at section y-y, before shock wave.
3.1. Governing equations Mass balance equation :
m p sm m m (1)
Where " " is mass flow rate and subscripts m, p and s, defined mixed, primary and secondary mass flow rates, respectively. Entrainment ratio:
s
p
mm
(2)

3242 A.S.Hanafi et al. / Energy Procedia 75 ( 2015 ) 3239 – 3252
Fig. 2. Effective area occurring in the ejector throat.
Fig. 3. Schematic diagram of ejector performance.
For given primary flow pressure Pp, temperature Tp and mass flow rate p , at chocking conditions, with following gas dynamic relations, the cross section area for the primary throat nozzle Ath , is obtained as:
112
1th p
p np
A Pm
RT (3)
Where n is the nozzle isentropic efficiency. Using isentropic gas dynamic relations between Mach
number at nozzle exit 1pM and exit primary nozzle pressure
1pp and exit cross section area 1pA , it can
be found that :
1
1
1
2?1
pnp
p
PM
P
(4)
1
1
1
121
22
1 2 111 2
pp
th P
AM
A M
(5)
Applying the previous assumptions, chocking of the entrained flow occurs at section y-y and Msy=1, for a given stagnation secondary pressure Ps , as follows :
1
2 11
ss y
s y
PMP
(6)
Which results from the following assumption:
m p y syP P P (7)
Mach number Mpy for primary flow at section y-y can be obtained from the relation:

A.S.Hanafi et al. / Energy Procedia 75 ( 2015 ) 3239 – 3252 3243
1
12
1
12
11
2
11
2
pp y
P
p y
MPP
M
(8)
Using isentropic gas dynamic relations to calculate cross section area of primary flow Apy at section y-y, where coefficient p is included to consider primary flow losses from section 1-1 to y-y, as:
1
1 1
12 ?
2
1 2 ?
2
2 1/ 11 2
2 11 / 11 2
p p y p yp y
p
p p
M MAA
M M(9)
For given secondary flow pressure Ps , temperature Ts and mass flow rate s at chocking condition, and following gas dynamic relations, the cross section area for primary throat nozzle Asy , is obtained as:
11
2
1sy s
s ns
A Pm
RT (10)
The constant cross sectional area of the ejector A3 at section y-y is calculated by summing up the primary flow area Apy and secondary flow area Asy , as:
3 py syA A A (11)Appling gas dynamics relations, the Mach M and the critical Mach M* numbers at any point is related by:
2*
2
11 2
MM
M (12)
Where critical Mach number M* is the ratio between the local fluid velocity to the velocity of sound at the critical conditions. The mixing process is modelled by one dimensional continuity, momentum and energy equations. These equations are combined to define the critical Mach number of the mixture M*
m in terms of the critical Mach number for the primary and entrained fluids at section y-y, as follows:
* **
?
1 1 /
P y sy s pm
s p
M M T TM
T T
(13)
From equations (12) and (13), the Mach number of the mixing flow at section m-m can be obtained. The Mach number M3 after shock wave at section s-s, is given by:
2
32
112
1 2
m
m
MM
M
(14)
From Mach after shock wave M3 and pressure Pm and Mach Mm before shock wave, the pressure after shock wave is expressed by:
23
23
1 1
m
m
P MP M
(15)
The steam pressure at the exit of the diffuser follows isentropic gas dynamic relations according to: 1
23
3
?1
2dcP M
P (16)
Where d is the diffuser isentropic efficiency.
3244 A.S.Hanafi et al. / Energy Procedia 75 ( 2015 ) 3239 – 3252
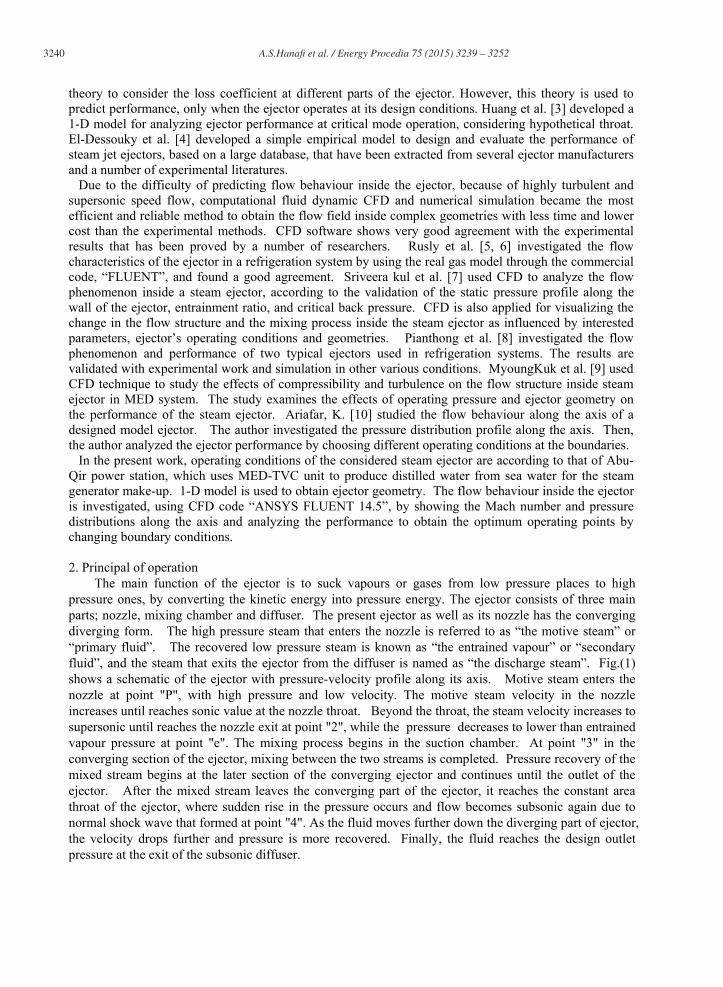
Using the above mentioned 1-D model, performance analysis can be carried out to determine the ejector cross section areas Ath , Ap1, A3 and entrainment ratio for specific boundary conditions (Pp, Tp, Ps and Ts) and desired back pressure Pc. The performance analyses procedure follows the flow chart shown in Fig.(4).
Fig. 4. Simulation flow chart in the ejector performance analysis.
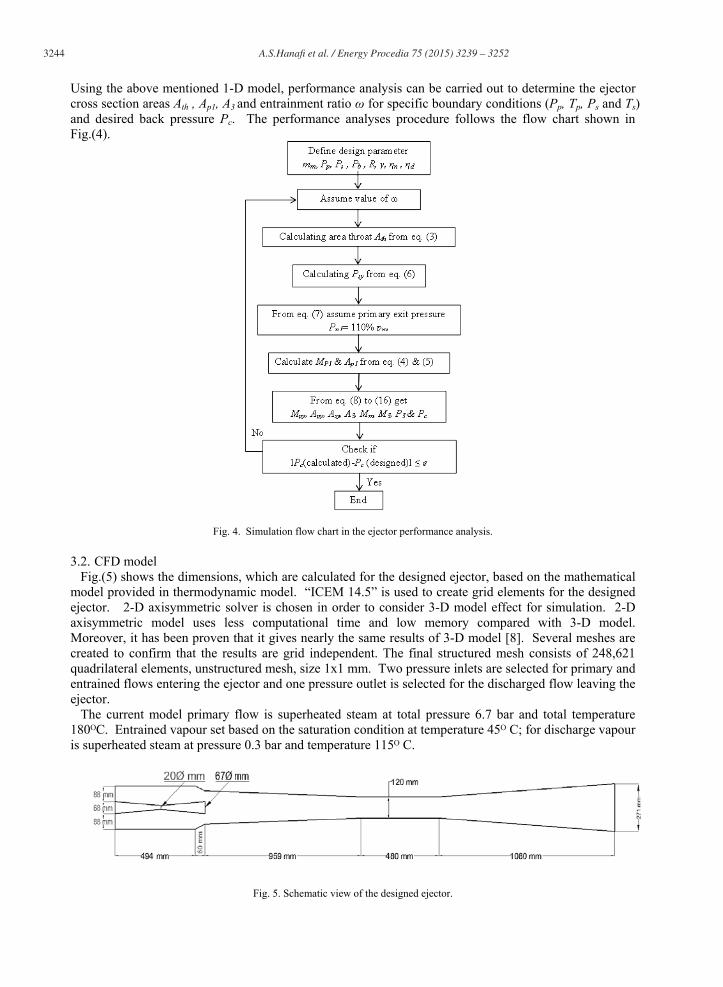
3.2. CFD model Fig.(5) shows the dimensions, which are calculated for the designed ejector, based on the mathematical model provided in thermodynamic model. “ICEM 14.5” is used to create grid elements for the designed ejector. 2-D axisymmetric solver is chosen in order to consider 3-D model effect for simulation. 2-D axisymmetric model uses less computational time and low memory compared with 3-D model. Moreover, it has been proven that it gives nearly the same results of 3-D model [8]. Several meshes are created to confirm that the results are grid independent. The final structured mesh consists of 248,621 quadrilateral elements, unstructured mesh, size 1x1 mm. Two pressure inlets are selected for primary and entrained flows entering the ejector and one pressure outlet is selected for the discharged flow leaving the ejector. The current model primary flow is superheated steam at total pressure 6.7 bar and total temperature 180 C. Entrained vapour set based on the saturation condition at temperature 45 C; for discharge vapour is superheated steam at pressure 0.3 bar and temperature 115 C.
Fig. 5. Schematic view of the designed ejector.

A.S.Hanafi et al. / Energy Procedia 75 ( 2015 ) 3239 – 3252 3245
4. Numerical Solution Procedure The governing equations are solved numerically by using the “ANSYS FLUENT 14.5” software,
which is a commercial CFD package that uses the control volume based methods to convert these equations into algebraic equations. The nonlinear governing equations are solved using the coupled implicit solver, and the standard wall function is applied on the near wall treatment. The working fluid is water vapour, which is assumed to be an ideal gas, with its properties selected in the FLUENT database. It has been proved before, by other researchers, [9, 10, 13, 14] that, using ideal gas assumption is valid at low operating pressures.
The realizable k- turbulence model is selected to express the turbulence characteristics in this simulation. This model has been used by previous investigators [8-10, 13, 14] and has proven better agreement with experimental data and more accuracy in predicating the spreading rate of both planar and round jets. The governing equations are re-written in their compact Cartesian form as:
0ii
ut x
(17)
ijl i j
j i j
Pu u ut x x x
(18)
[ )] . .i e f f j i jj i
TE u E P ut x x (19)
And 23
ji ki j e f f e f f i j
j i k
uu ux x x
(20)
The modelled transport equations for k and in the realizable k- model are: t
i k Mi j k j
kK K u G Yt x x x
(21)
2
1 2 1 3i t
bi j j
uC S C C C G
t x x x KK
(22)
Where
1 m ax 0 .43 ? ?5
C SK (23)
In these equations, C1 and C2 are constants. k and are the turbulent Prandtl numbers for k and , respectively. The model constants are C1=1.44, C2=1.9, k=1.0, =1.2, the eddy viscosity is computed from:
2
tKC (24)
5. Results and Discussion 5.1. Steady state In this section, the steady state obtained results will be discussed in more details. Fig.(6) Shows the Mach number contours and the static pressure distributions along the ejector length at steady state operating conditions. It may be observed that, the motive steam leaves the primary nozzle at supersonic velocity with pressure higher than the mixing pressure. Shock train can be observed through the fluctuation of static pressure and Mach number along centre line of the ejector before mixing. Due to the high difference in the speed between the motive steam and surrounding entrained vapour, a separation layer between them is created which increases the velocity of entrained vapour until mixing occurs. The

3246 A.S.Hanafi et al. / Energy Procedia 75 ( 2015 ) 3239 – 3252
complete mixing between the two streams is obtained at the constant throat area, where the shock train diminishes and the oblique shock wave is taken place. This may be attributed due to the significant increase in the static pressure, after which the flow velocity becomes subsonic and the pressure starts to increase across the diffuser section.
5.2. Effect of Operating Conditions 5.2.1 Effect of the back pressure The effect of changing the ejector back pressure on the entrainment ratio at constant primary and secondary pressures is shown in Fig.(7). It may be pointed out here that, the flow inside the ejector is divided, according to the back pressure, into three regions; double choking, single choking and un-choke (reversed flow). In the double choke region, the primary and secondary flows are choked simultaneously and the entrainment ratio remains constant, until the back pressure is increased and reached the critical back pressure. At the critical back pressure, a single choke region is started, where the secondary flow becomes un-choked, while the primary flow is still choked. In this region, the entrainment ratio decreases sharply until reaches zero value, at a pressure called “break down pressure”. Then any further increase in the back pressure will lead to the appearance of reversed flow at the suction inlet in the ejector.
Fig. 6. Mach and static pressure distribution inside the ejector under Pp=6.7 bar
(a) Mach number contours
(B) Static pressure distribution along ejector

A.S.Hanafi et al. / Energy Procedia 75 ( 2015 ) 3239 – 3252 3247
Fig. 7. Effect of changing back pressure on entrainment ratio at Pp=6.7 bar, Ps=0.094bar.
Fig.(8) shows the Mach number contours at different back pressures. As can be seen from this figure, any increase of back pressure causes the position of the oblique shock wave to move backward (towards the primary nozzle) until the back pressure reaches 0.3 bar (critical back pressure). Further increase in the back pressure results the oblique shock wave to disappear (single choke region). After back pressure 0.33 bar (break down pressure) reversed flow starts, as shown in Fig.(9). Once the critical back pressure is exceeded, the oblique shock wave is moved backward towards the primary nozzle, causing a decrease in the axial velocity of the mixed flow. More increase of the back pressure results the oblique shock wave to reach the primary nozzle, causing disturbance in the primary jet core until the primary flow couldn’t expand. In turn this will force the primary flow to move back to the entrance of the entrained vapour [14]. 5.2.2. Effect of the primary pressure In order to increase the ejector efficiency and decrease energy cost, minimum primary pressure and maximum entrainment ratio should be achieved. Fig.(10) shows Mach number contours at different primary pressures. It can be observed from this figure that, increasing the primary pressure shifts the oblique shock wave forward to the diffuser section and increases the shock intensity. On the other hand, as the primary pressure is decreased below the designed (optimum) point, the oblique shock wave moves backward towards the nozzle exit with lower intensity until vanishes. Further decrease in primary pressure causes a reversal flow. Fig.(11) indicates the effect of changing the primary pressure on the entrainment ratio. It may be noticed that, there is an optimum point of the primary pressure which gives maximum value of the entrainment ratio. Below this pressure, the entrainment ratio is decreased significantly until reached reversed flow. On the other hand, after the optimum point, the increase of the primary pressure has no significance effect on the entrainment ratio and the ejector will waste an extra energy gained from increasing primary steam pressure. The relation between the entrainment ratio variation with the primary pressure is attributed to the size of the jet core and effective area (hypothetical throat) [10].

3248 A.S.Hanafi et al. / Energy Procedia 75 ( 2015 ) 3239 – 3252
Fig. 9. Velocity contour showing primary flow reversed to the entrance of secondary flow.
0.24
0.28
0.29
0.30
0.31
0.32
0.33
Fig. 8. Contours of Mach number at various back pressures in bar at Pp=6.7 bar, Ps=0.094 bar.
6.00
6.20
6.50
6.70
6.90
7.10
7.30
Fig. 10. Mach number contours at different primary pressures, at Pb=0.29 bar, Ps=0.094 bar.

A.S.Hanafi et al. / Energy Procedia 75 ( 2015 ) 3239 – 3252 3249
Fig. 11. Effect of the primary pressure on entrainment ratio, at Pb=0.29 bar, Ps=0.094 bar.
According to Munday and Bagster theory [12], and as described previously, the size of jet core is directly proportional to the primary steam pressure, while the effective area is inversely proportional to the size of jet core. It is recommended to have a bigger effective area which will allow a higher entrained secondary flow. Consequently, increasing the primary pressure (above the optimum point) gives bigger jet core, and smaller effective area that leads to lower entrainment ratio. Below the optimum point at low primary pressure, the created effective area is bigger than the critical area A*, needed for choking the secondary flow, hence the increase of the primary pressure leads to decrease in the effective area until it reached the critical area A* at the optimum primary pressure which results increasing the entrainment ratio.
5.2.3. Effect of the primary steam temperature The effect of increasing the degree of superheating for the primary steam flow is indicated in this section. It is evident that, raising the primary flow temperature at a constant pressure will increase the energy content of the flow, which in turn will decrease the primary mass flow rate required for the same output pressure. Hence, the entrainment ratio and the performance of the ejector are increased as shown in Fig.(12). Moreover, the discharged flow temperature, at the diffuser exit is increased with increasing the primary flow temperature, as illustrated in Fig.(13).
Fig. 12. Effect of changing primary flow temperature on entrainment ratio, at Pp=6.7 bar.
Optimum primary pressure

3250 A.S.Hanafi et al. / Energy Procedia 75 ( 2015 ) 3239 – 3252
Fig. 13. Effect of changing primary flow temperature on exit flow temperature, at Pp=6.7 bar.
6. Mathematical model validation The present 1-D mathematical model is validated, by comparing its constant area results with those of current TVC unit operated in MED-TVC of Abu-Qir power station at the same operating conditions. The results show good agreement with dimensions of Abu-Qir MED-TVC, as listed in Table (1).
Table 1.Comparison between 1-D model results and Abu-Qir ejector geometry. Ejector Abu-Qir 1-D model Error %
Dth 92.88x10⁻³ 91.83x10⁻³ - 1.13% Dp1 331.5x10⁻³ 294.70x10⁻³ - 11.1% D3 547.60x10⁻³ 645.60x10⁻³ + 17.8%
7. Conclusions
The present work presents a 1-D analysis for predicting the ejector geometry at desired operating conditions and specified entrainment ratio. Constant pressure mixing is assumed to occur inside the constant area section of the ejector and the entrained flow choking condition is analysed. Flow behaviour within a designed model of an ejector in MED-TVC desalination unit has been investigated by using a CFD method. The effect of changing operating conditions on the ejector performance was evaluated. It has been verified that the CFD is an efficient tool to estimate the entrainment ratio and critical back pressure of the ejector for different operating conditions. The maximum back pressure, the ejector can withstand without decreasing the entrainment ratio was determined. Moreover, it is obtained that, there was an optimum value of the primary steam pressure, which gives maximum entrainment ratio and any further increase in the primary steam pressure will be considered as waste in energy. It is concluded that, increasing the degree of superheat for the primary steam temperature will increase the entrainment ratio, taking into consideration that, the dis-charge steam temperature will also increase which will affect, in return, the temperature of the first effect in the MED-TVC unit. CFD also helps to reveal the phenomena inside the ejector in details. Acknowledgment
The authors acknowledge the support provided by Amr Fathy who has a many contributions in this work. Nomenclature
Symbol A area, m2
entrainment ratio A sonic velocity, m/s

A.S.Hanafi et al. / Energy Procedia 75 ( 2015 ) 3239 – 3252 3251
Cp specific heat of gas at constant pressure, kJ/kg.K Cv specific heat of gas at constant volume, kJ/kg.K g acceleration of gravity vector h enthalpy, kJ/kg
mass flow rate, kg/s M Mach number P Pressure bar. T temperature K x-x nozzle position, m y-y position of the hypothetical throat
Cp/CV R gas constant, kJ/kg.K K thermal conductivity, turbulent kinetic energy S modulus of the mean rate-of-strain tensor T Time U mean velocity U fluctuating velocity V velocity tensor
turbulent kinetic energy dissipation rate dynamic viscosity
fluid density ij shear stress tensor kinematic viscosity
t turbulent viscosity k turbulent Prandtl numbers for k turbulent Prandtl numbers for
Subscripts P primary flow S secondary flow, entrained flow B back flow, discharged flow M mixed flow Th nozzle throat p1 nozzle exit Py primary flow at the location of choking for the
entrained flow Sy entrained flow at the location of choking for the
entrained flow 1 nozzle exit 2 entrance of the constant-area section 3 exit of the constant-area section
References
1. Keenan, J. and E. Neumann, A simple air ejector. ASME Journal of Applied Mechanics, 1942. 64: p. 75-82.
2. Eames, I., S. Aphornratana, and H. Haider, A theoretical and experimental study of a small-scale steam jet refrigerator. International Journal of Refrigeration, 1995. 18(6): p. 378-386.

3252 A.S.Hanafi et al. / Energy Procedia 75 ( 2015 ) 3239 – 3252
3. Huang, B.J., et al., A 1-D analysis of ejector performance. International Journal of Refrigeration, 1999. 22(5): p. 354-364.
4. El-Dessouky, H., et al., Evaluation of steam jet ejectors. Chemical Engineering and Processing: Process Intensification, 2002. 41(6): p. 551-561.
5. Rusly, E., et al. Ejector CFD modeling with real gas model. in Mechanical engineering network of Thailand the 16th conference. 2002.
6. Rusly, E., et al., CFD analysis of ejector in a combined ejector cooling system. International Journal of Refrigeration, 2005. 28(7): p. 1092-1101.
7. Sriveerakul, T., S. Aphornratana, and K. Chunnanond, Performance prediction of steam ejector using computational fluid dynamics: Part 2. Flow structure of a steam ejector influenced by operating pressures and geometries. International Journal of Thermal Sciences, 2007. 46(8): p. 823-833.
8. Pianthong, K., et al., Investigation and improvement of ejector refrigeration system using computational fluid dynamics technique. Energy Conversion and Management, 2007. 48(9): p. 2556-2564.
9. Ji, M., et al., CFD investigation on the flow structure inside thermo vapor compressor. Energy, 2010. 35(6): p. 2694-2702.
10. Ariafar, K., Performance evaluation of a model thermocompressor using computational fluid dynamics. International Journal of Mechanics, (1): p. 35-42.
11. Sun, D.-W. and I.W. Eames, Recent developments in the design theories and application of ejectors: a review. Journal of the Institute of Energy, 1995. 68(475): p. 65-79.
12. Munday, J.T. and D.F. Bagster, A New Ejector Theory Applied to Steam Jet Refrigeration. Industrial & Engineering Chemistry Process Design and Development, 1977. 16(4): p. 442-449.
13. Cai, L. and M. He, A Numerical Study on the Supersonic Steam Ejector Use in Steam Turbine System. Mathematical Problems in Engineering, 2013. 2013: p. 1-9.
14. Ruangtrakoon, N., et al., CFD simulation on the effect of primary nozzle geometries for a steam ejector in refrigeration cycle. International Journal of Thermal Sciences, 2013. 63: p. 133-145.
Biography
Ahmed Waheed is a current research assistant in Cairo University. He works on two research topics; the first involves one dimensional mathematical modeling and CFD investigation for steam jet ejectors and the second involves a Thermo-economic analysis of combined cycle MED-TVC desalination system. Waheed has been graduated from Mechanical power engineering department, Cairo University in 2009 and finished his master courses of Fluid Mechanics in 2011 of GPA 3.3. He currently works for Shotec Company as a senior technical sales engineer. He has received many trainings in the engineering field such as PLC S7 basic and S7SYS1 “Siemens”, Training for Bornemann Multiphase Pumps , Training for NETZSCH pumps in oilfield industry¬, NETZSCH Tornado rotary lobe pumps Familiarization Training, OSHA Occupational Safety & Health Administrator, Design And maintenance of Air Conditioning and ventilation, and Design of Automatic Firefighting system.