1 concatenated trial based hilbert-huang transformation on mismatch negativity fengyu cong 1, tuomo...
Post on 21-Dec-2015
224 views
TRANSCRIPT

1
Concatenated Trial Based Hilbert-Huang
Transformation on Mismatch Negativity
Fengyu Cong1, Tuomo Sipola1, Xiaonan Xu2, Tiina Huttunen-Scott3,
Tapani Ristaniemi 1 and Heikki Lyytinen3
1 Department of Mathematical Information Technology, University of Jyväskylä,
2 Hangzhou Applied Acoustic Institute, Hangzhou, China
3 Department of Psychology, University of Jyväskylä
24-11-2008

2
Goal of this presentation
After my speech, I hope every audience may know three words---Hilbert-Huang TransformationHilbert-Huang Transformation is a method of
time-frequency representationHow to judge the data complication with
Hilbert-Huang Transformation

3
Abstract
1.Introduction to Mismatch Negativity Definition Paradigm to generate MMN Example
2.Introduction to Hilbert-Huang Transformation Definition Steps Application
3.Results under statistical analysis and Conclusion Support to absence ratio Dimension of MMN under HHT Diffusion distance of HHT among channels

4
1.Introduction to Mismatch Negativity

5
What is mismatch negativity (MMN) ?
Mismatch negativity (MMN) is a negative event-related potential (ERP). MMN could reflect the ability of the brain to detect changes in stimuli, and has been extensively studied in the context of language development.
MMN peaks about 150-200 ms after deviation onset with amplitude of peaks around -3μV.
Since MMN peak is small compared to the noisy EEG, it is important to extract a clean MMN component.

6
How to generate MMN?
MMN is automatically elicited in an oddball paradigm, in which physically deviant stimuli occur among repeated, homogeneous stimuli.

7
EEG Recordings
The children were instructed not to attend to the sounds, and sit quietly and still watching a silent movie for 15 minutes. There were 350 trials of each type of deviation, and each trial last 650ms
66 control children, 16 reading disable (RD) children, 16 attention deficit hyperactivity disorders (ADHD) children
Target:
Find difference among three groups from the EEG recorddings

8
Raw Data

9
An example of MMN-averaged Trace
MMN is obtained through averaging over trials for each subject at each channel.

10
2.Introduction to Hilbert-Huang Transformation

11
Data Model

12
Signal processing for MMN
Time domainDigital Filtering, Independent Component
Analysis
Frequency domainSpectral analysis
Time-frequency joint domainTime-frequency representationNon-negative Matrix/Tensor Analysis

13
Time-Frequency Representation
Advantage: Time-frequency domain can describe the evolution of a signal in
the time and frequency domain. Method:
Linear Short Time Fourier Transform is too coarse. Wigner-Ville distribution is a popular tool in time frequency analysis.
However, it introduces the negative energy, so it would not be used in the latter separation in our designed procedure.
Wavelet is a good tool in time-frequency analysis, and the key is to find an appropriate wavelet to describe the MMN trace. This method is not adaptive. This is the shortcoming.
Nonlinear Hilbert-Huang transformations (HHT) is adaptive to the data.
14
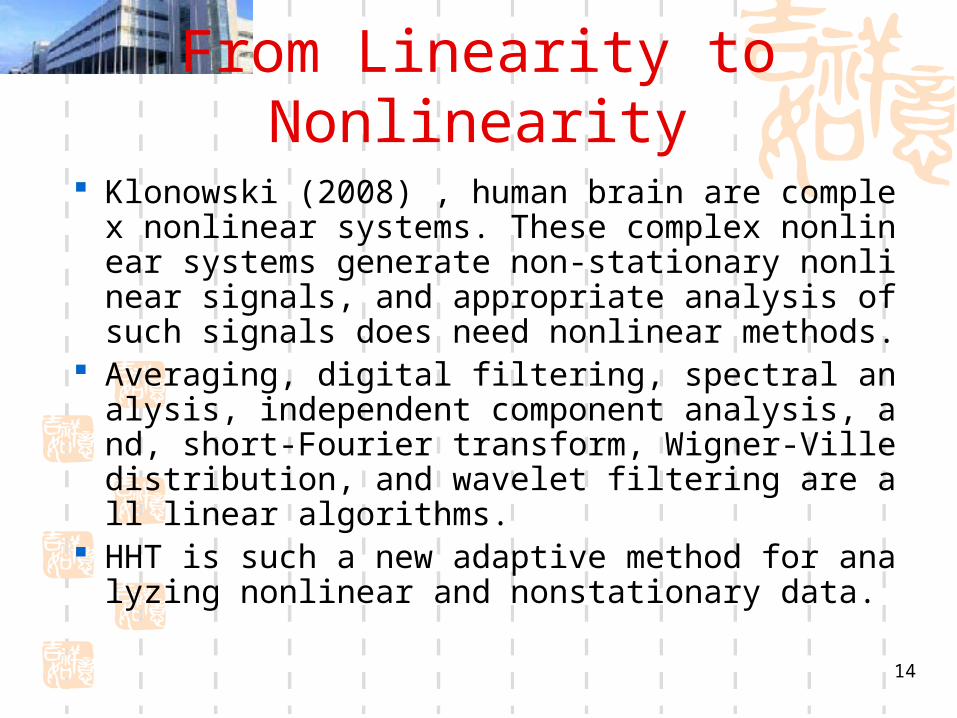
From Linearity to Nonlinearity
Klonowski (2008) , human brain are complex nonlinear systems. These complex nonlinear systems generate non-stationary nonlinear signals, and appropriate analysis of such signals does need nonlinear methods.
Averaging, digital filtering, spectral analysis, independent component analysis, and, short-Fourier transform, Wigner-Ville distribution, and wavelet filtering are all linear algorithms.
HHT is such a new adaptive method for analyzing nonlinear and nonstationary data.

15
Application of HHT
HHT was first defined by Huang and his colleges in 1998. After invented, HHT has been applied in many disciplines, such as analyzing and correcting satellite data, fusing data from multi-sensors, speech analysis and speaker identification, machine
health monitoring; analyzing biological, and physiological signals …….

16
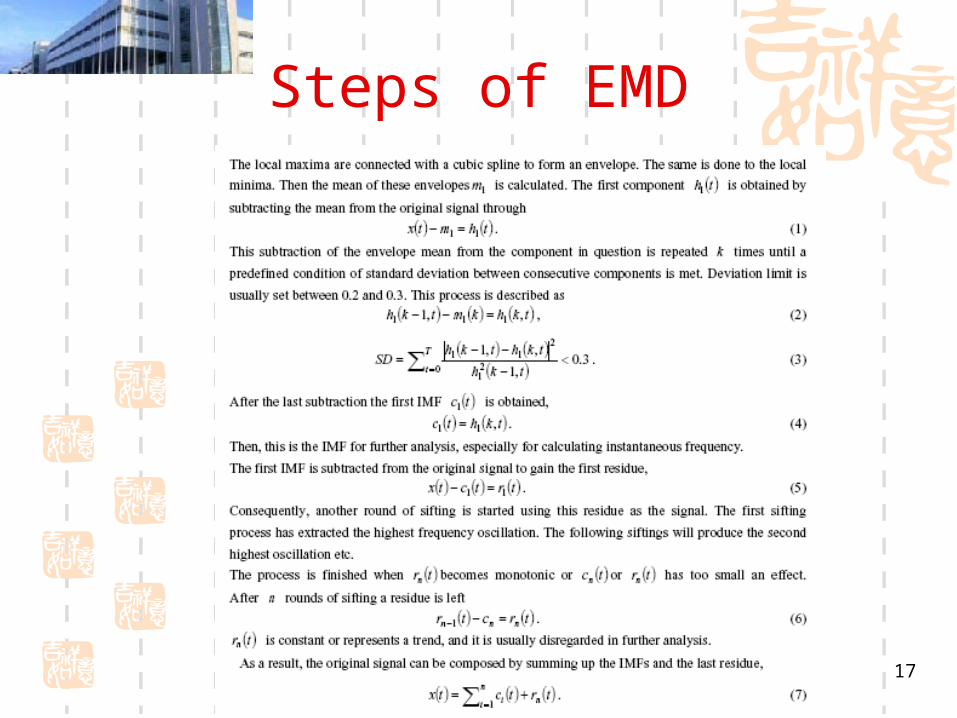
Steps of HHT
HHT consists of two parts: empirical mode decomposition (EMD), Hilbert spectral analysis.
EMD: From rigid mathematical model to adaptive procedure EMD is adaptive, and, therefore, highly efficient. Since the
decomposition is based on the local characteristic time scale of the data, it is applicable to non-linear and non-stationary processes. With EMD, any complicated data set can be decomposed into a finite and often small number of intrinsic mode functions (IMF).
An IMF needs to satisfy two criteria Firstly, the number of local maxima and minima must differ at most by o
ne. Secondly, the mean of the upper and the lower envelopes must equal t
o zero.
17
Steps of EMD

18
IMFs and original trace
a
b

19
From convolution to differentiation
In HHT, the frequency is defined as a function of time by differentiation rather than convolution analysis as “Fourier-type” methods.
dt
tdt i
i tf ii
2
1 tatfF ii ,
tjiiii
ietatcHjtctz
N nk
nk
N
n
nsjnsn
kN
njnsnkS
1n
1
sincos
2exp
“Fourier-type” methods:
Hilbert Transform:
duut
uctcH i
i
1
P

20
Concatenated Trial based HHT on MMN
1. Remove bad trials -- 5% is removed 2. Concatenate trials together 3. EMD on concatenated trace to obtain the IMF
s 4. disconnect each IMF into IMF based trials 5. Average over IMF based trials 6. Hilbert transformation on each averaged IMF
trace 7. Time-frequency representation on MMN

21
IMFs

22
Time-frequency representation of MMN by HH
T and Morlet Wavelet-results
c
d

23
3.Results under statistical analysis and Conclusion

24
SAR
25
Results –SAR—deviations* channels
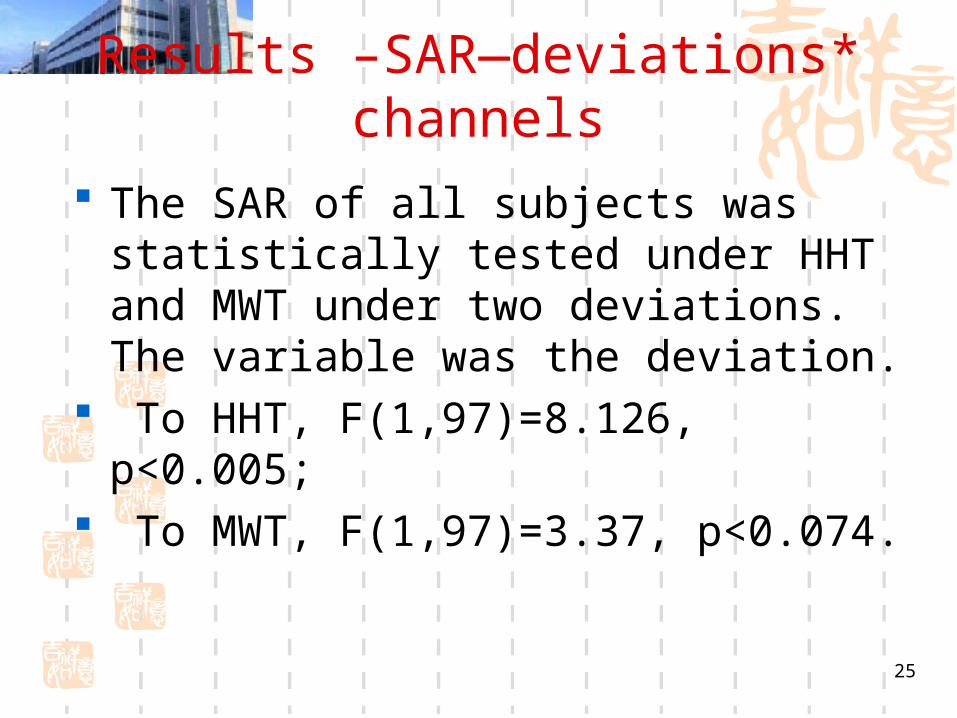
The SAR of all subjects was statistically tested under HHT and MWT under two deviations. The variable was the deviation.
To HHT, F(1,97)=8.126, p<0.005; To MWT, F(1,97)=3.37, p<0.074.

26
Conclusion
The statistical results of all subjects imply the larger duration deviation elicits larger SAR by HHT. This does really meet the theoretical expectation of MMN that larger deviation elicits MMN with bigger MMN peak amplitude and shorter MMN peak latency .
However, MWT does not reflect such characteristic.

27
Results –SAR—among groups

28
Conclusions
Under 50ms deviation, the SAR of RD group is smaller than the control group.

29
Dimension of MMN
30
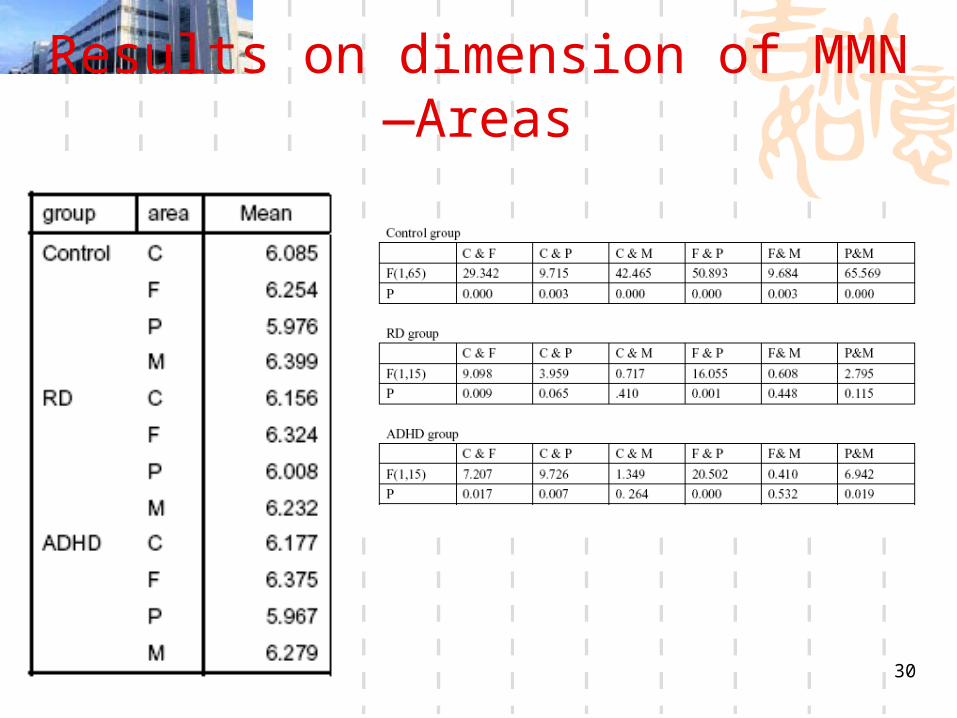
Results on dimension of MMN—Areas

31
Conclusion and discussion
Variations of data’s complexity at different part of the brain got weaker from the sequence of control, ADHD, to RD children.
How to prove this from other data analysis methods ?
To test the data difference among channels may be one promising method-------diffusion distance is such a procedure

32
Diffusion Distance
Notes: L=0
in this study

33
Data processing procedure
Time-frequency representation through HHT on MMN under concatenated trials
Compute the Diffusion DistanceCompute the diffusion distance for each
channel : between each channel and the other 8 channels
Make the statistical analysis of diffusion distance among groups

34
Results: grand mean value of diffusion distance
Estimates
Measure: MEASURE_1
341.132 8.156 324.941 357.324
302.883 16.565 269.998 335.768
340.931 16.565 308.046 373.816
group1
2
3
Mean Std. Error Lower Bound Upper Bound
95% Confidence Interval

35
Results: Statistical tests
Tests of Between-Subjects Effects
Measure: MEASURE_1
Transformed Variable: Average
96142198.7 1 96142198.67 1172.263 .000
339137.393 1 339137.393 4.135 .045
6561135.248 80 82014.191
SourceIntercept
group
Error
Type III Sumof Squares df Mean Square F Sig.
Tests of Between-Subjects Effects
Measure: MEASURE_1
Transformed Variable: Average
59687489.9 1 59687489.90 912.683 .000
208471.765 1 208471.765 3.188 .084
1961934.099 30 65397.803
SourceIntercept
group
Error
Type III Sumof Squares df Mean Square F Sig.
Between Control and RD
Between RD and ADHD

36
Conclusion
RD children have smaller difference among different parts of brain than control and ADHD groups
This corresponds to the conclusion derived from concatenated trial based HHT on MMN, i.e., Variations of data’s complexity at different
part of the brain got weaker from the sequence of control, ADHD, to RD children.

37
Own Articles
Hilbert-Huang transformation vs. morlet wavelet transformation on MMNhas been submitted to the journal—Nonlinear
biomedical physics (revised)
Concatenated trial based Hilbert-Huang transformation on MMN is going to be submitted to a psychology journ
al soon

38
Key References
Huang N.E., Shen Z., Long S.R. et al, (1998). The empirical mode decomposition and the Hilbert spectrum for nonlinear and non-stationary time series analysis. 454: 903-995.
Huttunen, T., Kaartinen, J., Tolvanen A., Lyytinen, H. (2008). Mismatch negativity (MMN) elicited by duration deviations in children with reading disorder, attention deficit or both. International Journal of Psychophysiology, 69: 69–77.

39
Thank you for your attention!!

40
Contact:
Fengyu Cong Ph.D. Assistentti Department of Mathematical Information T
echnology, JYU Tel.: +358-14-2603098 Email: [email protected] Homepage: http://users.jyu.fi/~fecong/