1 components of a scalable distributed relational information service dong lu june 14, 2005
Post on 20-Dec-2015
213 views
TRANSCRIPT

1
Components of a Scalable Distributed Relational Information Service
Dong Lu
June 14, 2005

2
Outline• Bird’s Eye View
– What is RGIS? – Architecture– What components are studied in the thesis?
• Size-Based Scheduling With Inaccurate Info– Fairness and efficiency as function of correlation – Other applications: beyond RGIS
• DualPats: Characterizing and Predicting TCP Throughput on the Wide Area Network– Why TCP throughput prediction?– Flow size / TCP throughput correlation– Issues with simple benchmarking– DualPats algorithm and dynamic rate adjustment
• Thesis Contributions

3
RGIS• Grid computing
– Providing dependable, reliable, consistent, pervasive and unlimited computing resources
• RGIS: Relational Grid Information Service– Represents globally distributed resources,
including the network– Relational Model allows complex compositional
queries– Relational Model is well studied; large user
population– RGIS servers distributed among multiple
organizations and sites
4
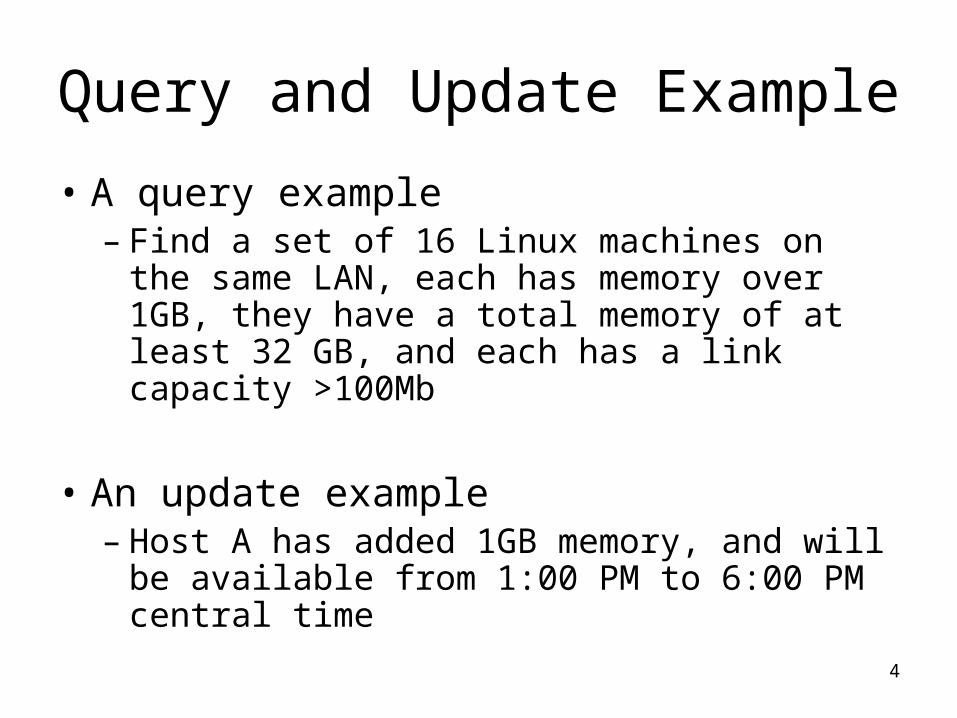
Query and Update Example
• A query example– Find a set of 16 Linux machines on the same
LAN, each has memory over 1GB, they have a total memory of at least 32 GB, and each has a link capacity >100Mb
• An update example– Host A has added 1GB memory, and will be
available from 1:00 PM to 6:00 PM central time
5
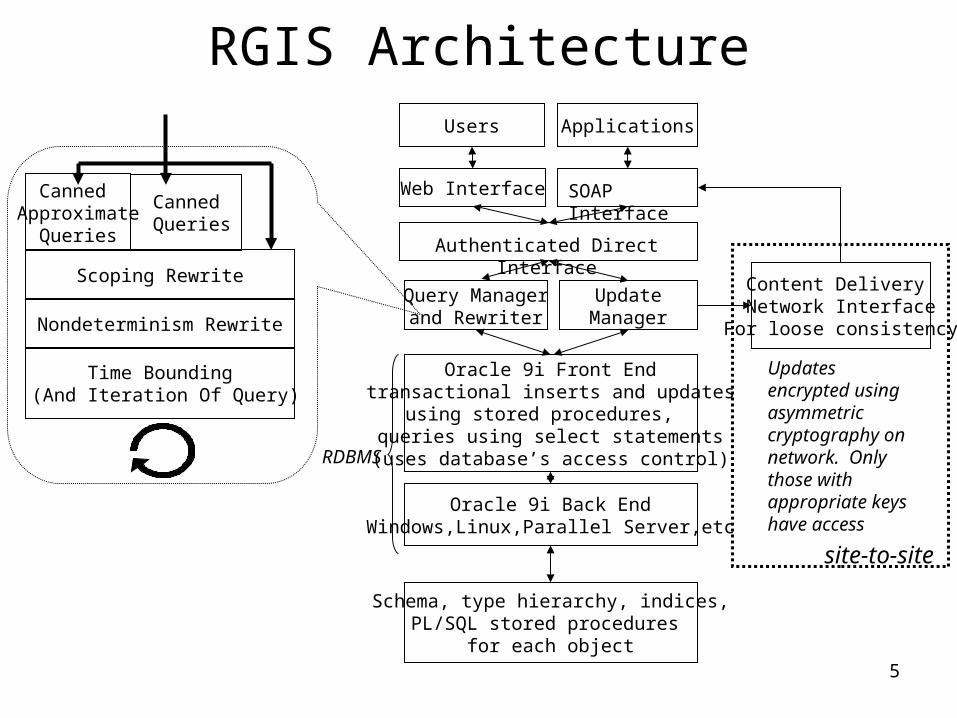
RGIS Architecture
Oracle 9i Back EndWindows,Linux,Parallel Server,etc
Oracle 9i Front Endtransactional inserts and updates
using stored procedures, queries using select statements
(uses database’s access control)
UpdateManager
Web Interface
Content Delivery Network Interface
For loose consistency
Query Managerand Rewriter
Users
Schema, type hierarchy, indices,PL/SQL stored procedures
for each object
Applications
RDBMS
site-to-site
Updates encrypted using asymmetric cryptography on network. Only those with appropriate keys have access
Authenticated Direct Interface
SOAP Interface
Scoping Rewrite
Canned Queries
Canned Approximate
Queries
Nondeterminism Rewrite
Time Bounding (And Iteration Of Query)

6
RGIS Web Interface

7
RGIS Architecture
Oracle 9i Back EndWindows,Linux,Parallel Server,etc
Oracle 9i Front Endtransactional inserts and updates
using stored procedures, queries using select statements
(uses database’s access control)
UpdateManager
Web Interface
Content Delivery Network Interface
For loose consistency
Query Managerand Rewriter
Users
Schema, type hierarchy, indices,PL/SQL stored procedures
for each object
Applications
RDBMS
site-to-site
Updates encrypted using asymmetric cryptography on network. Only those with appropriate keys have access
Authenticated Direct Interface
SOAP Interface
Scoping Rewrite
Canned Queries
Canned Approximate
Queries
Nondeterminism Rewrite
Time Bounding (And Iteration Of Query)

8
Query Components
• GridG: the first synthetic grid generator – Topology [Sigmetrics Performance Evaluation
Review, Vol 30, No. 4, 2003]– Annotation [SC’03-1]
• Query rewriting techniques to trade off query time and the result set size – Nondeterministic query [SC’03-2]– Scoped and approximate queries [GRID’03]

9
Update and CDN Components
• Size-Based Scheduling with inaccurate info to minimize mean update time– Fairness and efficiency as function of correlation
[MASCOTS’04-1]– P2P scheduling [LCR’04], one in submission– Web server scheduling, in submission– Other applications [MASCOTS’04-2]
• Characterizing and predicting TCP throughput on the WAN to determine update transfer time– [ICDCS’05]
10
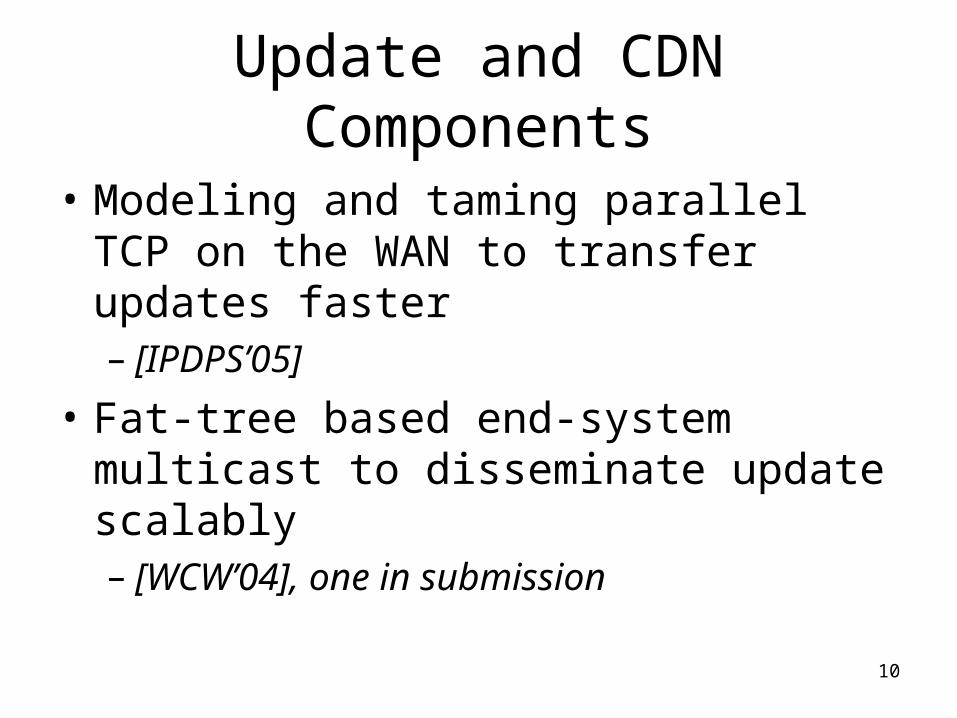
Update and CDN Components
• Modeling and taming parallel TCP on the WAN to transfer updates faster– [IPDPS’05]
• Fat-tree based end-system multicast to disseminate update scalably– [WCW’04], one in submission

11
Outline• Bird’s Eye View
– What is RGIS? – Architecture– What components are studied in the thesis?
• Size-Based Scheduling With Inaccurate Info– Fairness and efficiency as function of correlation – Other applications: beyond RGIS
• DualPats: Characterizing and Predicting TCP Throughput on the Wide Area Network– Why TCP throughput prediction?– Flow size / TCP throughput correlation– Issues with simple benchmarking– DualPats algorithm and dynamic rate adjustment
• Thesis Contributions

12
Scheduling Section Outline
• Review of Size-Based Scheduling
• Motivation
• Simulation Setup
• Simulation Results
• New Applications

13
The scheduling problem
Scheduler
Database
Updates come from CDN
Which update to run next?
Scheduling: a general problemGoal: minimize the mean response time; be fair
10K 8K 6K 3K
Response time: the time from job arrival to its completion
14
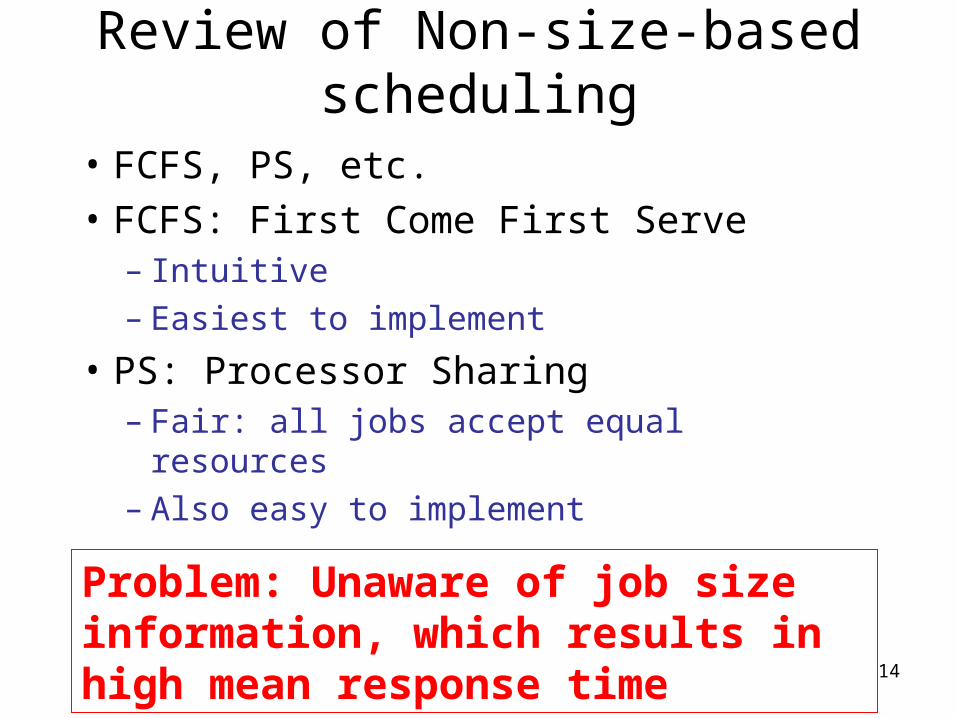
Review of Non-size-based scheduling
• FCFS, PS, etc.
• FCFS: First Come First Serve– Intuitive– Easiest to implement
• PS: Processor Sharing– Fair: all jobs accept equal resources – Also easy to implement
Problem: Unaware of job size information, which results in high mean response time
15
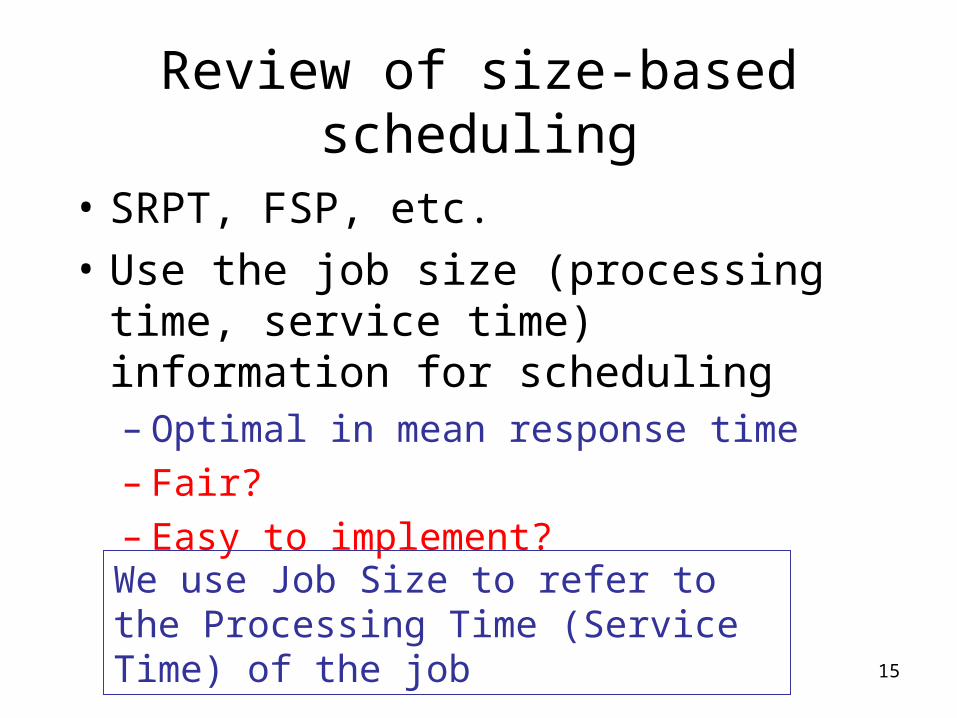
Review of size-based scheduling
• SRPT, FSP, etc.
• Use the job size (processing time, service time) information for scheduling– Optimal in mean response time– Fair?– Easy to implement?
We use Job Size to refer to the Processing Time (Service Time) of the job
16
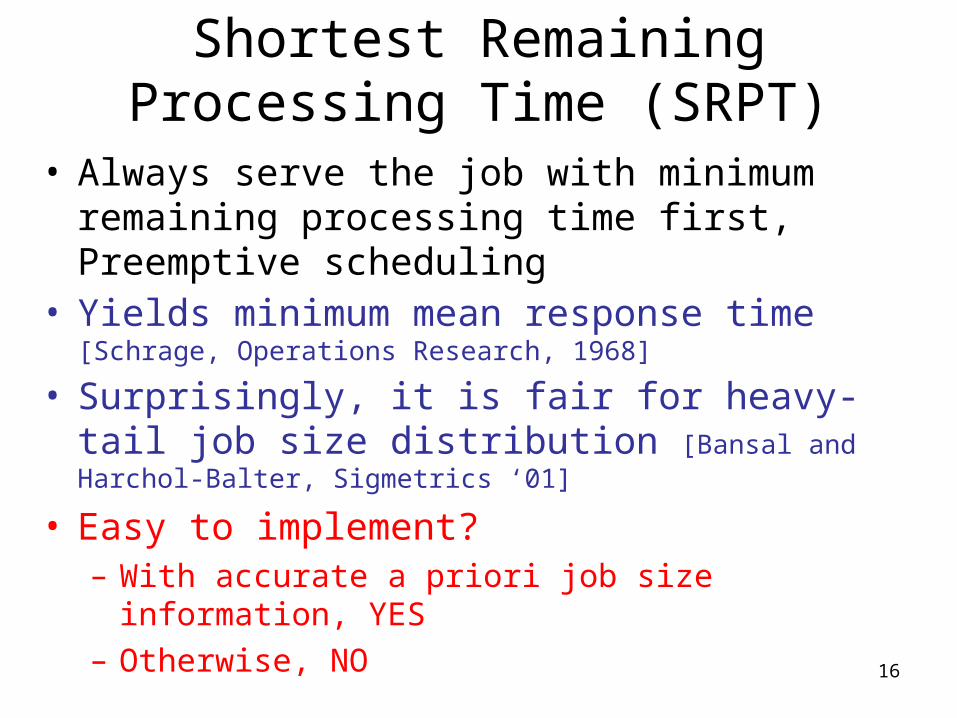
Shortest Remaining Processing Time (SRPT)
• Always serve the job with minimum remaining processing time first, Preemptive scheduling
• Yields minimum mean response time [Schrage, Operations Research, 1968]
• Surprisingly, it is fair for heavy-tail job size distribution [Bansal and Harchol-Balter, Sigmetrics ‘01]
• Easy to implement?– With accurate a priori job size information, YES– Otherwise, NO

17
Fair Sojourn Protocol (FSP)
• Combined SRPT with PS, preemptive scheduling
• Mean response time is close to that of SRPT; and more fair than SRPT and PS [Friedman, et al, Sigmetrics ‘03]
• Easy to implement? – With accurate a priori job size information, YES– Otherwise, NO

18
Scheduling Section Outline
• Review of Size-Based Scheduling
• Motivation
• Simulation Setup
• Simulation Results
• New Applications

19
Motivation
• Size-based scheduling requires accurate knowledge of job sizes
• In practice, a priori job size information is not always available
• All the previous work assumes perfect knowledge of job sizes a priori
• How does performance depend on quality of job size information?
20
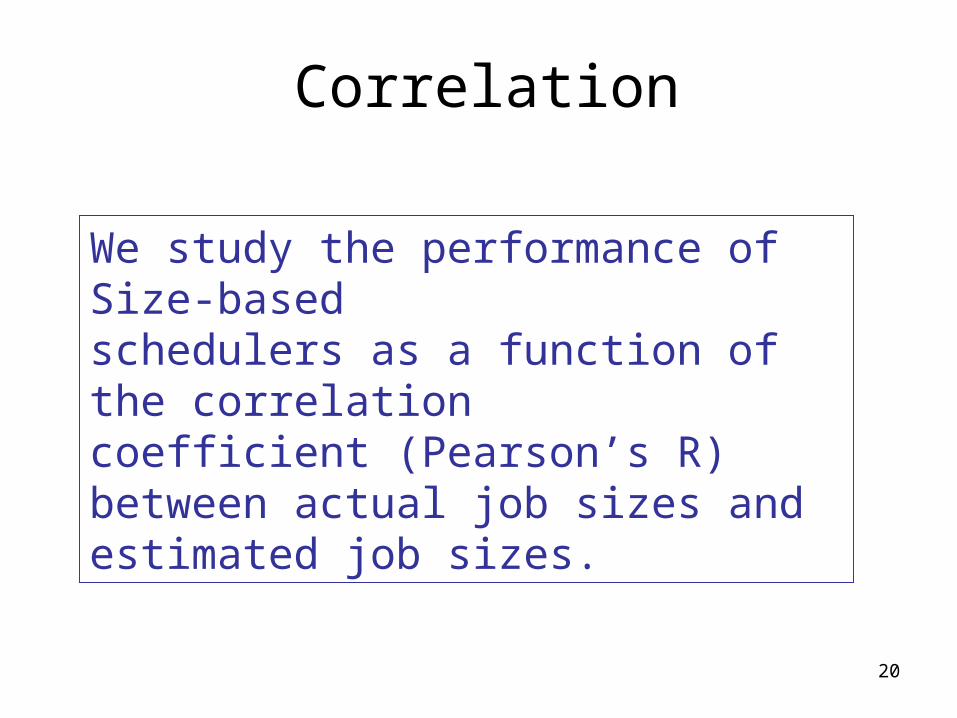
Correlation
We study the performance of Size-based schedulers as a function of the correlation coefficient (Pearson’s R) between actual job sizes and estimated job sizes.
21
Scheduling Section Outline
• Review of Size-Based Scheduling
• Motivation
• Simulation Setup
• Simulation Results
• New Applications

22
Trace generator
Trace Generator
Correlation (Pearson’s R)
Distribution A Distribution B
X Y1 1005 300. .. .. .
Correlated random pairs of X and Y• X has distribution A• Y has distribution B• X and Y are correlated to R
23
Trace generator algorithm
• Algorithm: “Normal-To-Anything”– First developed by Cario and Nelson, on
INFORMS Journal on Computing 10, 1 (1998).
– We simplified the algorithm and first introduced it into the simulation studies of computer systems

24
Scatter plot of example traces
R=0.13 R=0.78
Y
X
Y
X

25
Performance metrics
• Mean response time: Sojourn time, Turn-around time
• Slowdown: the ratio of response time to its size. Fairness metric

26
Simulator
• Simulator– Supports M/G/1 and G/G/n/m queuing model
• Simulator validation– Little’s law– Repeat the simulations in the FSP paper
[Friedman, et al, Sigmetrics ‘03]
– Compare with available theoretical results [Bansal and Harchol-Balter, Sigmetrics ‘01]

27
Scheduling Policies
• PS: Processor sharing
• Size-based scheduling policies– SRPT: Ideal SRPT scheduler– SRPT-E: SRPT scheduler using estimated job
size
– FSP: Ideal Fair Sojourn Protocol– FSP-E: FSP scheduler using estimated job size
Each simulation is repeated 20 times and we present the average

28
Scheduling Section Outline
• Review of Size-Based Scheduling
• Motivation
• Simulation Setup
• Simulation Results
• New Applications
29
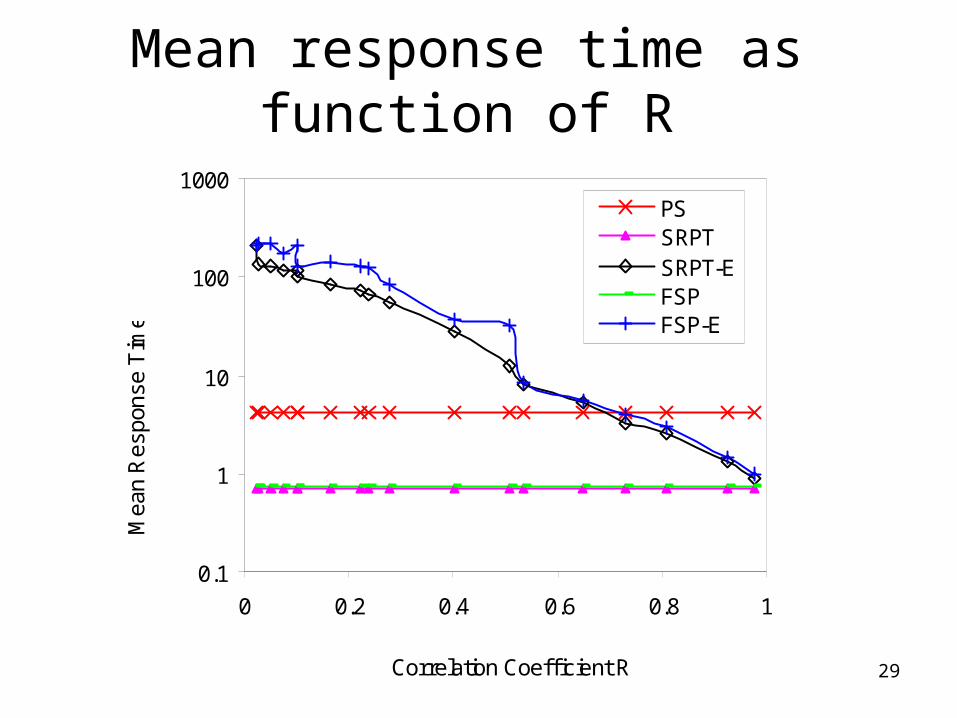
Mean response time as function of R
0.1
1
10
100
1000
0 0.2 0.4 0.6 0.8 1
Correlation Coefficient R
Mea
n R
espo
nse
Tim
e
PSSRPTSRPT-EFSPFSP-E

30
Slowdown (R=0.0224)
1
10
100
1000
10000
0 10 20 30 40 50 60 70 80 90 100
Job Size Percentile (R=0.0224)
Slo
wd
ow
n
PSSRPTSRPT-EFSPFSP-E
31
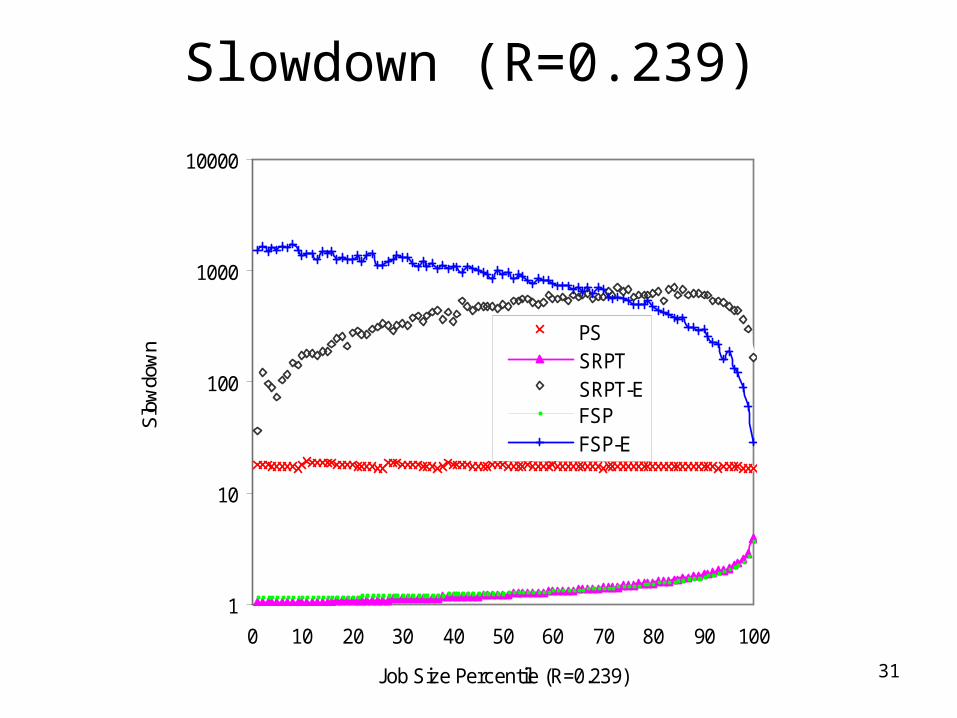
Slowdown (R=0.239)
1
10
100
1000
10000
0 10 20 30 40 50 60 70 80 90 100
Job Size Percentile (R=0.239)
Slo
wdo
wn
PSSRPTSRPT-EFSPFSP-E
32
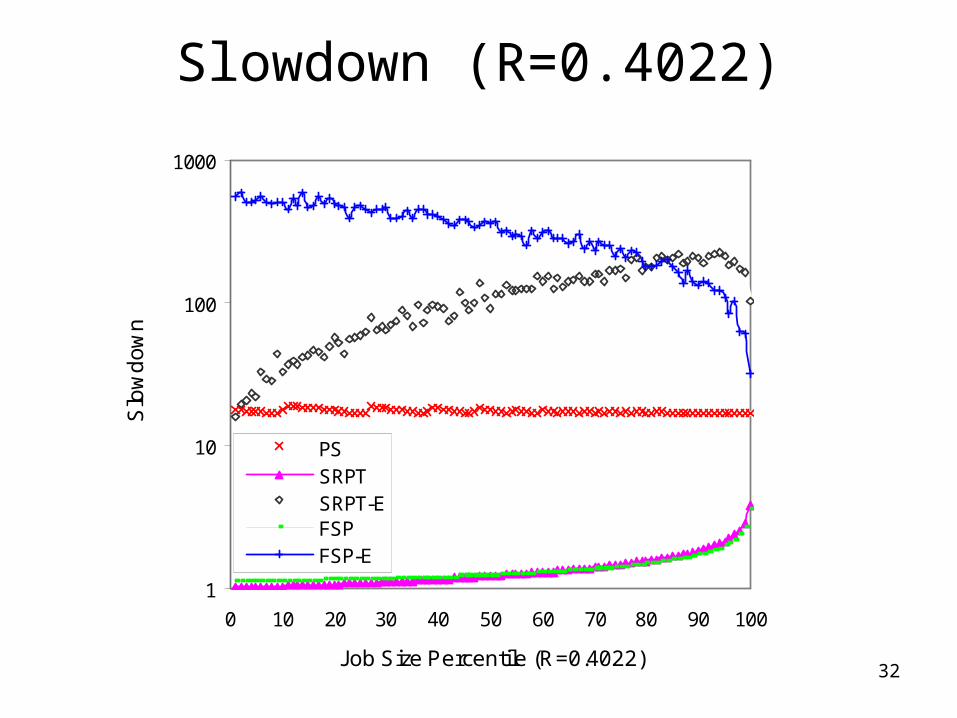
Slowdown (R=0.4022)
1
10
100
1000
0 10 20 30 40 50 60 70 80 90 100
Job Size Percentile (R=0.4022)
Slo
wd
ow
n
PSSRPTSRPT-EFSPFSP-E

33
Slowdown (R=0.5366)
1
10
100
1000
0 10 20 30 40 50 60 70 80 90 100
Job Size Percentile (R=0.5366)
Slo
wdo
wn
PSSRPTSRPT-EFSPFSP-E
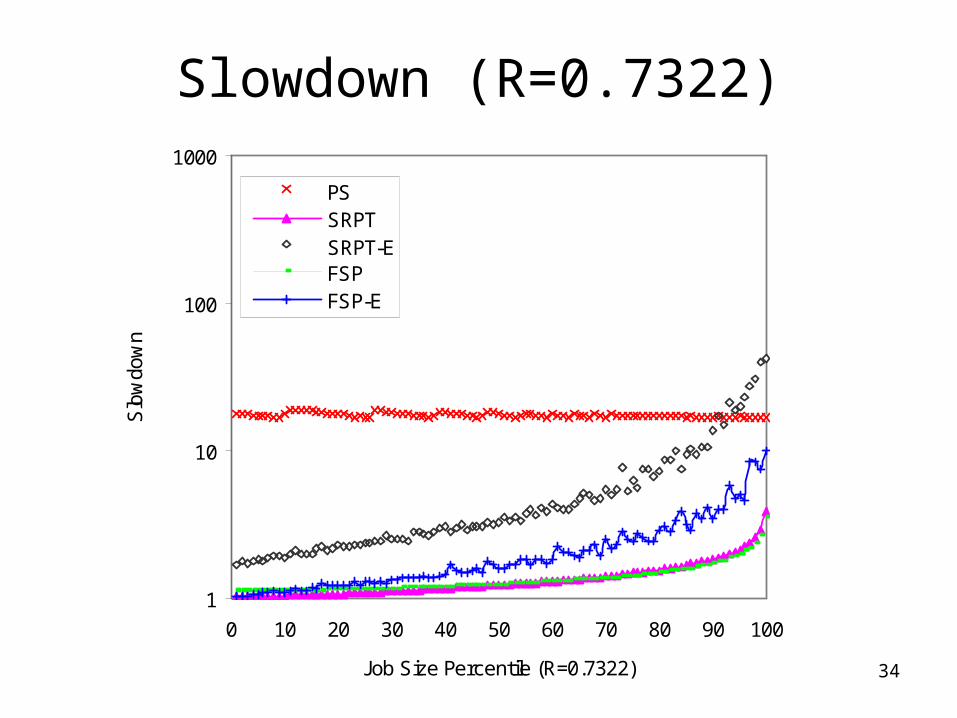
34
Slowdown (R=0.7322)
1
10
100
1000
0 10 20 30 40 50 60 70 80 90 100
Job Size Percentile (R=0.7322)
Slo
wdo
wn
PSSRPTSRPT-EFSPFSP-E
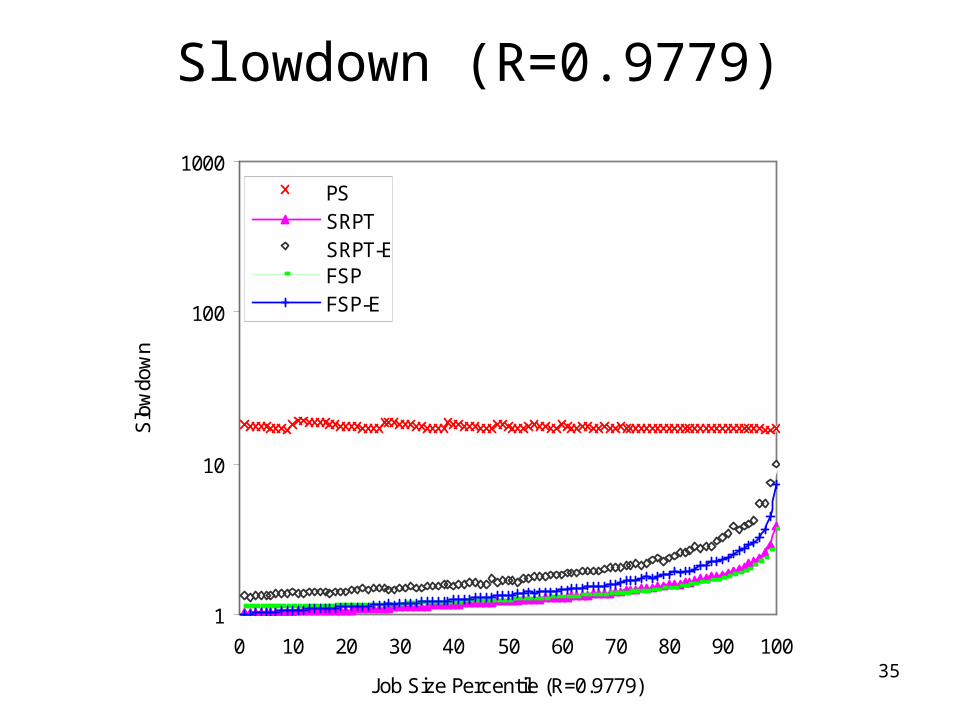
35
Slowdown (R=0.9779)
1
10
100
1000
0 10 20 30 40 50 60 70 80 90 100
Job Size Percentile (R=0.9779)
Slo
wdo
wn
PSSRPTSRPT-EFSPFSP-E
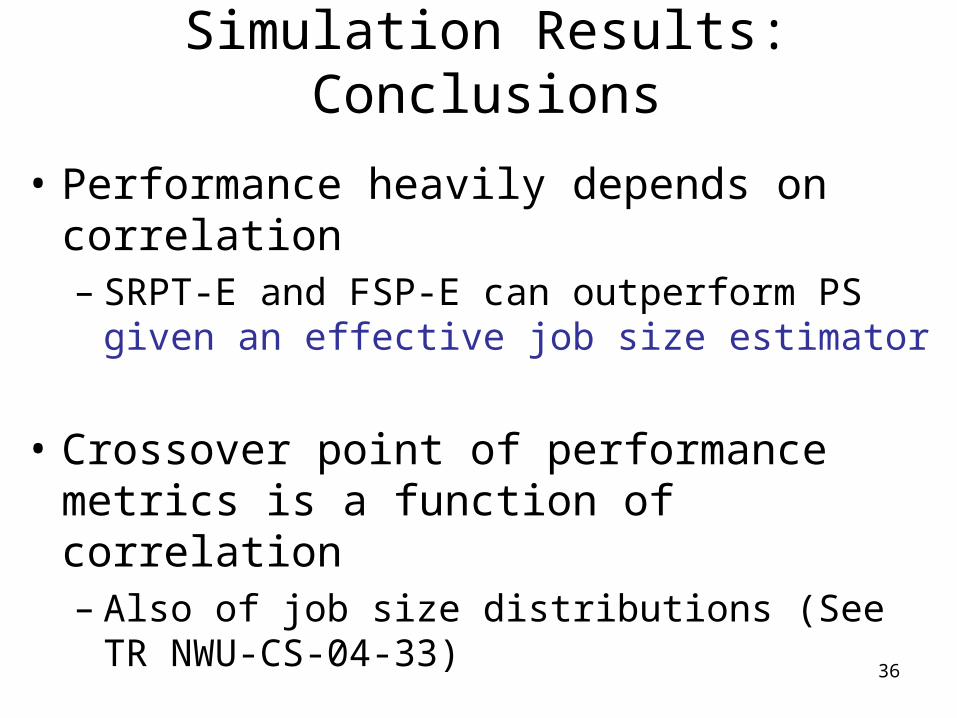
36
Simulation Results: Conclusions
• Performance heavily depends on correlation– SRPT-E and FSP-E can outperform PS given an
effective job size estimator
• Crossover point of performance metrics is a function of correlation– Also of job size distributions (See TR NWU-CS-04-
33)
37
Scheduling Section Outline
• Review of Size-Based Scheduling
• Motivation
• Simulation Setup
• Simulation Results
• New Applications
38
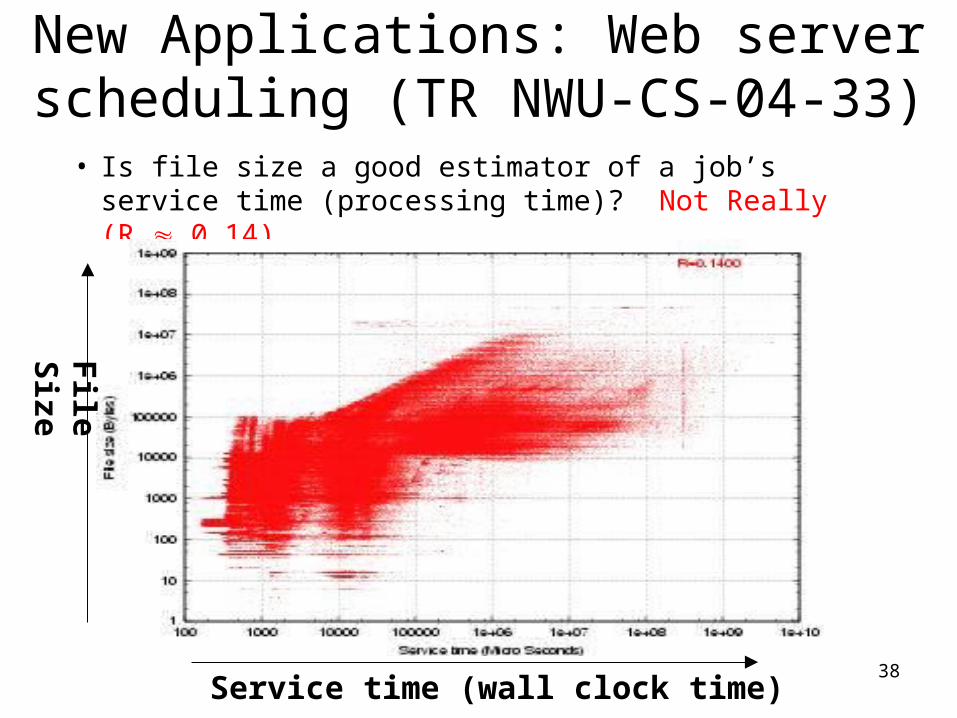
New Applications: Web server scheduling (TR NWU-CS-04-33)
• Is file size a good estimator of a job’s service time (processing time)? Not Really (R 0.14)
Service time (wall clock time)
File
Size
39
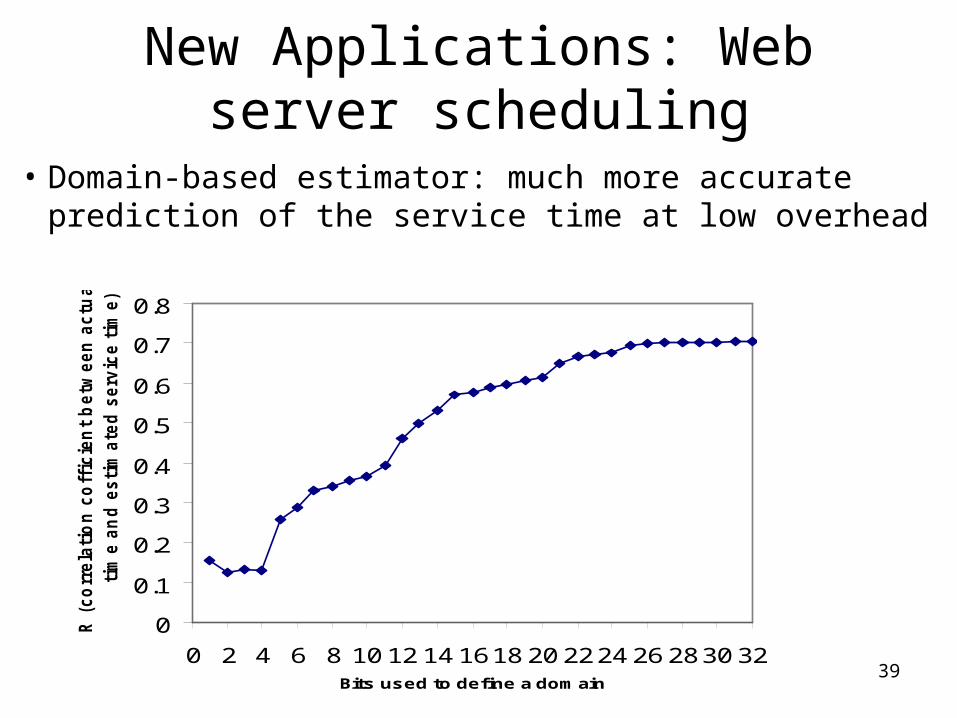
New Applications: Web server scheduling
• Domain-based estimator: much more accurate prediction of the service time at low overhead
0
0.1
0.2
0.3
0.4
0.5
0.6
0.7
0.8
0 2 4 6 8 10 12 14 1618 20 2224 26 2830 32Bits used to define a domain
R (
co
rrela
tio
n c
off
icie
nt
betw
een
actu
al serv
ice
tim
e a
nd
esti
mate
d s
erv
ice t
ime)

40
New Applications: P2P server side scheduling (LCR ’04)
• “Server side” of current file sharing P2P applications superficially similar to web server – Both send back files upon requests.
• However, P2P application can’t even know the file size accurately a priori– Partial downloads
• Our ongoing work shows that SRPT-E performs well using our time-series based job size estimators.

41
Scheduling Section Summary
• Performance of size-based scheduling policies depends on correlation between size estimates and actual sizes– Fairness, mean response time, etc.
• Estimator must preserve ordering of job sizes for high performance– Performance degrades as correlation degrades
• Effective new estimators for Web and P2P
42
Outline• Bird’s Eye View
– What is RGIS? – Architecture– What components are studied in the thesis?
• Size-Based Scheduling With Inaccurate Info– Fairness and efficiency as function of correlation – Other applications: beyond RGIS
• DualPats: Characterizing and Predicting TCP Throughput on the Wide Area Network– Why TCP throughput prediction?– Flow size / TCP throughput correlation– Issues with simple benchmarking– DualPats algorithm and dynamic rate adjustment
• Thesis Contributions
43
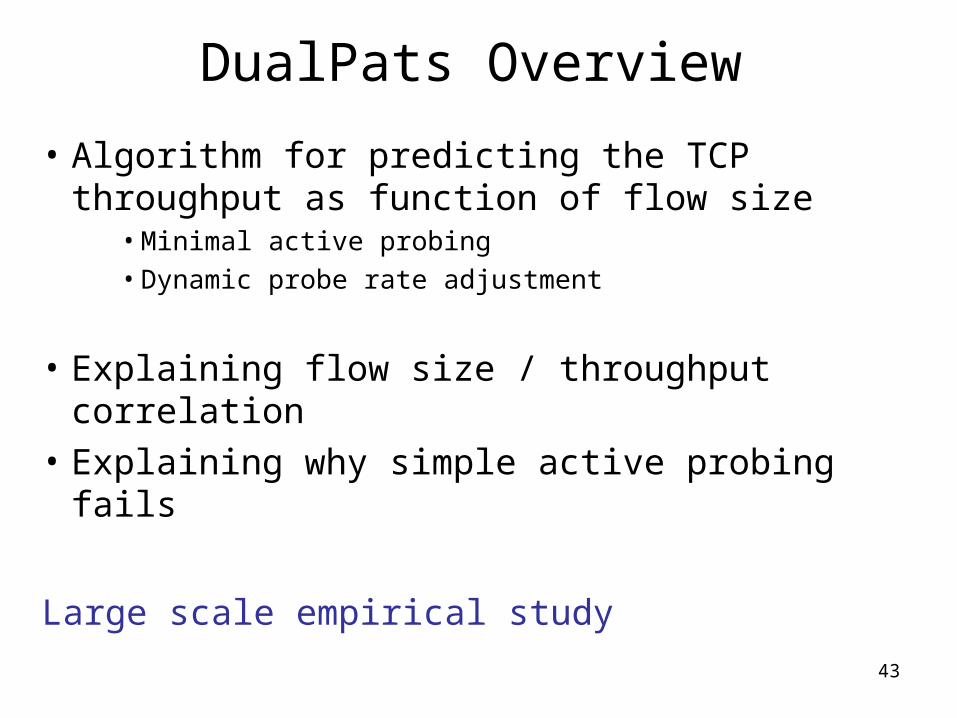
DualPats Overview
• Algorithm for predicting the TCP throughput as function of flow size
• Minimal active probing• Dynamic probe rate adjustment
• Explaining flow size / throughput correlation
• Explaining why simple active probing fails
Large scale empirical study

44
DualPats Section Outline
• Why TCP Throughput Prediction?
• Particulars of Study
• Flow Size / TCP Throughput Correlation
• Issues with Simple Benchmarking
• DualPats Algorithm
• Stability and Dynamic Rate Adjustment

45
GoalA library call
BW = PredictTransfer(src,dst,numbytes);
Expected Time = numbytes/BW;
Ideally, we want a confidence interval:
(BWLow,BWHigh) = PredictTransfer(src,dst,numbytes,p);

46
Available Bandwidth
• Maximum rate a path can offer a flow without slowing other flows– pathchar, cprobe, nettimer, delphi, IGI, pathchirp,
pathload … – mainly for traffic engineering
• Available bandwidth can differ significantly from TCP throughput
• Not real time, takes at least tens of seconds to run

47
Simple TCP Benchmarking
• Benchmark paths with a single small probe– BW = ProbeSize/Time– Widely used Network Weather Service (NWS)
and others (Remos benchmarking collector)
• Not accurate for large transfers on the current high speed Internet– Numerous papers show this and attempt to fix it
48
Fixing Simple TCP Benchmarking
• Logs [Sundharshan]: correlate real transfer measurements with benchmarking measurements
• Recent transfers needed• Similar size transfers needed• Measurements at application chosen times
• CDF-matching [Swany]: correlate CDF of real transfer measurements with CDF of benchmarking measurements
• Recent transfers still needed• Measurements at application chosen times
49
Analysis of TCP
• Extensive research on TCP throughput modeling in networking community
• Really intended to build better TCPs
• Difficult to use models online because of hard to measure parameters
• Future loss rate and RTT
50
DualPats Section Outline
• Why TCP Throughput Prediction?
• Particulars of Study
• Flow Size / TCP Throughput Correlation
• Issues with Simple Benchmarking
• DualPats Algorithm
• Stability and Dynamic Rate Adjustment
51
Our Study
• PlanetLab and additional machines– Located all over the world
• Measurements of throughput– Wide open socket buffers (1-3 MB)– Simple client/server– scp– GridFTP
• Four separate sets of measurements

52
Four sets of measurements
• Distribution set: for analysis of TCP throughput stability and distributions
• Correlation set: for studying correlation between throughput and flow size, initial testing of algorithm
• Verification Set: test our benchmarking mechanism
• Online Evaluation Set: test our online algorithm

53
Distribution Set
• For analysis of TCP throughput stability and distributions
• 60 randomly chosen paths among PlanetLab machines
• 1.6 million transfers (client/server)– 100 KB, 200 KB, 400 KB, … 10 MB flows– 3000 consecutive transfers per path+flow size

54
Correlation Set
• For studying correlation between throughput and flow size, initial testing of algorithm
• 60 randomly chosen paths among PlanetLab machines
• 2.4 million transfers, 270 thousand runs, client/server– 100 KB, 200 KB, 400 KB, … 10 MB flows
– Run = sweep flow size for path

55
Verification Set
• Test algorithm
• 30 randomly chosen paths among PlanetLab machines and others
• 4800 transfers, 300 runs, scp and GridFTP– 5 KB to 1 GB flows– Run = sweep flow size for path

56
Online Evaluation Set
• Test online algorithm
• 50 randomly chosen paths among PlanetLab machines and others
• 14000 transfers, scp and GridFTP– 40 MB or 160 MB file, randomly chosen– 10 days

57
DualPats Section Outline
• Why TCP Throughput Prediction?
• Particulars of Study
• Flow Size / TCP Throughput Correlation
• Issues with Simple Benchmarking
• DualPats Algorithm
• Stability and Dynamic Rate Adjustment

58
Strong Correlation Between Throughput and Flow Size
Correlation andVerification Sets

59
An example of Strong Correlation
0
2000
4000
6000
8000
10000
12000
0 20000 40000 60000 80000 100000
File size (KB)
BW
(K
B/S
ec)

60
Why Does The Correlation Exist?
• Slow start and user effects [Zhang]
• Non-negligible startup overheads– Control messages in scp and GridFTP
• Residual slow start effect– SACK results in slow convergence to
equilibrium

61
DualPats Section Outline
• Why TCP Throughput Prediction?
• Particulars of Study
• Flow Size / TCP Throughput Correlation
• Issues with Simple Benchmarking
• DualPats Algorithm
• Stability and Dynamic Rate Adjustment

62
y = 9E-05x + 0.7246
R2 = 0.9992
0
0.5
1
1.5
2
2.5
3
3.5
0 5000 10000 15000 20000 25000 30000 35000
File size (KB)
Tim
e (
se
c)
Why Simple Benchmarking FailsProbes are too small
Need more than one probe to capture correlation
63
DualPats Section Outline
• Why TCP Throughput Prediction?
• Particulars of Study
• Flow Size / TCP Throughput Correlation
• Issues with Simple Benchmarking
• DualPats Algorithm
• Stability and Dynamic Rate Adjustment

64
y = 9E-05x + 0.7246
R2 = 0.9992
0
0.5
1
1.5
2
2.5
3
3.5
0 5000 10000 15000 20000 25000 30000 35000
File size (KB)
Tim
e (
se
c)
Our ApproachTwo consecutive probes, both larger than the noise region
65
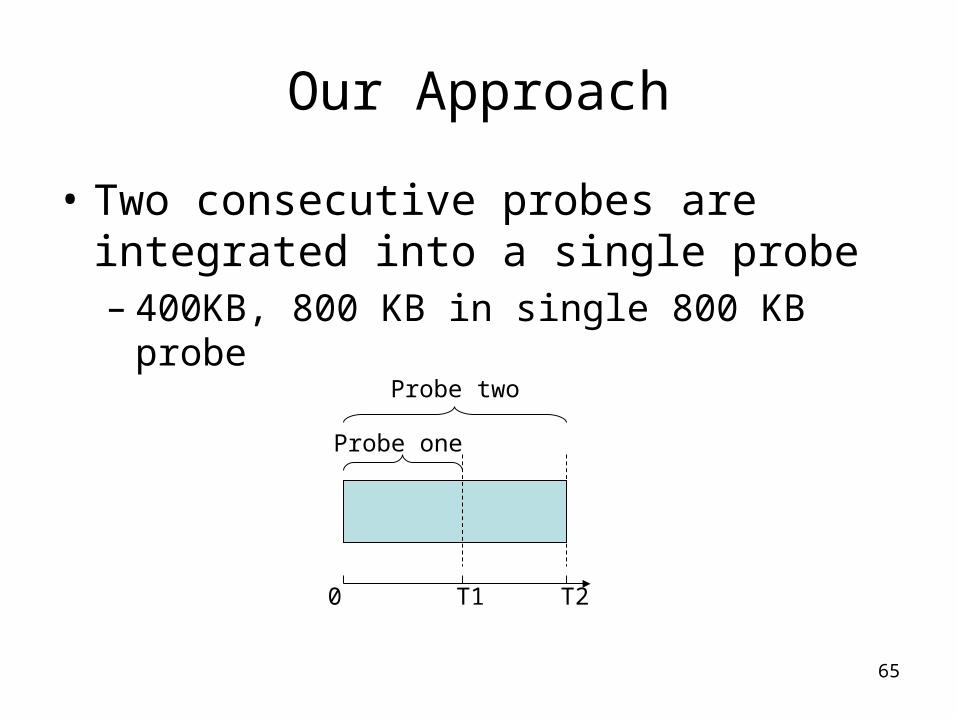
Our Approach
• Two consecutive probes are integrated into a single probe– 400KB, 800 KB in single 800 KB probe
0 T1 T2
Probe one
Probe two
66
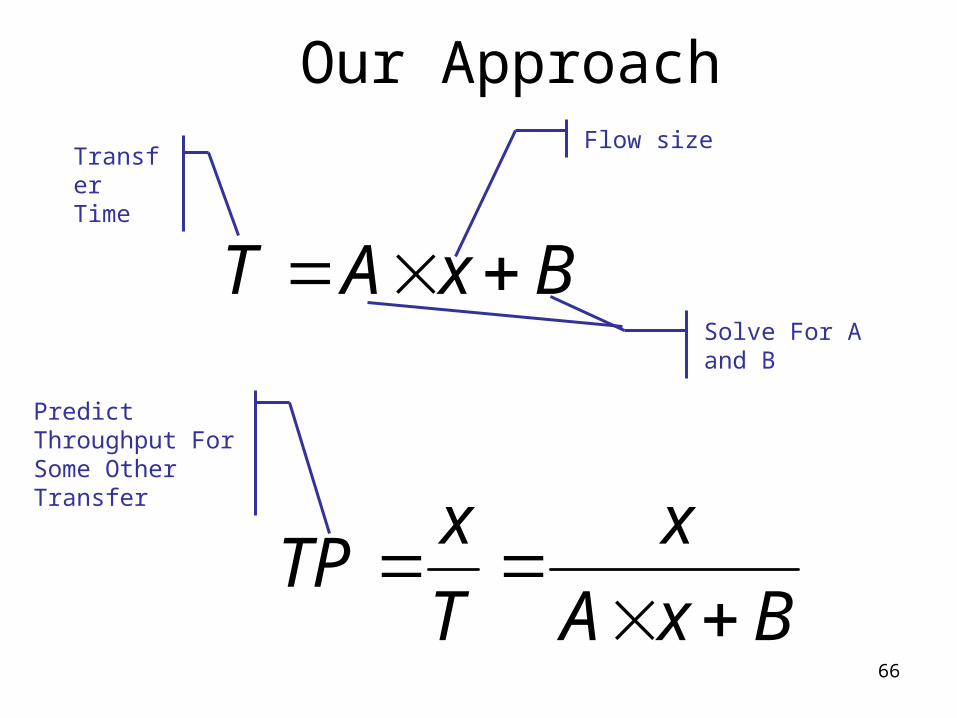
Our Approach
BxAT
BxA
x
T
xTP
Flow sizeTransfer Time
Solve For A and B
Predict Throughput For Some Other Transfer
67
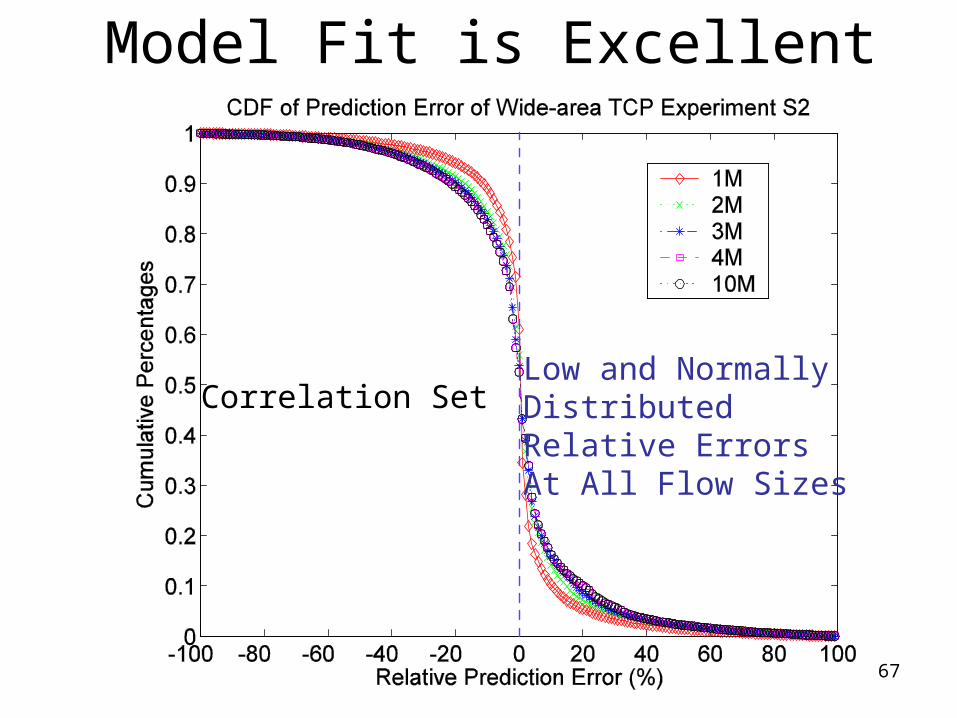
Model Fit is Excellent
Correlation SetLow and Normally Distributed Relative ErrorsAt All Flow Sizes

68
DualPats Section Outline
• Why TCP Throughput Prediction?
• Particulars of Study
• Flow Size / TCP Throughput Correlation
• Issues with Simple Benchmarking
• DualPats Algorithm
• Stability and Dynamic Rate Adjustment
69
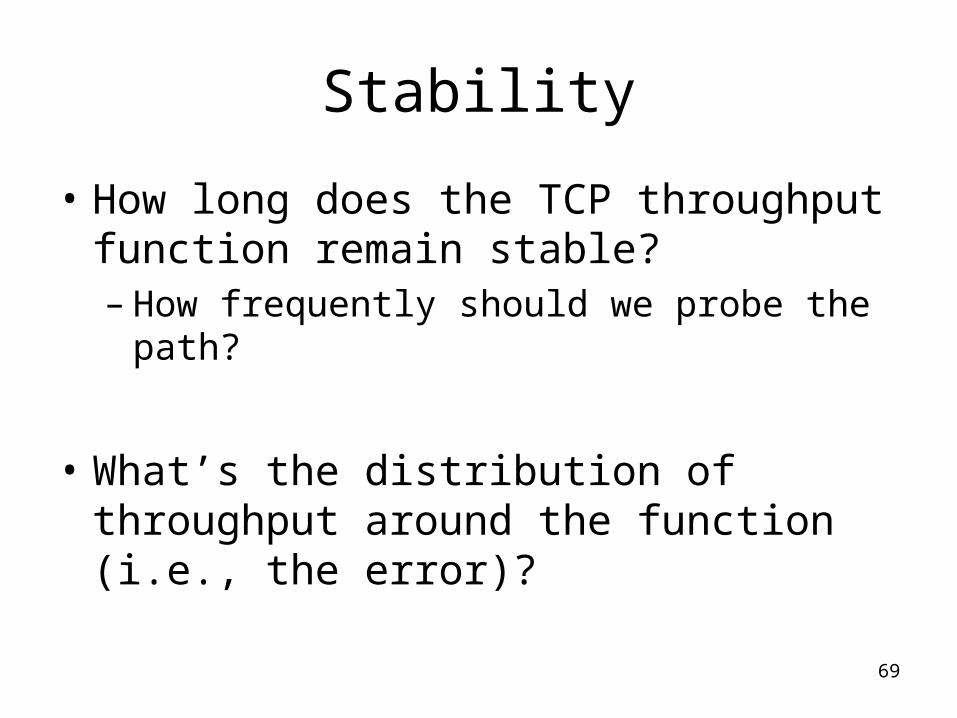
Stability
• How long does the TCP throughput function remain stable? – How frequently should we probe the path?
• What’s the distribution of throughput around the function (i.e., the error)?

70
Throughput is Stable For Long Periods
Correlation Set
Increasing Max/Min Throughput in Interval

71
Throughput For a Given Flow Size Is Normally Distributed In An Interval
Distribution Set

72
Online DualPats Algorithm
• Fetch probe sequence for destination– Start probing process if no data exists
• Project probe sequence ahead– 20 point moving average over values with
current sampling interval
• Apply model using projected data
• Return result– confidence interval computed using normality
assumptions
73
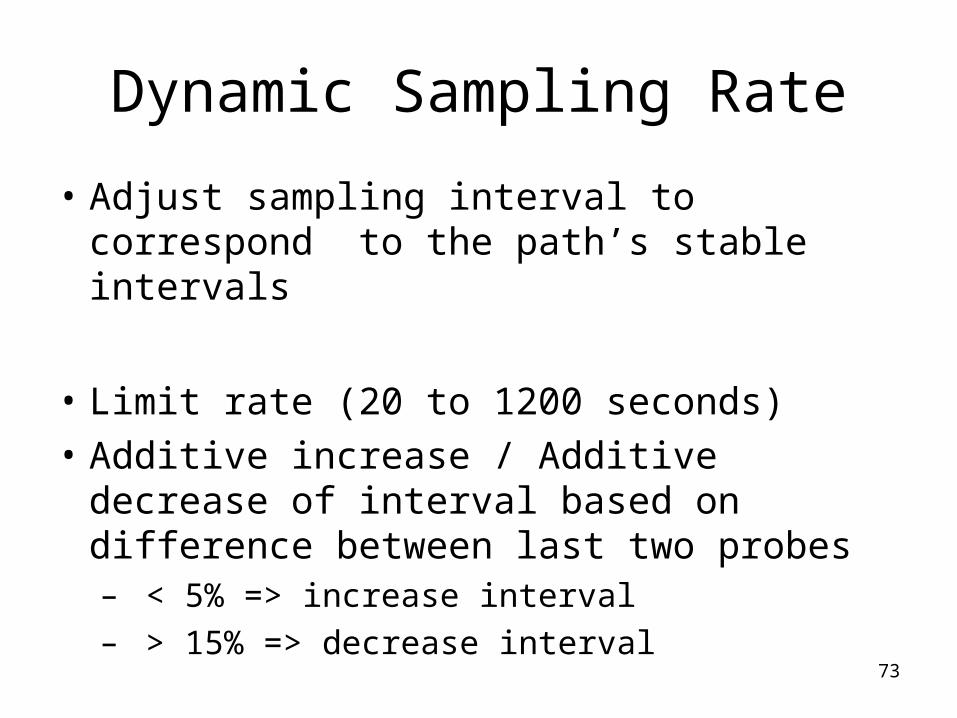
Dynamic Sampling Rate
• Adjust sampling interval to correspond to the path’s stable intervals
• Limit rate (20 to 1200 seconds)
• Additive increase / Additive decrease of interval based on difference between last two probes – < 5% => increase interval– > 15% => decrease interval

74
Evaluation
0
1
0.4-0.4
Mean relative error
Mean abs(relative error)
Relative error
P[m
ean
erro
r <
X
]
• Slight conservative bias• About 90 % of predictions have < 20% error
Online Evaluation Set

75
Section Summary
• Algorithm for predicting the TCP throughput as function of flow size
• Minimal active probing• Dynamic probe rate adjustment
• Explaining flow size / throughput correlation
• Explaining why simple active probing fails
Large scale empirical study

76
Outline• Bird’s Eye View
– What is RGIS? – Architecture– What components are studied in the thesis?
• Size-Based Scheduling With Inaccurate Info– Fairness and efficiency as function of correlation – Other applications: beyond RGIS
• DualPats: Characterizing and Predicting TCP Throughput on the Wide Area Network– Why TCP throughput prediction?– Flow size / TCP throughput correlation– Issues with simple benchmarking– DualPats algorithm and dynamic rate adjustment
• Thesis Contributions

77
Thesis Contributions• It is feasible to build a scalable distributed
Relational Grid Information Service
• RGIS architecture
• Query rewriting– Trade off query time with the size of result set
• GridG– First synthetic grid generator– Relationship between power-laws

78
Thesis Contributions
• Size-based scheduling with imperfect info
• DualPats: monitoring and predicting TCP throughput
• TameParallelTCP: modeling and taming parallel TCP
• FatNemo: fat-tree based end-system multicast

79
Future work
• Integration of research components with RGIS system
• Highly dynamic grid information: how to incorporate data from services such as RPS, NWS, DualPats, Remos
• Passive monitoring of TCP throughput• Understanding size-based scheduling in the
presence of backfilling

80
Acknowledgements
• Collaborators– P2P scheduling: Yi Qiao, Fabian Bustamante – FatNemo: Stefan Birrer, Fabian Bustamante
• RGIS implementation– Andrew Weinrich, Jack Lange, Andrew Simpson

81

82

83
84
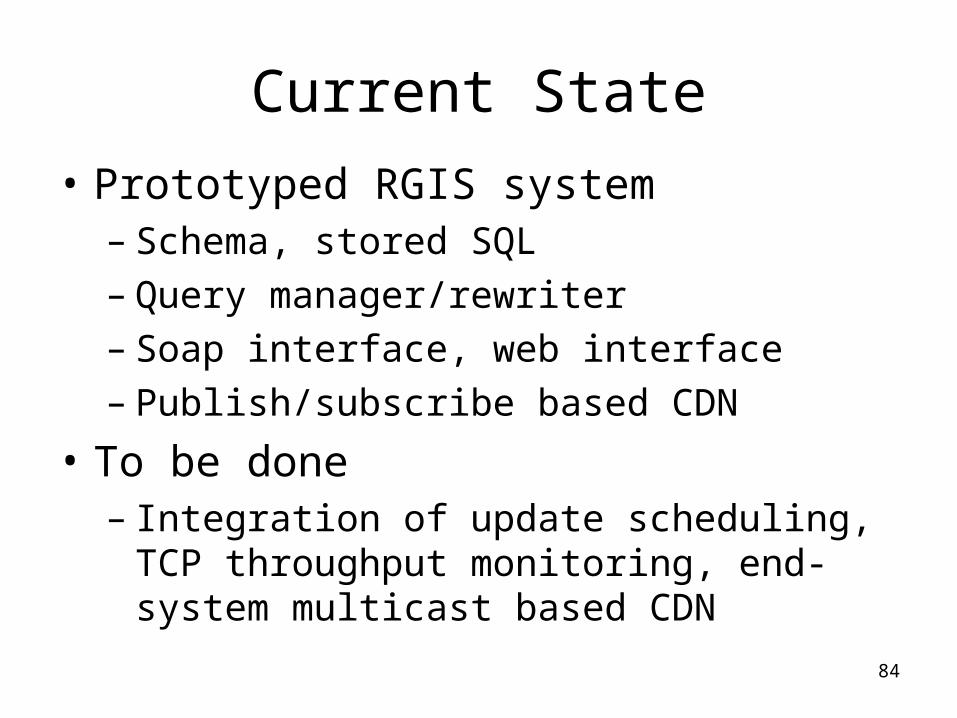
Current State
• Prototyped RGIS system– Schema, stored SQL– Query manager/rewriter– Soap interface, web interface– Publish/subscribe based CDN
• To be done– Integration of update scheduling, TCP
throughput monitoring, end-system multicast based CDN

85
Finding Sufficiently Large Probe Size
• Default values: 400 KB / 800 KB
• Upper bound
• Additive increase until prediction error are less than threshold, all with same sign.