1 cis775: computer architecture chapter 1: fundamentals of computer design
TRANSCRIPT

1
CIS775: Computer Architecture
Chapter 1: Fundamentals of Computer Design

2
Course Objectives
• To evaluate the issues involved in choosing and designing instruction set.
• To learn concepts behind advanced pipelining techniques.
• To understand the “hitting the memory wall” problem and the current state-of-art in memory system design.
• To understand the qualitative and quantitative tradeoffs in the design of modern computer systems

3
What is Computer Architecture?
• Functional operation of the individual HW units within a computer system, and the flow of information and control among them.
TechnologyProgrammingLanguageInterface
Interface Design(ISA)
Measurement & Evaluation
Parallelism
Computer Architecture:
Applications OS
Hardware Organization

4
Computer Architecture Topics
Instruction Set Architecture
Pipelining, Hazard Resolution,Superscalar, Reordering, Prediction, Speculation,Vector, DSP
Addressing,Protection,Exception Handling
L1 Cache
L2 Cache
DRAM
Disks, WORM, Tape
Coherence,Bandwidth,Latency
Emerging TechnologiesInterleaving Memories
RAID
VLSI
Input/Output and Storage
MemoryHierarchy
Pipelining and Instruction Level Parallelism
5
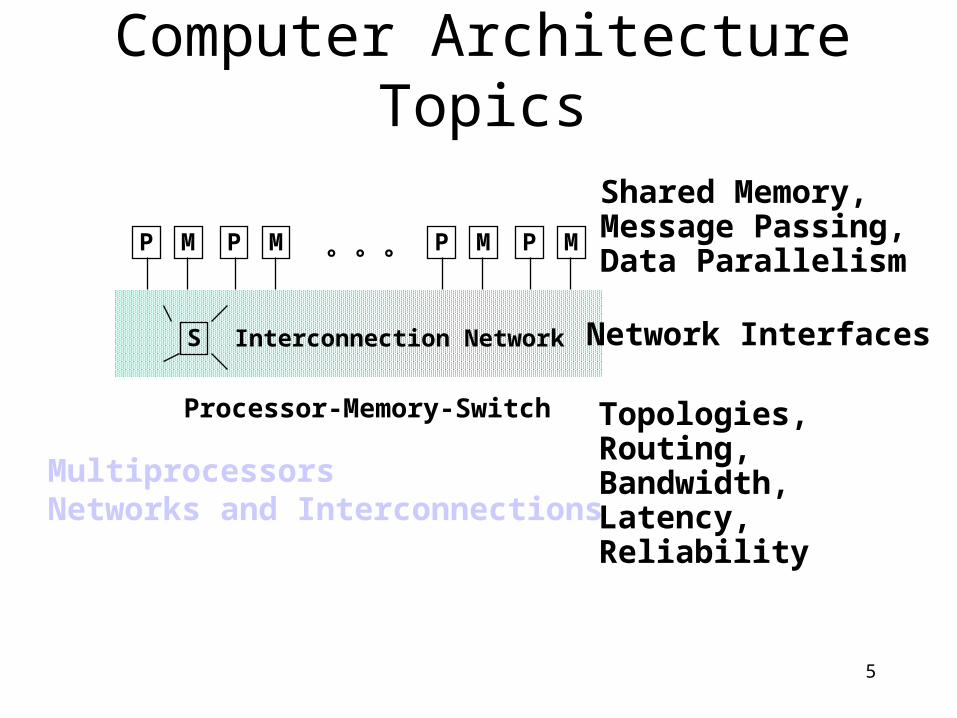
Computer Architecture Topics
M
Interconnection NetworkS
PMPMPMP° ° °
Topologies,Routing,Bandwidth,Latency,Reliability
Network Interfaces
Shared Memory,Message Passing,Data Parallelism
Processor-Memory-Switch
MultiprocessorsNetworks and Interconnections

6
Measurement and Evaluation
Design
Analysis
Architecture is an iterative process:• Searching the space of possible designs• At all levels of computer systems
Creativity
Good IdeasGood Ideas
Mediocre IdeasBad Ideas
Cost /PerformanceAnalysis

7
Issues for a Computer Designer• Functional Requirements Analysis (Target)
– Scientific Computing – HiPerf floating pt.– Business – transactional support/decimal arith.– General Purpose –balanced performance for a range of tasks
• Level of software compatibility– PL level
• Flexible, Need new compiler, portability an issue
– Binary level (x86 architecture)• Little flexibility, Portability requirements minimal
• OS requirements– Address space issues, memory management, protection
• Conformance to Standards– Languages, OS, Networks, I/O, IEEE floating pt.

8
Computer Systems: Technology Trends
• 1988– Supercomputers
– Massively Parallel Processors
– Mini-supercomputers
– Minicomputers
– Workstations
– PC’s
• 2002– Powerful PC’s and
SMP Workstations
– Network of SMP Workstations
– Mainframes
– Supercomputers
– Embedded Computers

9
Why Such Change in 10 years?• Performance
– Technology Advances• CMOS (complementary metal oxide semiconductor) VLSI dominates older
technologies like TTL (transistor transistor logic) in cost AND performance
– Computer architecture advances improves low-end • RISC, pipelining, superscalar, RAID, …
• Price: Lower costs due to …– Simpler development
• CMOS VLSI: smaller systems, fewer components
– Higher volumes– Lower margins by class of computer, due to fewer services
• Function :Rise of networking/local interconnection technology

10
Growth in Microprocessor Performance
11
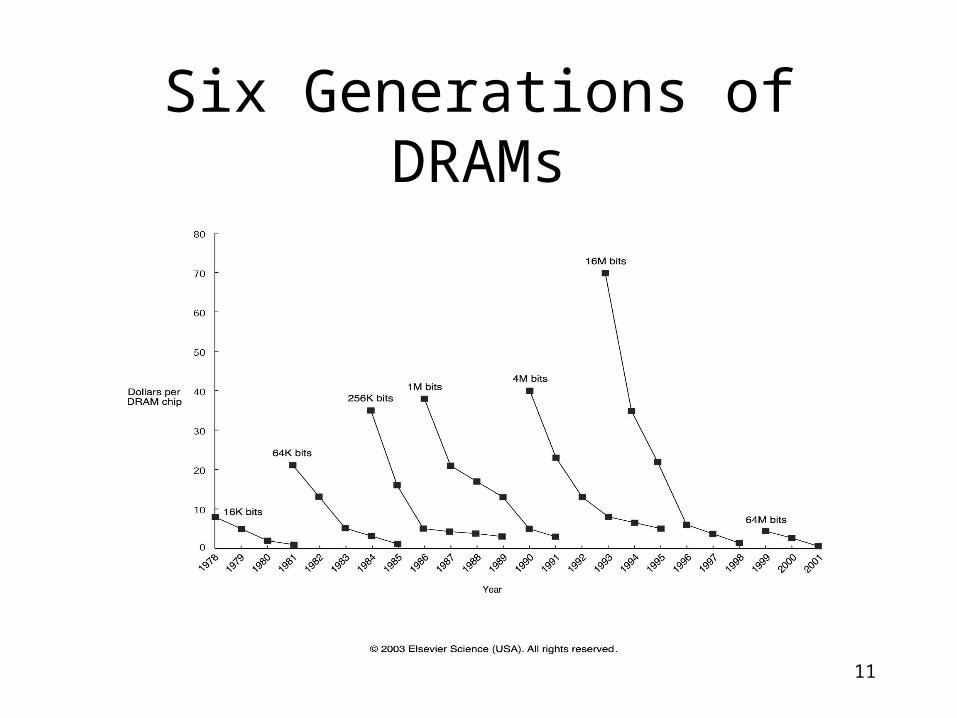
Six Generations of DRAMs

12
Updated Technology Trends(Summary)
Capacity Speed (latency)
Logic 4x in 4 years 2x in 3 years
DRAM 4x in 3 years 2x in 10 years
Disk 4x in 2 years 2x in 10 years
Network (bandwidth) 10x in 5 years
• Updates during your study period??
BS (4 yrs)
MS (2 yrs)
PhD (5 yrs)

1312
Cost of Microprocessors
14
DAP.S98 1
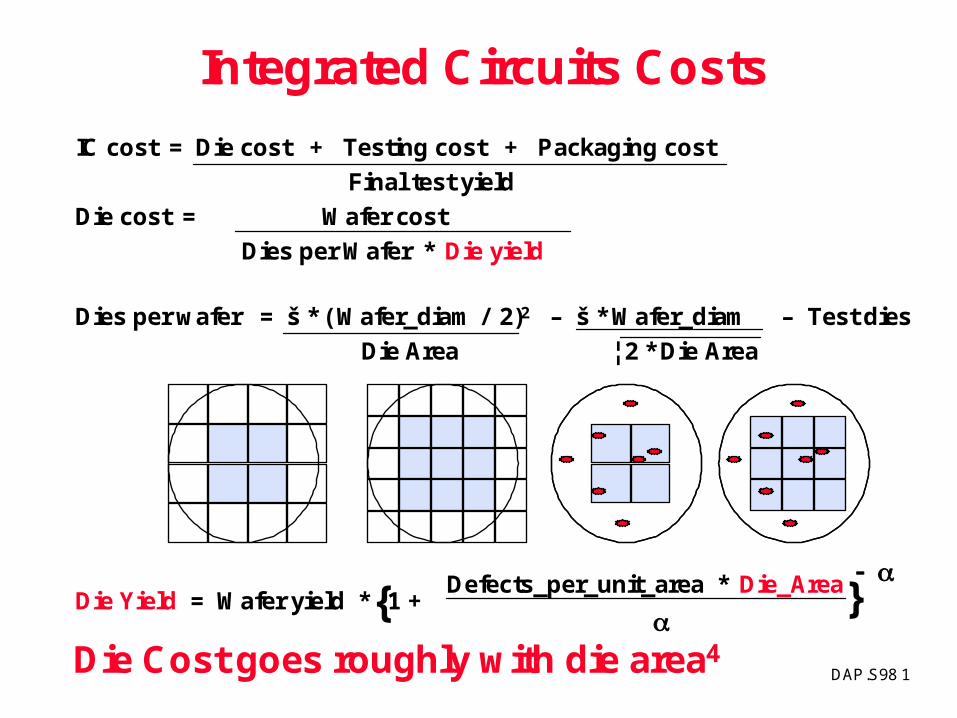
IC cost = Die cost + Testing cost + Packaging cost
Final test yield
Die cost = Wafer cost
Dies per Wafer * Die yield
Dies per wafer = š * ( Wafer_diam / 2)2 – š * Wafer_diam – Test dies
Die Area ¦ 2 * Die Area
Die Yield = Wafer yield * 1 +Defects_per_unit_area * Die_Area
Integrated Circuits Costs
Die Cost goes roughly with die area4
{
}

15
Performance Trends(Summary)
• Workstation performance (measured in Spec Marks) improves roughly 50% per year (2X every 18 months)
• Improvement in cost performance estimated at 70% per year

16
Computer Engineering Methodology
Evaluate ExistingEvaluate ExistingSystems for Systems for BottlenecksBottlenecks
Simulate NewSimulate NewDesigns andDesigns and
OrganizationsOrganizations
Implement NextImplement NextGeneration SystemGeneration System
TechnologyTrends
Benchmarks
Workloads
ImplementationComplexity

17
How to Quantify Performance?
• Time to run the task (ExTime)– Execution time, response time, latency
• Tasks per day, hour, week, sec, ns … (Performance)– Throughput, bandwidth
Plane
Boeing 747
BAD/Sud Concodre
Speed
610 mph
1350 mph
DC to Paris
6.5 hours
3 hours
Passengers
470
132
Throughput (pmph)
286,700
178,200

18
The Bottom Line: Performance and Cost or Cost
and Performance?"X is n times faster than Y" means
ExTime(Y) Performance(X)
--------- = ---------------ExTime(X) Performance(Y)
• Speed of Concorde vs. Boeing 747
• Throughput of Boeing 747 vs. Concorde
• Cost is also an important parameter in the equation which is why concordes are being put to pasture!

19
Measurement Tools
• Benchmarks, Traces, Mixes• Hardware: Cost, delay, area, power estimation• Simulation (many levels)
– ISA, RT, Gate, Circuit
• Queuing Theory• Rules of Thumb• Fundamental “Laws”/Principles• Understanding the limitations of any
measurement tool is crucial.

20
Metrics of Performance
Compiler
Programming Language
Application
DatapathControl
Transistors Wires Pins
ISA
Function Units
(millions) of Instructions per second: MIPS(millions) of (FP) operations per second: MFLOP/s
Cycles per second (clock rate)
Megabytes per second
Answers per monthOperations per second

21
Cases of Benchmark Engineering• The motivation is to tune the system to the benchmark to achieve peak
performance.• At the architecture level
– Specialized instructions
• At the compiler level (compiler flags)– Blocking in Spec89 factor of 9 speedup– Incorrect compiler optimizations/reordering.– Would work fine on benchmark but not on other programs
• I/O level– Spec92 spreadsheet program (sp)– Companies noticed that the produced output was always out put to a file (so they stored
the results in a memory buffer) and then expunged at the end (which was not measured).– One company eliminated the I/O all together.
22
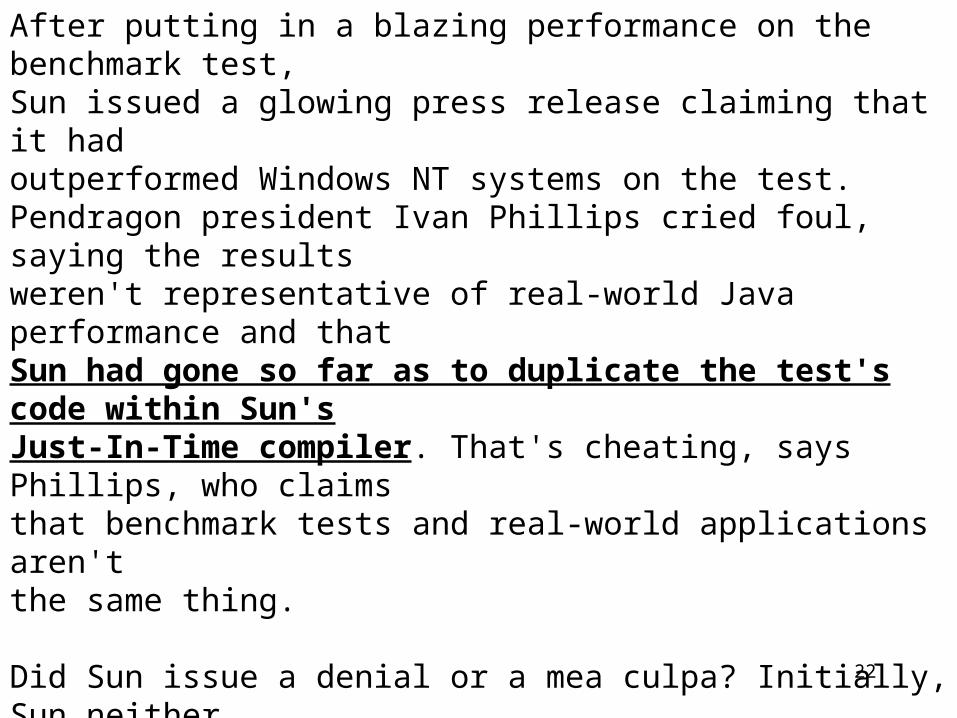
After putting in a blazing performance on the benchmark test, Sun issued a glowing press release claiming that it hadoutperformed Windows NT systems on the test. Pendragon president Ivan Phillips cried foul, saying the resultsweren't representative of real-world Java performance and that Sun had gone so far as to duplicate the test's code within Sun'sJust-In-Time compiler. That's cheating, says Phillips, who claims that benchmark tests and real-world applications aren'tthe same thing.
Did Sun issue a denial or a mea culpa? Initially, Sun neither denied optimizing for the benchmark test nor apologized forit. "If the test results are not representative of real-world Java applications, then that's a problem with the benchmark,"Sun's Brian Croll said.
After taking a beating in the press, though, Sun retreated and issued an apology for the optimization.[Excerpted from PC Online 1997]

23
Issues with Benchmark Engineering
• Motivated by the bottom dollar, good performance on classic suites more customers, better sales.
• Benchmark Engineering Limits the longevity of benchmark suites
• Technology and Applications Limits the longevity of benchmark suites.

24
SPEC: System Performance Evaluation Cooperative
• First Round 1989– 10 programs yielding a single number (“SPECmarks”)
• Second Round 1992– SPECInt92 (6 integer programs) and SPECfp92 (14 floating point
programs)• Compiler Flags unlimited. March 93 • new set of programs: SPECint95 (8 integer programs) and SPECfp95 (10
floating point)
– “benchmarks useful for 3 years”– Single flag setting for all programs: SPECint_base95,
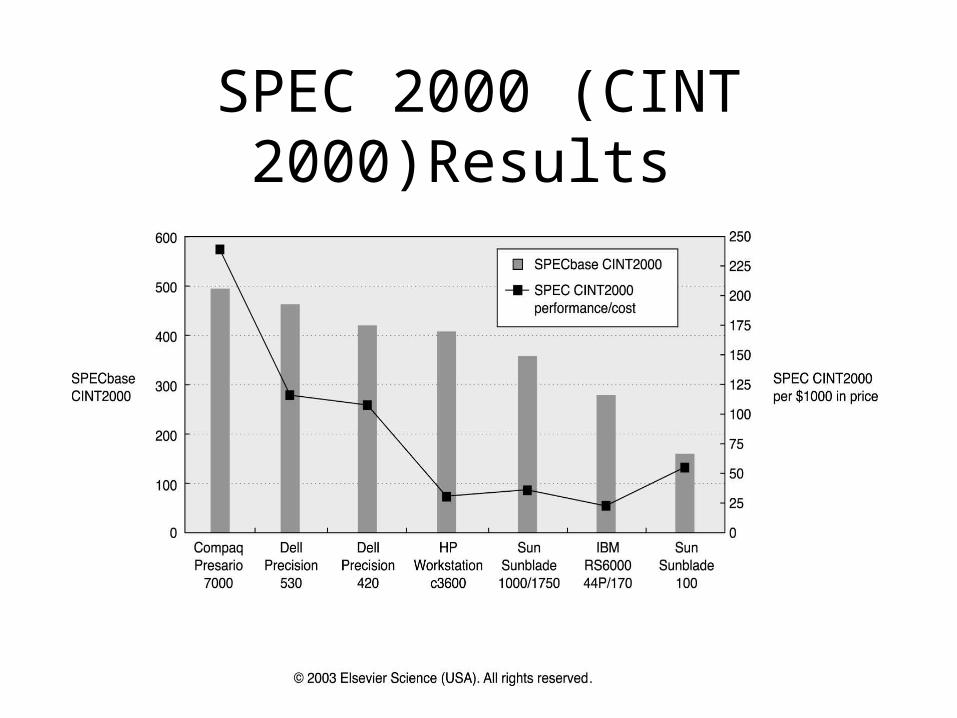
SPECfp_base95 – SPEC CPU2000 (11 integer benchmarks – CINT2000, and 14
floating-point benchmarks – CFP2000
25
SPEC 2000 (CINT 2000)Results

26
SPEC 2000 (CFP 2000)Results

27
Reporting Performance Results
• Reproducability Apply them on publicly available
benchmarks. Pecking/Picking order– Real Programs– Real Kernels– Toy Benchmarks– Synthetic Benchmarks

28
How to Summarize Performance
• Arithmetic mean (weighted arithmetic mean) tracks execution time: sum(Ti)/n or sum(Wi*Ti)
• Harmonic mean (weighted harmonic mean) of rates (e.g., MFLOPS) tracks execution time: n/sum(1/Ri) or 1/sum(Wi/Ri)
• Normalized execution time is handy for scaling performance (e.g., X times faster than SPARCstation 10)
• But do not take the arithmetic mean of normalized execution time, use the geometric mean = (Product(Ri)^1/n)

29
Performance Evaluation• “For better or worse, benchmarks shape a field”• Good products created when have:
– Good benchmarks– Good ways to summarize performance
• Given sales is a function in part of performance relative to competition, investment in improving product as reported by performance summary
• If benchmarks/summary inadequate, then choose between improving product for real programs vs. improving product to get more sales;Sales almost always wins!
• Execution time is the measure of computer performance!

30
Simulations
• When are simulations useful?
• What are its limitations, I.e. what real world phenomenon does it not account for?
• The larger the simulation trace, the less tractable the post-processing analysis.

31
Queueing Theory
• What are the distributions of arrival rates and values for other parameters?
• Are they realistic?
• What happens when the parameters or distributions are changed?

32
Quantitative Principles of Computer Design
• Make the Common Case Fast– Amdahl’s Law
• CPU Performance Equation– Clock cycle time– CPI– Instruction Count
• Principles of Locality• Take advantage of Parallelism

33
DAP.S98 32
Amdahl's LawSpeedup due to enhancement E:
ExTime w/o E Performance w/ E
Speedup(E) = ------------- = -------------------
ExTime w/ E Performance w/o E
Suppose that enhancement E accelerates a fraction F of the task by a factor S, and the remainder of the task is unaffected

34
Amdahl’s Law
ExTimenew = ExTimeold x (1 - Fractionenhanced) + Fractionenhanced
Speedupoverall =ExTimeold
ExTimenew
Speedupenhanced
=
1
(1 - Fractionenhanced) + Fractionenhanced
Speedupenhanced

35
Amdahl’s Law
• Floating point instructions improved to run 2X; but only 10% of actual instructions are FP
Speedupoverall =
ExTimenew =

36
CPU Performance EquationCPU time = Seconds = Instructions x Cycles x
Seconds
Program Program Instruction Cycle
CPU time = Seconds = Instructions x Cycles x Seconds
Program Program Instruction Cycle
Inst Count CPI Clock RateProgram X
Compiler X (X)
Inst. Set. X X
Organization X X
Technology X

37
Cycles Per Instruction
CPU time = CycleTime * CPI * Ii = 1
n
i i
CPI = CPI * F where F = I i = 1
n
i i i i
Instruction Count
“Instruction Frequency”
Invest Resources where time is Spent!
CPI = (CPU Time * Clock Rate) / Instruction Count = Cycles / Instruction Count
“Average Cycles per Instruction”
38
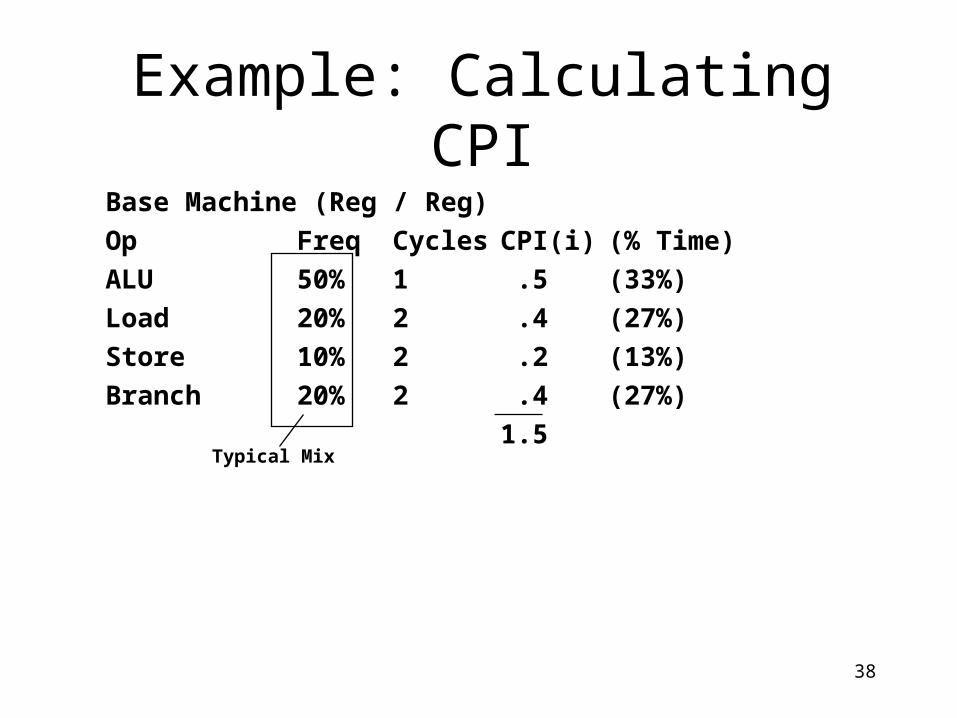
Example: Calculating CPI
Typical Mix
Base Machine (Reg / Reg)
Op Freq Cycles CPI(i) (% Time)
ALU 50% 1 .5 (33%)
Load 20% 2 .4 (27%)
Store 10% 2 .2 (13%)
Branch 20% 2 .4 (27%)
1.5

39
Chapter Summary, #1• Designing to Last through Trends
Capacity Speed
Logic 2x in 3 years 2x in 3 years
DRAM 4x in 3 years 2x in 10 years
Disk 4x in 3 years 2x in 10 years
• 6yrs to graduate => 16X CPU speed, DRAM/Disk size
• Time to run the task– Execution time, response time, latency
• Tasks per day, hour, week, sec, ns, …– Throughput, bandwidth
• “X is n times faster than Y” means ExTime(Y) Performance(X)
--------- = --------------
ExTime(X) Performance(Y)

40
Chapter Summary, #2
• Amdahl’s Law:
• CPI Law:
• Execution time is the REAL measure of computer performance!
• Good products created when have:– Good benchmarks, good ways to summarize performance
• Die Cost goes roughly with die area4
Speedupoverall =ExTimeold
ExTimenew
=
1
(1 - Fractionenhanced) + Fractionenhanced
Speedupenhanced
CPU time = Seconds = Instructions x Cycles x Seconds
Program Program Instruction Cycle
CPU time = Seconds = Instructions x Cycles x Seconds
Program Program Instruction Cycle

41
Food for thought
• Two companies reports results on two benchmarks one on a Fortran benchmark suite and the other on a C++ benchmark suite.
• Company A’s product outperforms Company B’s on the Fortran suite, the reverse holds true for the C++ suite. Assume the performance differences are similar in both cases.
• Do you have enough information to compare the two products. What information will you need?
42
Food for Thought II• In the CISC vs. RISC debate a key argument of the
RISC movement was that because of its simplicity, RISC would always remain ahead.
• If there were enough transistors to implement a CISC on chip, then those same transistors could implement a pipelined RISC
• If there was enough to allow for a pipelined CISC there would be enough to have an on-chip cache for RISC. And so on.
• After 20 years of this debate what do you think?• Hint: Think of commercial PC’s, Moore’s law and
some of the data in the first chapter of the book (and on these slides)

43
Amdahl’s Law (answer)
• Floating point instructions improved to run 2X; but only 10% of actual instructions are FP
Speedupoverall = 1
0.95= 1.053
ExTimenew = ExTimeold x (0.9 + .1/2) = 0.95 x ExTimeold