1-cif)/ 4 bharatiya vidya bhavan's sardar patel …
TRANSCRIPT

2 (a)
(c)
1-Cif)/ 4
BHARATIYA VIDYA BHAVAN'S SARDAR PATEL COLLEGE OF ENGINEERING
(A Government Aided Autonomous Institute) Munshi Nagar, Andheri (West), Mumbai — 400058.
End Semester Examination May 2016
Maximum Marks: 100 Q. P. Code:
Class: S.Y. B. Tech. (Mechanical)
Program: B. Tech. (Mechanical Engineering)
Name of the Course: Mechanical Engineering Measurements
Course Code: BTM404
Instructions: 1. Attempt any live questions.
2. Draw neat diagrams wherever necessary.
3. Assume suitable data if necessary. Q. No.
1.(a)
(b)
1
2 (b)
A Mcleod gauge has volume of bulb and measuring capillary equal to 5
110x10-6 m3 and measuring capillary diameter of 1.1 mm.
r ) Calculate the pressure indicated when the reading of measuring capillary is 28 mm in case approximate formula is used.
(ii) What is the error if the exact formula is used for pressure measurement? With neat sketch explain working of eddy current drag-cup tachometer 05
10 21 A system is given by differential equation
d2y +4—
dy+8y = 8x
d 2 t dt
where y--output and x=input. Determine transfer function, undamped natural frequency, damped frequency, damping ratio, peak time, setteling time, rise time, maximum peak overshoot for unit step input. Explain generalized measurement system with neat schematic diagram. Further map the different constituents of generalized measurement system with the physical elements of peizo-electric accelerometer. The discharge coefficient Cd of an orifice can be found by collecting the water that flows through during a time interval when it is under a constant
head h. The formula is
Cd = tpAV2gh
Find Cd and its possible error if: W=390±0.25 kg, t=600±2 s, d=12±0.03
mm, p=1050±0.1% kg/m3; nd2/4, h=3.6±0.03 m, =9.81±0.1% m/s2
Duration: 3 Hrs
Semester: IV
oks e •
Max. CO Mod Mark No. ule
No
10
05
10
2
3
Page 1 of 3

3 (a) I With neat sketches explain the following terms with respect to the measurement system: (i) Accuracy (ii) Hysteresis (iii) Resolution (iv) Span and Range (v) Drift (vi) Dead zone (vii) Precision
07
(b) What are "Desired", "Modifying", and "Interfering" inputs for an instrumentation system? Draw block diagram for showing their influence on the output.
08 2
(c) With neat sketch explain working of thermal conductivity gauge 05 3 4 (a) Following table list the measuring instruments (left hand side column of the
table) for measuring mechanical properties (right hand side column of the table) of the system. Students shall match the measuring instrument with the corresponding mechanical property.
04
12
3
5, 6, 7
Measuring Instruments Properties , Radiation pyrometer Temperature Pirani gauge Liquid Level Rotameter Pressure Float Gauges Flow rate
Further student shall explain only the working principle of the measurement instrument listed on left hand side column of the table with neat sketch.
(b) A bubbler or purge method is used to measure the water level. Air compressor having pressure range of 0-5 bar is used for the measurement of the water level. Air tube with opening at the bottom of the tank is used to purge the air in the water tank. Operator initially purge the 3 bar pressure in the air tube and no air bubbles are observed. The pressure is varied to maximum rating of 5 bar although no air bubble is observed. In fact at the setting of 5 bar pressure the water rises into the air tube up to 5 meters measured from bottom of the tank. Estimate the water level in the tank from the different observations provided.
04
3
7
5 (a) Following is the calibration data of a pressure transducer: 10 1 2 gi( Mpa) go (increasing) ( Mpa) go (decreasing) (Mpa)
0 0.25 0.2 10 10.56 10.6
20 21.65 21.75
30 32.21 32.65
40 43.75 43.98
50 52.3 52.73 Find out: (i) The equation for the best-linear fit. (ii) The standard deviation of input qi, output q0, slope and intercept. (ii) qi if the instrument reads q0=25.35 after calibration.
(b) A diaphragm pressure gauge is constructed of spring steel to measure differential of 7 MN/m2. The diameter of diaphragm is 12.5 mm. Calculate the thickness of diaphragm, if the maximum deflection is 0.333 of thickness. Also calculate the natural frequency of diaphragm. Given: Young's modulus=200 GN/m2, Poisson's ratio-0.28 and density of steel=7800 k /m3
5 3 5
4
Page 2 of 3
A

(c) While measuring speed of a steam turbine with stroboscope single line images were observed for stroboscope setting of 3000, 4000 and 5250 rpm. Calculate the speed of the turbine.
5
b(a) An orifice meter with orifice diameter 15 cm is inserted in a pipe of 30 cm diameter, the pressure difference measured by a mercury oil differential manometer on the two sides of the orifice meter gives a reading of 50 cm mercury. Find the rate of oil of specific gravity 0.9 when the coefficient of discharge of the meter = 0.64.
10 3 7
6 (b) Draw only self explanatory neat sketches of the following measurement 10 3 6, 7, , devices (i) Laser doppler anemometer (ii) Optical pyrometer (iii) LVDT 3
7 With a neat sketch explain working of (i) Ionization gauge (ii) Hot wire 20 3 5, 6, anemometer (iii) Thermocouple (iv) Psychrometer 7
Page 3 of 3

v
J
a.Chi Gx)
p?-1-0 G
Bharatiya Vidya Mayan's
Sardar Patel College of Engineer' (A Government Aided Autonomous Institute)
Munshi Nagar, Andheri (West), Mumbai — 400058. End Semester Exam
May 2016
Max. Marks: 100 marks Class: S.Y.B.Tech. Semester: Fourth (4th) Name of the Course: Mechanical Engineering
Duration: 3 hours Program: Manufacturing Science H
Course Code : BTM 405
(s Ven, le • Instructions: 1.Question No 1 is compulsory. 2.Attempt any four questions out of remaining six questions. 3.Draw neat schematic diagrams wherever is necessary, highlight important points of answer. 4.Assume suitable data if necessary and mention it.
Q. No
Max. Mark
CO No.
Module No.
Q1 A)
Explain different design principles for location purpose of workpiece with neat schematic sketch?
5 M 2 1
B) i)For drilling hole in material like plastic or rubber helix angle (K2) of drill tool flute should be in the range of For drilling hole in cast iron and rubber material with the help of drill tooll and tool2 having different helix angle (Oh 02 ) respectively. Which of the following condition is true for efficient drilling operation; Justify the answer in one/two point-
a) ni< si2 b) 01> 02 ii) Write in brief different type of clearance provided on drill tool? (2M)
5 M 1 4
C) A shell has height (h) of 45 mm and diameter (d) 45 mm, corner radius is 2 mm, thickness is 1 mm, work piece material is medium carbon steel (having yield strength of 3600kg/cm2). Assume radius of punch is equal to thickness, radius of die is twice the thickness, clearance is 1.09 times thickness of stock, value of constant `k' for drawing pressure of material is 0.65, force of friction and blank holder force required is one third of drawing force. Calculate- Blank diameter (with trimming allowance), number of draw passes required and percentage reduction during each pass, Punch and die radius, clearance between them, drawing force, blank holder and frictional force, Press capacity required? (Refer table 1)
10 M 3 7

Table 1 Draw ratio e---- (hid)
No. of reduction passes
% reduction
1St Draw 2nd Draw 3rd draw 4th Draw
0.75 1 .40 0.75-1.5 2 40 25 1.5-3 3 40 25 15
Q2. A)
Explain working principle of strain gauge type 2D grinding dynamometer with the help of neat schematic sketch?
5 M
B) Explain following terms with reference to sheet metal shearing operation along with detailed schematic sketch of punched hole and slug? a)Roll over depth, b) Burnished dimensions and depth, c) Dishing of blank
5 M 3
C) An '1112 CR steel' strip 250 mm wide & 30 mm thick is rolled to 22.2246 mm thickness in one pass. Roll radius is 300 mm and roll rotates at 75 rpm. Calculate the roll forces and power required to run individual rolls and roll mill? Draw necessary sketch of rolling operation and show the different parameters like forces and dimensions on it. Neglect the spreading phenomenon of sheet?(Refer Figure 1 last page)**
10 M 2
Q3. A)
State Necessity of Drill Jig bush element. Write a note on slip type jig bush with necessary schematic sketch?
5 M 1
B) With the help of neat schematic sketch explain in brief the following; i) Feed engagement, ii) Back engagement, iii) undeformed chip thickness, iv) relationship between uncut chip thickness and feed engagement?
5 M 3 2
C) During machining of D3 material using single point cutting tool whose geometry defined in ORS system as: 00 - 14° - 50- 5° - 100 - 80° — 1.5mm. Calculate back rake 73, , side rake yx, front clearance ay, side clearance ax angle of tool. Draw tool geometry in ASA system and ORS system.
10 M 3 4
Q4. A)
Explain different regimes of lubrication with schematic sketch? Explain characteristics of efficient lubricant in metal cutting?
5 M , 2 3
B) Explain 'geometric considerations' and 'spreading' phenomenon in flat rolling process with the help of neat schematic sketch?
5 M 1
C) A seamless tubing (material Mild steel) having outer diameter (0.D) 90 mm is turned orthogonally on lathe with single point cutting tool having rake angle of 25°. Cutting speed is 5 meter/min, feed 0.25 mm/rev, depth of cut 0.6mm, length of continuous chip in one revolution is 141.371, cutting force (Fc) 275 kg, feed force (FT) 90 kg. Draw neat sketch showing force components and chip feature. Calculate- Coefficient of friction, Shear plane angle, and velocity of chip along tool face, chip thickness, shear strain, shear stress, and shear energy?
10 M 3 2

Q5. A)
Enlist different design requirement of tool force dynamometer 4 M 1 3
B) Explain Mechanism of chip formation during machining of Ductile 5 M materials with the help of neat schematic sketch? Also give significance of primary deformation and secondary deformation zone with sketch?
2 2
C) Write short note on tool cutting edge angle (approach angle), its effect on 6 M length to diameter ratio of workpiece and relative magnitude of feed force and passive force with necessary sketch? (4M) Draw neat schematic sketch of single point cutting tool to show different parameters of normal rake system (NRS) with proper nomenclature? (2M)
3 4
D) Write short note on following terms i) Elongation, ii) Yield-point 5 M elongation in a sheet-metal specimen with necessary sketch?
2 7
Q6. A)
Write short note on i) Oyogentc machining, ii) Dry (minimum quantity lubrication) machining along with their specific application?
5M 1
) Explain Tandem rolling mill, Cluster rolling Mills with the help of neat schematic sketch along with their specific application?
5 M
i) Sketch and design punch and die size, ii) punch length and die block size iii) Suggest material selection criteria for punch, iv) press capacity? for manufacturing of hard steel washer having outer diameter 25mm, inner diameter 15 mm, thickness 2.1 mm. Ultimate shear strength of material is 32 kg/mm2. Assume efficiency of press 65%, shrinkage and expansion allowance 0.055 mm, and clearance for hard steel washer material is 4% of stock thickness. Table 2
10 M
Die block thickness (in mm)
Total perimeter of washer to be sheared off (in mm)
15 75 mm 25 75-250 mm 30 For larger perimeter values 'E' Young modulus of elasticity for punch material = 2.1 X 10³ ton/cm2.
Q7. A)
Write short note on different type of die buttons and state their specific product application? Along with their necessary schematic sketch?
5 M
B) With the help of neat schematic sketch explain in brief spring back, spring back factor, spring back estimation. Draw and explain in brief graph of "spring back factor versus fraction of radius of bend to the thickness of blank"?
5 M
C Design and sketch jig plate, jig bush system and other miscellaneous elements for manufacturing of component shown in figure 2. Draw the assembly view of jig plate, jig bush and workpiece component for performing final drilling operation. State probable accuracy of jig plate surfaces and jig bush surfaces to be maintained (geometric tolerance). Also state sequence of machining process (machine tool used, cutting tool used
10 M
1- 3 I-

1 0 02 0.4 06 08 10 12 14
True strain (e)
and accuracy maintained in brief)? Raw material (Mild steel) size 4)200 mm X 42 mm, batch size required is
800 nos. 1 t
0 1—Counter and tap for MS throngli. P4,4507:0.1. Equispaced 6 nos
CS 04)(10. PCD100=0.1. EqUK>pacect 6 nos j:13A (N,
t ill
Ct
*Kt (Meet) dowel hole PCD100nun. tan OS
nos etptcpaced—._
v F1' ure 2.
FIGURE ES t. True stress—true strain various metals. The curves start at a f too steep a slope to be shown in this stress, Y, of the material.
curves in tension at room temperature for mite level of stress: The elastic regions haVC figure, and so each curve starts at the yieI4
19 1 i-A-1
11 1111 ItY10.11
104 Stainless steel
!Brass, 70-30 a
Is reeled
fi650 Stee 11 1 1
Aill70-30 Brass,
4
annealed
1 1 O Steel Stee 40' „..- ..- 1020 Steel _ r 1
000112 CR
1111011 Copper annealed -
11r.
r T 7/2024- 4,r 0 A
1100-0 Al
_ f 6061-0 Al J
I —
ell01111‘ 11004(14 i
Al _ 20
180
160
140
120
'E. 100
80
["4 60
ao
20
1200
1000
800
600
400
200

)06 312-n
Bharatiya Vidya Bhavan's
Sardar Patel College of Engineering (A Government Aided Autonomous Institute)
Munshi Nagar, Andheri (West), Mumbai -400058.
End Semester Examination, May 2016
S.Y.B.Tech., Sem-IV
B.Tech. in Mechanical Engineering
Course: FLUID MECHANICS (BTM 403) Mii-C.Marks: 100 Instructions: • Answer any FIVE from seven questions. • Answers to all sub questions should be grouped together • Make suitable assumption if needed with proper reasoning
• Figures on right in square bracket shows maximum marks for a particular sub-question. • Figure on the extreme right shows course outcome number and module number respectively
as per the syllabus of the course.
Mqs)-er f e -13E—irafion:-3-Flours
1. (A) 'Boundary layer is a natural feature of a flow.' Discuss it. Explain its significance with illustration? Derive Von Karmon Momentum Integral equation for flow over flat plate with zero pressure gradients. List salient features of this approach. (B) Determine the viscous drag torque and power absorbed on one surface of a collar bearing of 0.2 m ID and 0.3 m OD with an oil film thickness of 1 mm and a viscosity of 0.03 Ns/m if it rotates at 500 rpm.
2. (A) What is hydrostatic equation? Derive a generalized hydrostatic equation where fluid body is at an uniform accelerated condition. Provide few examples where such condition exists. (B) Water enters into a two-dimensional, square channel of constant width, h =75.5 mm, with uniform velocity, U. The channel makes a 90° bend that distorts the flow to produce the linear velocity profile shown at the exit, with Vmax = 2V1m. Evaluate Vmm, if U = 7.5 m/s. Use Reynolds transport equation with selection of appropriate control volume. Specify any assumption if made. -u—:
3. (A) What is turbulence? Write about its characteristic features. Characterize turbulent veloCityptofite-A-rid-eRptain folloWing terms in this context:—
a) Law of wall b) Universal velocity profile c) Power law profile
(B) Define metacentre and metacentric height. State the conditions for the stability of floating bodies. Support your answer with sufficient illustration.
[12] 3,6
[08] 1,1
1101 1,2
[101 2,4
[10] 3,5
[10] 1,2
Vmax
4. (A) What is Hagen Poiseulle flow? Derive an equation for velocity profile using first principle and determine expression for following quantities-
a. Maximum and average velocity, b. Volume flow rate c. Wall shear stress
(B) Derive following area-velocity relation for one dimensional compressible flow. Sate the assumption made.
dA dP = dV r i _ m2] A pV 2 L J V L
All variables carries their usual meaning. Interpret the relation for a CD nozzle.
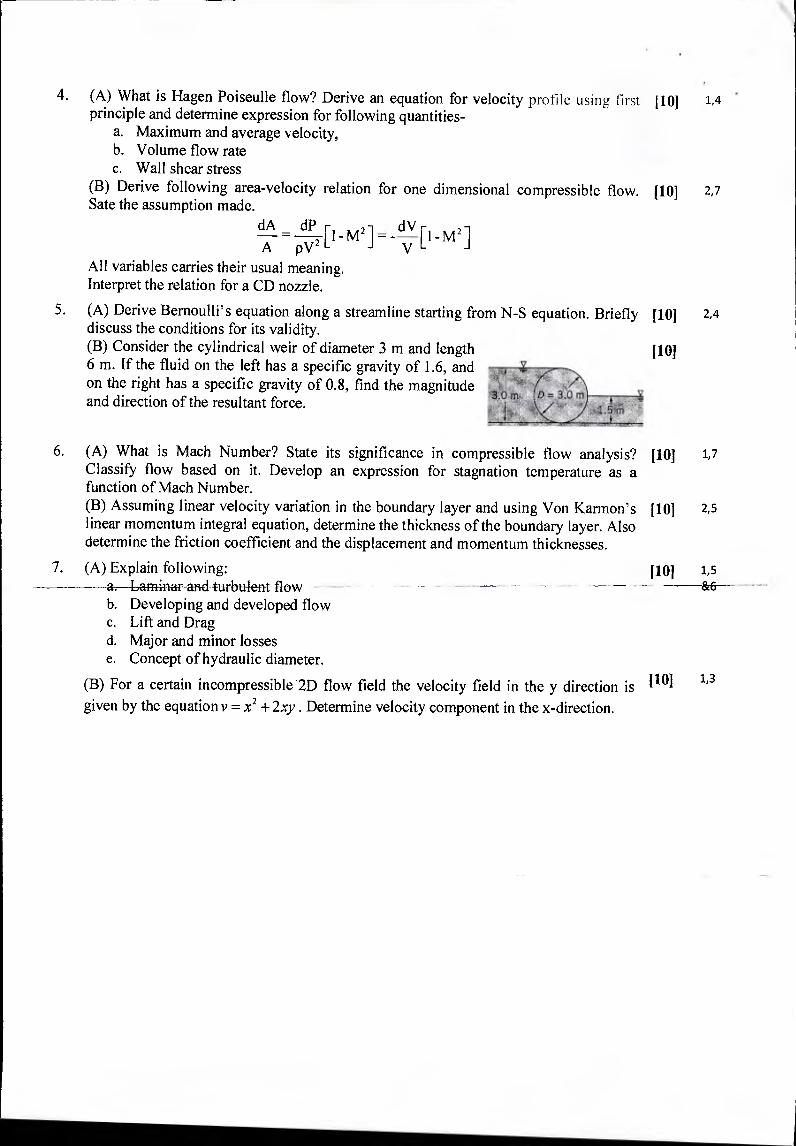
5. (A) Derive Bernoulli's equation along a streamline starting from N-S equation. Briefly discuss the conditions for its validity. (B) Consider the cylindrical weir of diameter 3 m and length 6 m. If the fluid on the left has a specific gravity of 1.6, and on the right has a specific gravity of 0.8, find the magnitude and direction of the resultant force.
6. (A) What is Mach Number? State its significance in compressible flow analysis? Classify flow based on it. Develop an expression for stagnation temperature as a function of Mach Number. (B) Assuming linear velocity variation in the boundary layer and using Von Karmon's linear momentum integral equation, determine the thickness of the boundary layer. Also determine the friction coefficient and the displacement and momentum thicknesses.
7. (A) Explain following: —a,---Laminar and -turbulent flow
b. Developing and developed flow c. Lift and Drag d. Major and minor losses e. Concept of hydraulic diameter.
(B) For a certain incompressible 2D flow field the velocity field in the y direction is given by the equation v = x2 + 2xy. . Determine velocity component in the x-direction.
[10] 1,4
[10] 2,7
[101 2,4
[10]
[10] 1,7
1101 2,5
[101 1,5
[10] 1,3

9—e-1 fl tol Bharatiya Vidya Bhavan's
Sardar Patel College of Engineering (A Government Aided Autonomous Institute)
Munshi Nagar, Andheri (West), Mumbai —400058. End Semester Exam
May 2016
Max. Marks: 50 Class: SY. B. Tech
Semester: IV
Name of the Course: Presentation and communication techniques
Duration: 02 Hours Program: Mech/Elect
Course code : BTM406, : BTE232
Instruction: Candidates should read carefully the instructions printed on the question paper and on the cover of the Answer Book, which is for their use.
1) Question No. 1 is compulsory.
2) Out of remaining questions, attempt any 4
3) In all 5 questions to be attempted.
4) Answer to each new question to be started on a fresh page.
5) Figures in brackets on the right hand side indicate full marks. cts )-tr cri e ,
6) Assume suitable data if necessary.
7) Please write answers to the point. Vague answers will not get marks
Ques 1 ' Maxim 1 Course I Mod I
tion 1 m Marks I! Outcome ule
No I ! Number 1 No.
Q1. I Answer any 2 questions out of 4: (10) 1, 2, 5, 4,6,7
A. I Describe types of reports briefly with a flow chart.
i B. Explain the difference between a Boss and a Leader. —
C. What are the advantages and disadvantages of taking telephonic
interview.
D. What are the principles of writing a Resume'
Q2 Imagine you are the sales manager of the Mumbai branch of a 1 (10)
1, 2,5 4
company that manufactures a soft drink. In the last 3 months, sales in Mumbai have increased only by 3 % in spite of it being summer. The managing Director at the company headquarters in Pune has asked you to investigate the causes of poor sales and offer recommendations. Write a letter report taking into consideration consumer reactions, advertising and publicity, corn etition from other companies and cost, health issues
Q.3. Being assertive at a group discussion is good; being aggressive is (03)
3,4, 07

A. bad. Comment. Describe the characteristics required by a candidate to emerge as a leader in the discussion. .
,
B. Your manager has gone abroad to meet a client, and he has assigned you the responsibility of managing the team for the next two months. He has made the announcement to the entire team. Your manager expects the work in India to go on smoothly, and he needs some support with information while he is on tour. There are some critical deadlines during the two months when he is away. However, your team members refuse to cooperate with you and are taking things lightly. How will you handle the situation and ensure that the deadlines are met?
(05) 2, 1 03, 01
Q.4. "Management is doing right things, and leadership is doing the things right". Elaborate the above statement and explain the three styles of leadership along with its advantages and disadvantages.
(10) 01, 03,02,5
06
Q.5. State whether the following statements are true or false: a. A questionnaire is the most effective method of collecting
date b. Feasibility reports give information about the progress of a
particular project or scheme c. The book form is preferred for short reports d. The appendix is a list of visual aids and graphics used in the
reports e. The length of an abstract is generally 2 to 5 % of that of the
entire report. f. Teamwork is the concept of people working together
cooperatively with diverse goals. g. A resume is your mouth piece written for a prospective
employer. h. Some people are born in with good manners. i. A business card should be presented to another person at the
beginning of the introduction.
J. Procrastination is one of the time waste of time management
(10)
,
1, 2, 3, 4, 5.
1,2,3 , 4, 5,
Q.6. Imagine that you are the secretary in attendance at the 7th meeting of the management committee of Bombay department stores held on May 25th 2016. Draft the notice and minutes of this meeting assuming the agenda to be as follows:- a. Confirmation of minutes of the previous meeting b. Appointment of sales women c. Proposal for delivery vans d. Complains regarding the quality of dairy products e. Any other matter with the permission of Chairman f. Date for the next meeting
(10) 1,2 02
Q.7. You are required to appear for an interview for the position of management trainee (your preferred specialization) at XYZ Limited. What consideration will you keep in mind before and during the interview?
(10) 4, 5 07

i
f .0 QJI-JA-7
Bharatiya Vidya Bhavan's
Sardar Patel College of Engineering (A Government Aided Autonomous Institute)
Munshi Nagar, Andheri (West), Mumbai —400058. End Semester Examination
May 2016
Maximum Marks: 100 Class: S.Y.B.Tech Semester: IV
Name of the Course: Applied Mathematics IV
In
Duration: 3 hour Program: Mechanical Engineering
Course Code : BTM401
r1c131-0, çf .
• Attempt any FIVE questions out of SEVEN questions.
• Answers to all sub questions should be grouped together.
' Q 1(a) The regression lines of a sample are x+ 6y = 6,
Find x,y and r.
(b)
A tightly stretched string of length 1 and fixed at both ends is
8 3 6
plucked at x = — and assumes initially the shape of a triangle 2
of height h. Find the displacement y (x, t) after the string is
released from rest
6 1
X 1 8 112 16
P(X) 1 1/ y 1 y / 6
4 12
Find Fourier series of the functions f (x) = x, — 2 <x <2 6
(c) A manufacturer produces medicine bottles of which 2% are 8 1 3
defective. The . bottles are packed in boxes containing 300 bottles. A drug manufacturer buys 1000 boxes. Using Poisson 1 distribution find how many will contain (i) two defective
bottles (ii) at least two defective bottles.
Marks CO Module 1
3x+ 2y =10. 6 1 1
(c)
2 (a)
(b)
In a random sample of size 500, the mean is found to be 20. In 6 1 4
another independent sample of size 400, the mean is 15. Could the sample have been drawn from the same population with
S.D =4?
If the mean of the following probability distribution is 16, find
m, n & variance 120 1 24
2 5
2
1

6
2
8 1 2
5
Calculate the correlation coefficient between x and y from the
following data n .io , Ex=140 ,E y =150 ,
E (x-10)2 =180, 1(y-15)2 = 215,
(x-10)(y-15)= 60.
Obtain complex form of Fourier series for
f (x)= , x E (-3,3)
Let X be a continuous random variable with probability -3x ce , x > 0
density function f (x) = 0 x 0
Find (i) c (ii) P (1 X 2) (iii) mean (iv) variance
4 (a) Obtain Half Range Fourier Cosine Series for the function
kx, 0 < x < — 2
1 k(1—x),
2
(b) Two independent samples from normal population with equal variance gave the following results
Sample Size Mean S.D
1 16 23.4 2.5
12 24.9 1 2.8
Is the difference between the mean significant? . au a2u
Find the solution of the differential equation — = k , at ax
subject to the conditions. (I) u not infinite for t —> cc,
(ii) —au = 0 for x = 0 and x =1, ax
(iii) u lx — x 2 for t = 0, between x = 0 and x = 1,
3 (a) 6
1
1
f (x) =
6
4
(c) 8
3
2

5 (a) The probability that the pen manufactured by a company will
be defective is —1 . If 12 such pens are manufactured, find the
10
probability that (i) exactly two will be defective (ii) at least
two will be defective (iii) none will be defective
6 1 3
(b) Following Table shows the respective heights x and y ( in 6 1 1
inches) of a sample of 10 father and their sons. Calculate rank
correlation coefficients
1 X 65 I 63 1 67 1 64 1 68 62 1 70 66 68 1 71
iI
Y 68 66 1 68 1 65 69 1 66 1 68 65 1 71 1 70
(c) Find Fourier series of the functions f (x) = x cos x, x E 0,27r] 8 2 5
6(a) It is claimed that a random sample of 1000 tyres, with a mean 6 1 4
life of 15629 kms, is drawn from a population of tyres which has a mean life of 15200 kms and a standard deviation of 1248 kms. Test the validity of claim at 5% level of significance
r I sin x, 0._.x g 6 5 2
(b) Express the function .f(x) = as a Fourier 0, x > 71'
Sine Integral
(c) A square plate is bounded by the. lines 8 3 7
x = 0, y = 0,x = 10 and y =10. Its faces are insulated. The
temperature along the upper horizontal edge is given by
u (x,10) = x (10 — x), when 0 < x <10, while other three edges
are kept at zero temperature. Find the steady state temperature
in the plate.
7(a) Obtain all possible solutions of one dimensional heat equation
(b) If the probability that an individual suffers a bad reaction from 6 1
a particular injection is 0.001, determine the probability that out of 2000 individuals (i) exactly three, (ii) more than two
individuals will suffer a bad reaction
3
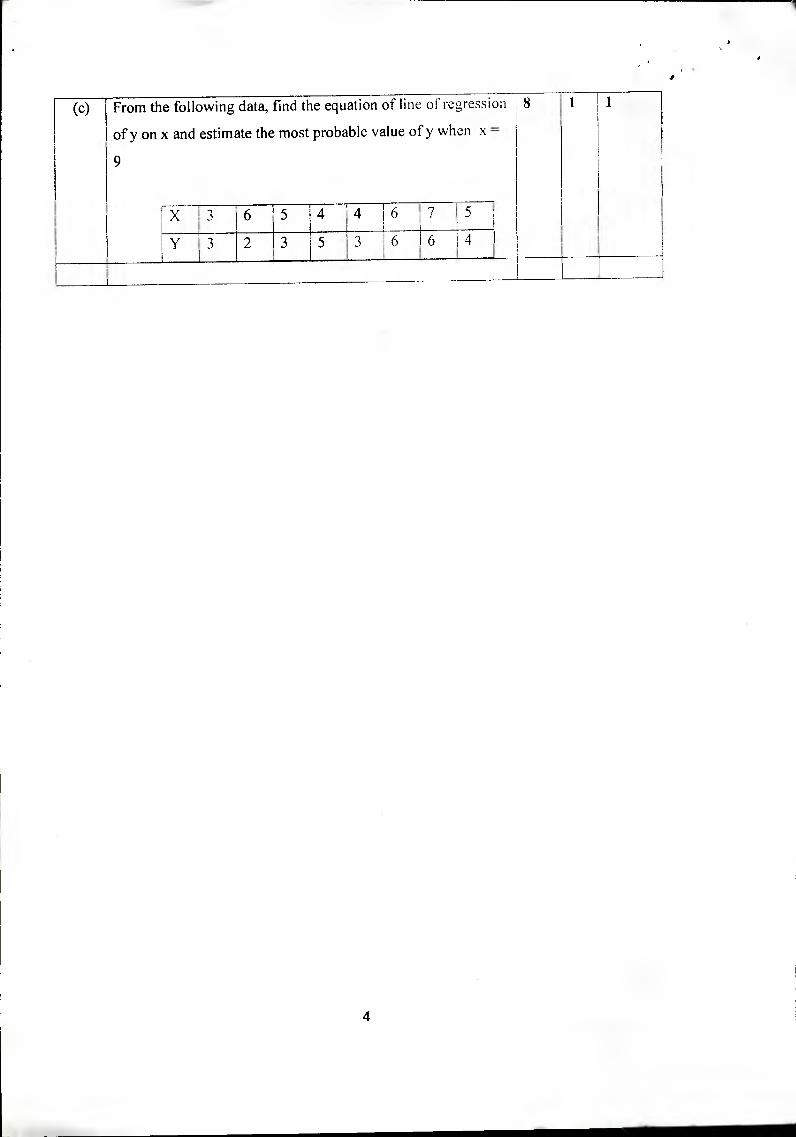
(c) From
of y
9
the following data, find the equation of line of regression
on x and estimate the most probable value of y when x =
81
IX 1
I.) 1
16 1 5 14 I
4 j6 1
7 5
11
1 Y 1 i 3 12
, 3
i II 1 5 3 ,6 4
i
4

Appendix C
Areas under the Standard
Normal Curve from 0 to z
z 0 1 2 3 4 1 i 5 6 7 8 9
0.0 .0000 .0040 .0080 .0120 .0160 .0199 .0239 .0279 .0319 .0359 .0754
0.1 .0398 .0438 .0478 .0517 .0557 .0596 .0636 .0675 .0714 .1141
0.2 .0793 .0832 .0871 .0910 .0948 .0987 .1026 .1064 .1103 .1617
0.3 .1179 .1217 .1255 .1293 .1331 .1368 .1406 .1443 .1480 .1879
0.4 .1554 .1591 .1628 .1664 .1700 .1736 .1772 .1808 .1844
0.5 .1915 .1950 .1985 .2019 .2054 .2088 .2123 .2157 .2190 .2224 .2549
0.6 .2258 .2291 .2324 .2357 .2389 .2422 .2454 .2486 .2518 .2852
0.7 .2580 .2612 .2642 .2673 .2704 .2734 .2764 .2794 .2823 .3133
0.8 .2881 .2910 .2939 .2967 .2996 .3023 .3051 .3078 .3106
0.9 .3159 .3186 .3212 .3238 .3264 .3289 .3315 .3340 .3365 .3389
1.0 .3413 .3438 .3461 .3485 .3508 I .3531 .3554 .3577 .3599 .3621 .3830
1.1 .3643 .3665 .3686 .3708 .3729 .3749 .3770 .3790 .3810 .4015
1.2 .3849 .3869 .3888 .3907 .3925 .3944 .3962 .3980 .3997 .4177
1.3 .4032 .4049 .4066 .4082 .4099 .4115 .4131 .4147 .4162 .4319
1.4 .4192 .4207 .4222 .4236 .4251 .4265 .4279 .4292 .4306
1.5 .4332 .4345 .4357 .4370 .4382 .4394 .4406 .4418 .4429 .4441
1.6 .4452 .4463 .4474 .4484 .4495 .4505 .4515 .4525 .4535 .4545
1.7 .4554 .4564 .4573 .4582 .4591 .4599 .4608 .4616 .4625 .4633
1.8 .4641 .4649 .4656 .4664 .4671 1 .4678 .4686 .4693 .4699 .4706
1.9 .4713 .4719 .4726 .4732 .4738 .4744 .4750 .4756 .4761 .4767
2.0 .4772 .4778 .4783 .4788 .4793 .4798 .4803 .4808 .4812 .4817
2.1 .4821 .4826 .4830 .4834 .4838 .4842 .4846 .4850 .4854 .4857
2.2 .4861 .4864 .4868 .4871 .4875 .4878 .4881 .4884 .4887 .4890
2.3 .4893 .4896 .4898 .4901 .4904 .4906 .4909 .4911 .4913 .4916
2.4 .4918 .4920 .4922 .4925 .4927 .4929 .4931 .4932 .4934 .4936
2.5 .4938 .4940 .4941 .4943 .4945 .4946 .4948 .4949 .4951 .4952
2.6 .4953 .4955 .4956 .4957 .4959 .4960 .4961 .4962 .4963 .4964
2.7 .4966 .4966 .4967 .4968 .4969 .4970 .4971 .4972 .4973 .4974
2.8 .4974 .4975 .4976 .4977 .4977 .4978 .4979 .4979 .4980 .4981
2.9 .4981 .4982 .4982 .4983 .4984 .4984 .4985 .4985 .4986 .4986
3.0 .4987 .4987 .4987 .4988 .4988 .4989 .4989 .4989 .4990 .4990
3.1 .4990 .4991 .4991 .4991 .4992 .4992 .4992 .4992 .4993 .4993
3.2 .4993 .4993 .4994 .4994 .4994 .4994 .4994 .4995 .4995 .4995
3.3 .4995 .4995 .4995 .4996 .4996 j .4996 .4996 .4996 .4996 .4997
3.4 .4997 .4997 .4997 .4997 .4997 .4997 .4997 .4997 .4997 .4998
3.5 .4998 .4998 .4998 .4998 .4998 .4998 .4998 .4998 .4998 .4998
3.6 .4998 .4998 .4999 .4999 .4999 .4999 .4999 .4999 .4999 .4999
3.7 .4999 .4999 .4999 .4999 .4999 .4999 .4999 .4999 .4999 .4999
3.8 .4999 .4999 .4999 .4999 .4999 .4999 .4999 .4999 .4999 .4999
3.9 .5000 .5000 .5000 .5000 .5000 .5000 .5000 .5000 .5000 .5000
345
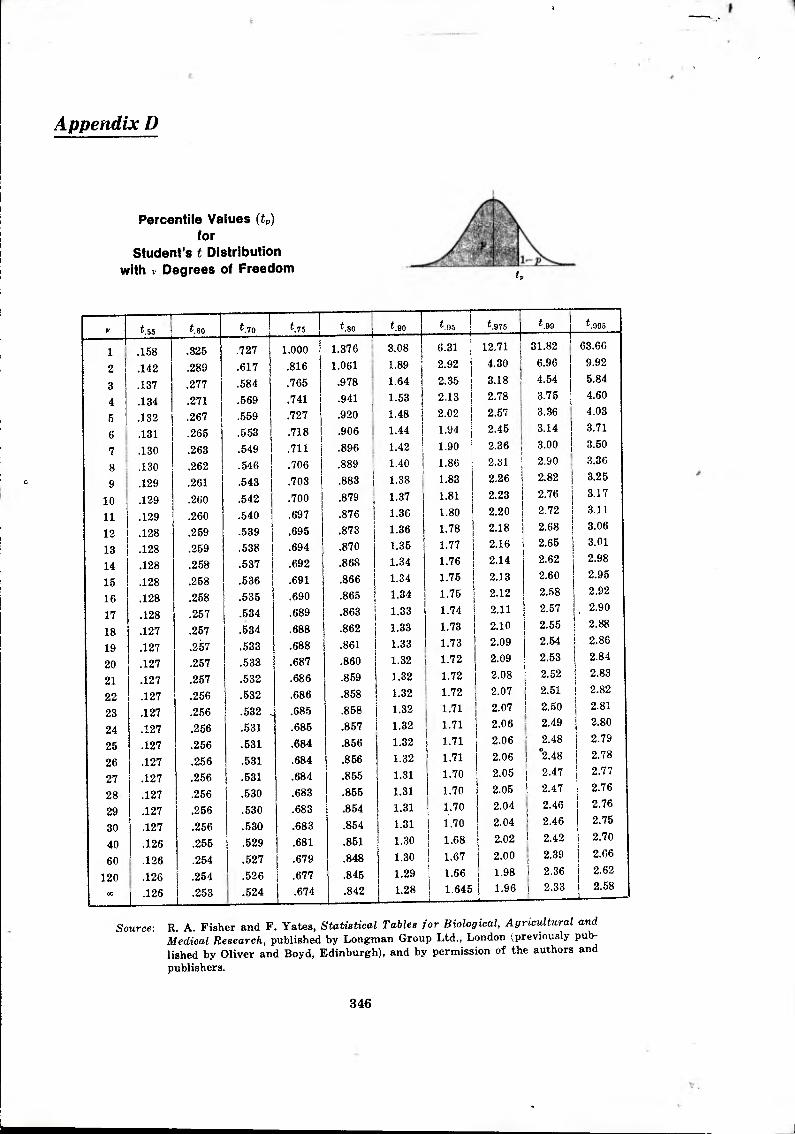
Appendix D
Percentile Values (tp) for
Student's t Distribution with v Degrees of Freedom
I, t.55 t.60 t.70 t.75 t.80 kw) t.95 t.975 ts49 t.995
1 .158 .325 .727 1.000 1.376 3.08 6.31 12.71 31.82 63.66
2 .142 .289 .617 .816 1.061 1.89 2.92 4.30 6.96 9.92
3 .137 .277 .584 .765 .978 1.64 2.35 3.18 4.54 5.84
4 .134 .271 .569 .741 .941 1.63 2.13 j 2.78 3.75 4.60
5 .132 .267 .559 .727 .920 1.48 2.02 2.57 3.36 I 4.03
6 .131 .265 .553 .718 .906 1.44 1.94 2.45 3.14 3.71
7 .130 .263 .549 .711 .896 1.42 1.90 2.36 3.00 3.50
8 .130 .262 .546 .706 .889 1.40 1.86 2.31 2.90 3.36
9 .129 .261 .543 .703 .883 1.38 1.83 j 2.26 2.82 3.25
10 .129 .260 .542 .700 .879 1.37 1.81 2.23 2.76 3.17
11 .129 .260 .540 .697 .876 1.36 1.80 2.20 2.72 3.11
12 .128 .259 .539 .695 .873 1.36 1.78 2.18 2.68 3.06
13 .128 .259 .538 .694 .870 1.35 1.77 2.16 2.65 3.01
14 .128 .258 .537 .692 .868 1.34 1.76 2.14 2.62 2.98
15 .128 .258 .536 .691 .866 1.34 1.76 2.13 2.60 2.95
16 .128 .258 .535 .690 .865 1.34 1.75 2.12 2.58 2.92
17 .128 .257 .534 .689 .863 1.33 1.74 2.11 2.57 , 2.90
18 .127 .257 .534 .688 .862 1.33 1.73 2.10 2.55 2.88
19 .127 .267 .533 .688 .861 1.33 1 1.73 2.09 2.54 2.86
20 .127 .267 .533 .687 .860 1.32 I 1.72 2.09 2.53 2.84
21 .127 .257 .532 .686 .859 1.32 1.72 2.08 2.52 2.83
22 .127 .256 .532 .686 .858 1.32 1.72 2.07 2.51 2.82
23 .127 .256 .532 ... .685 .858 1.32 1.71 2.07 2.50 2.81
24 .127 .256 .531 .685 .857 1.32 1.71 2.06 2.49 2.80
25 .127 .256 .531 .684 .856 1.32 1.71 2.06 2.48 2.79
26 .127 .256 .531 .684 .856 1.32 1.71 2.06 02.48 2.78
27 .127 .256 .531 .684 .855 i 1.31 1.70 2.05 2.47 2.77
28 .127 .266 .530 .683 .855 1.31 1.70 2.05 2.47 2.76
29 .127 .256 .530 .683 .854 1.31 1.70 2.04 2.46 2.76
30 .127 .256 .530 .683 .864 1.31 1.70 2.04 2.46 2.75
40 .126 .255 .529 .681 .851 1.30 1.68 2.02 2.42 2.70
60 .126 .254 .527 .679 .848 1.30 1.67 2.00 2.39 2.66
120 .126 .254 .526 .677 .846 1.29 1.66 1.98 2.36 2.62
.0 .126 .253 .524 .674 .842 1.28 1 1.645 1.96 2.33 2.58
Source: R. A. Fisher and F. Yates, Statistical Tables for Biological, Agricultural and Medical Research, published by Longman Group Ltd., London k previously pub-lished by Oliver and Boyd, Edinburgh), and by permission of the authors and publishers.
346

Appendix E a
Percentile Values () for the
Chi-Square Distribution with r Degrees of Freedom
1 1
P 2 X.005 2 X.01 2 X.020 2 X.00 2 1 2 X.10 X.25 2 X.50 2 X.75 ' 2 X.20 2 X.25 X.275 i 2 X.22 X.225 X.222
c o 1 .0000 .0002 .0010 .0039 .0158 .102 .455 1.32 2.71 3.84 5.02 1 6.63 I 7.88 10.8
2 .0100 .0201 .0606 .103 .211 .575 1.39 2.77 4.61 5.99 7.38 i 9.21 10.6 13.8
3 .0717 .115 .216 I .352 .584 1.21 2.37 4.11 6.25 7.81 9.35 11.3 12.8 16.3
4 .207 .297 .484 .711 1.06 1.92 3.36 5.39 7.78 9.49 11.1 13.3 14.9 ' 18.5
5 .412 .554 .831 1.15 1.61 2.67 4.35 6.63 9.24 11.1 12.8 15.1 16.7 20.5
6 .676 .872 1.24 1.64 2.20 3.45 5.35 7.84 10.6 12.6 14.4 16.8 18.5 . 22.5
7 .989 1.24 1.69 2.17 2.83 4.25 6.35 9.04 12.0 14.1 16.0 18.5 20.3 24.3
8 1.34 1.65 2.18 2.73 3.49 5.07 7.34 10.2 13.4 15.5 17.5 20.1 22.0 26.1
9 1.73 2.09 2.70 3.33 4.17 5.90 8.34 11.4 14.7 16.9 19.0 21.7 23.6 I 27.9
10 2.16 2.56 3.25 3.94 4.87 6.74 9.34 12.5 16.0 18.3 20.5 23.2 25.2 29.6
11 2.60 3.05 3.82 4.57 5.58 7.58 j 10.3 j 13.7 17.3 19.7 21.9 24.7 26.8 31.3
12 3.07 3.57 4.40 5.23 6.30 8.44 11.3 14.8 18.5 21.0 23.3 26.2 28.3 32.9
13 1 3.57 4.11 5.01 5.89 7.04 9.30 12.3 16.0 19.8 22.4 24.7 27.7 29.8 34.5
14 4.07 4.66 5.63 6.57 7.79 10.2 13.3 17.1 21.1 23.7 26.1 29.1 31.3 36.1
15 4.60 5.23 6.26 7.26 8.55 11.0 14.3 I 18.2 22.3 25.0 27.5 30.6 32.8 37.7
16 5.14 5.81 6.91 7.96 9.31 11.9 15.3 19.4 23.5 26.3 28.8 32.0 34.3 39.3
17 5.70 6.41 7.56 8.67 10.1 12.8 16.3 20.5 24.8 27.6 30.2 33.4 35.7 40.8 18 6.26 7.01 8.23 9.39 10.9 13.7 17.3 21.6 26.0 28.9 31.5 34.8 I 37.2 42.3 19 6.84 7.63 8.91 10.1 11.7 14.6 1 18.3 22.7 27.2 1 30.1 32.9 36.2 38.6 43.8 20 7.43 8.26 9.59 10.9 12.4 15.5 19.3 23.8 28.4 31.4 34.2 37.6 40.0 45.3 21 8.03 8.90 10.3 11.6 13.2 16.3 20.3 24.9 29.6 32.7 35.5 38.9 , 41.4 46.8 22 8.64 9.54 11.0 12.3 14.0 17.2 21.3 26.0 30.8 33.9 36.8 40.3 1 42.8 48.3 23 9.26 10.2 11.7 13.1 14.8 18.1 j 22.3 27.1 32.0 35.2 38.1 41.6 , 44.2 49.7 24 9.89 10.9 12.4 13.8 15.7 19.0 23.3 28.2 33.2 36.4 39.4 43.0 I 45.6 51.2 25 10.5 11.5 13.1 14.6 16.5 19.9 24.3 29.3 34.4 37.7 40.6 44.3 46.9 52.6 26 11.2 12.2 13.8 15.4 17.3 20.8 25.3 30.4 I 35.6 38.9 41.9 45.6 48.3 54.1 27 11.8 12.9 14.6 16.2 18.1 I 21.7 26.3 31.5 36.7 40.1 43.2 47.0 49.6 55.5 28 12.5 13.6 15.3 16.9 18.9 1 22.7 27.3 32.6 37.9 41.3 44.5 48.3 51.0 56.9 29 13.1 14.3 16.0 17.7 19.8 23.6 28.3 33.7 39.1 42.6 45.7 49.6 52.3 58.3 30 13.8 15.0 16.8 18.5 20.6 24.5 29.3 34.8 40.3 I 43.8 47.0 50.9 53.7 59.7 40 20.7 22.2 24.4 26.5 29.1 33.7 39.3 45.6 51.8 55.8 59.3 63.7 66.8 73.4 50 28.0 29.7 32.4 34.8 37.7 42.9 49.3 56.3 63.2 67.5 71.4 76.2 79.5 86.7 60 35.5 37.5 40.5 43.2 46.5 52.3 59.3 67.0 74.4 79.1 83.3 88.4 92.0 99.6 70 43.3 45.4 48.8 51.7 55.3 61.7 69.3 77.6 I 85.5 90.5 95.0 100 104 112 80 51.2 53.5 57.2 60.4 64.3 71.1 79.3 88.1 96.6 102 107 112 116 125 90 59.2 61.8 65.6 69.1 73.3 80.6 89.3 , 98.6 108 113 118 124 128 137
100 67.3 70.1 74.2 77.9 82.4 90.1 , 99.3 I 109 , 118 , 124 i 130 136 140 i 149
Source: E. S. Pearson and H. 0. Hartley, Biometrika Tables for Statisticians, Vol. 1 (1966), Table 8, pages 137 and 138, by permission.
347

Appendix F
95th Percentile Values (0.05 Levels), F.951 for the
F Distribution
v, degrees of freedom in numerator
v2 degrees of freedom in denominator F,95
1 2 1 3 4 5 6 17
7 8 1 9 10 12 16 20 24 30 40 i 60 120 op
1 161 200 216 225 230 234 237 239 241 242 244 246 248 249 250 251 252 253 254 2 18.5 19.0 19.2 19.2 19.3 19.3 19.4 19.4 19.4 19.4 19.4 19.4 19.4 19.5 '19.5 19.5 19.5 19.5 19.6 3 10.1 9.55 9.28 9.12 9.01 8.94 8.89 8.85 8.81 8.79 8.74 8.70 8.66 8.64 8.62 8.59 8.57 8.55 8.53 4 7.71 6.94 6.59 6.39 6.26 6.16 6.09 6.04 6.00 5.96 5.91 5.86 5.80 5.77 5.75 5.72 5.69 5.66 5.63 5 6.61 5.79 5.41 5.19 5.05 4.95 4.88 4.82 4.77 4.74 4.68 4.62 4.56 4.53 4.50 4.46 4.43 4.40 4.37 6 5.99 5.14 4.76 4.53 4.39 4.28 4.21 4.15 4.10 4.06 4.00 3.94 3.87 3.84 3.81 3.77 3.74 3.70 3.67 7 5.59 4.74 4.35 4.12 3.97 3.87 3.79 3.73 3.68 3.64 3.57 3.51 3.44 3.41 3.38 3.34 3.30 3.27 3.23 8 5.32 4.46 4.07 13.84 3.69 3.58 3.50 3.44 3.39 3.35 3.28 3.22 3.1513.12 3.08 3.04 3.01 2.97 2.93 9 5.12 4.26 3.86 3.63 3.48 3.37 3.29 3.23 3.18 3.14 3.07 3.01 2.94 2.90 2.86 2.83 2.79 2.75 2.71
10 4.96 4.10 3.71 3.48 3.33 3.22 3.14 3.07 3.02 2.98 2.91 2.85 2.77 2.74 2.70 2.66 2.62 2.58 2.54
11 4.84 3.98 3.59 3.36 3.20 3.09 3.01 2.95 2.90 2.85 2.79 2.72 2.65 2.61 2.57 2.53 2.49 2.45 2.40
12 4.75 3.89 3.49 3.26 3.11 3.00 2.91 2.85 2.80 2.75 2.69 2.62 2.64 2.51 2.47 2.43 2.38 2.34 2.30
13 4.67 3.81 3.41 3.18 3.03 2.92 2.83 2.77 2.71 2.67 2.60 2.53 2.46 2.42 2.38 2.34 2.30 2.25 2.21
14 4.60 3.74 3.34 3.11 2.96 2.85 2.76 2.70 2.65 2.60 2.53 2.46 2.39 2.35 2.31 2.27 2.22 2.18 2.13
15 4.54 3.68 3.29 3.06 2.90 2.79 2.71 2.64 2.59 2.54 2.48 2.40 2.33 2.29 2.25 2.20 2.16 2.11 2.07
16 4.49 3.63 3.24 3.01 2.85 2.74 2.66 2.59 2.54 2.49 2.42 2.35 2.28 2.24 2.19 2.15 2.11 2.06 2.01
17 4.45 3.59 3.20 2.96 2.81 2.70 2.61 2.55 2.49 2.45 12.38 2.31 2.23 2.19 2.15 2.10 2.06 2.01 1.96
18 4.41 3.55 3.16 2.93 2.77 2.66 2.58 2.51 2.46 2.41 2.34 2.27 2.19 2.15 2.11 2.06 2.02 1.97 1.92
19 4.38 3.52 3.13 2.90 2.74 2.63 2.54 2.48 2.42 2.38 2.31 2.23 2.16 2.11 2.07 I 2.03 1.98 1.93 1.88
20 4.36 3.49 3.10 2.87 2.71 260 2.51 2.45 2.39 2.35 2.28 2.20 2.12 2.08 2.04 1.99 1.95 1.90 1.84
21 4.32 3.47 3.07 2.84 2.68 2.57 2.49 2.42 2.37 2.32 2.25 2.18 2.10 2.05 2.01 1.96 1.92 1.87 1.81
22 4.30 3.44 3.05 2.82 2.66 2.55 2.46 2.40 2.34 2.30 2.23 2.15 2.07 2.03 1.98 1.94 1.89 1.84 1.78
23 4.28 3.42 3.03 2.80 2.64 2.53 2.44 2.37 2.32 2.27 2.20 2.13 2.06 2.01 1.96 1.91 1.86 1.81 1.76
24 4.26 8.40 3.01 2.78 2.62 2.51 2.42 2.36 2.30 2.25 2.18 2.11 2.03 1.98 1.94 1.89 1.84 1.79 1.73
25 4.24 3.39 2.99 2.76 2.60 2.49 2.40 2.34 2.28 2,24 2.16 2.09 2.01 1.96 1.92 1.87 1.82 1.77 1.71
26 4.23 3.37 2.98 2.74 2.59 2.47 2.39 2.32 2.27 2.22 2.15 2.07 1.99 1.95 1.90 1.85 1.80 1.76 1.69
27 4.21 3.35 2.96 2.73 2.57 2.46 2.37 2.31 2.25 2.20 2.13 2.06 1.97 1.93 1.38 1.84 1.79 1.73 1.67
28 4.20 3.34 2.95 2.71 2.56 2.45 2.36 2.29 2.24 2.19 2.12 2.04 1.96 1.91 1.87 1.82 1.77 1.71 1.65
29 4.18 3.83 2.93 2.70 2.55 2.43 2.35 2.28 2.22 2.18 2.10 2.03 1.94 1.90 1.85 1.81 1.75 1.70 1.64
30 4.17 3.32 2.92 2.69 2.53 2.42 2.33 2.27 2.21 2.16 2.09 2.01 1.93 1.89 1.84 1.79 1.74 1.68 1.62
40 4.08 3.23 2.84 2.61 2.45 2.34 2.25 2.18 2.12 2.08 2.00 1.92 1.84 1.79 1.74 1.69 1.64 1.58 1.51
60 4.00 3.15 2.76 2.53 2.37 2.25 2.17 2.10 2.04 1.99 1.92 1.84 1.75 1.70 1.65 1.59 1.63 1.47 1.39
120 3.92 3.07 2.68 2.45 2.29 2.18 2.09 2.02 1.96 1.91 1.83 1.76 1.66 1.61 1.55 1.50 1.43 1.35 1.25
3.84 3.00 2.60 2.37 2.21 2.10 2.01 1.94 _. ..
1.88 1.83 1.75 -
1.67 1.57 1.52 1.46 1.39 1.32 1.22 1.00
Source: E. S. Pearson and H. 0. Hartley, Biametrika Tables for Statisticians, Vol. 2 (1972), Table 5, page 178, by permission.
348