1 chapter 10 forecasting the long term: deterministic and stochastic trends figure 10.1 economic...
TRANSCRIPT

1
CHAPTER 10FORECASTING THE LONG TERM:
DETERMINISTIC AND STOCHASTIC TRENDSFigure 10.1 Economic Time Series with Trends
González-Rivera: Forecasting for Economics and Business, Copyright © 2013 Pearson Education, Inc.

2
Figure 10.2 Time Series with Linear Deterministic Trend
González-Rivera: Forecasting for Economics and Business, Copyright © 2013 Pearson Education, Inc.
10.1 Deterministic Trends

3González-Rivera: Forecasting for Economics and Business, Copyright © 2013 Pearson Education, Inc.
Figure 10.3 Common Deterministic Trends
10.1.1 Trend Shapes

4González-Rivera: Forecasting for Economics and Business, Copyright © 2013 Pearson Education, Inc.
Figure 10.4 Growth Rate with Linear and Quadratic Deterministic Trends

González-Rivera: Forecasting for Economics and Business, Copyright © 2013 Pearson Education, Inc.
5
Figure 10.5 Home Mortgage Outstanding Debt (Billions of Dollars)
10.1.3 Optimal Forecasting

6
Table 10.1 Deterministic Trend Specifications
González-Rivera: Forecasting for Economics and Business, Copyright © 2013 Pearson Education, Inc.

González-Rivera: Forecasting for Economics and Business, Copyright © 2013 Pearson Education, Inc.
7
Table 10.2 Least Squares Estimation of a Polynomial Trend
González-Rivera: Forecasting for Economics and Business, Copyright © 2013 Pearson Education, Inc.
8
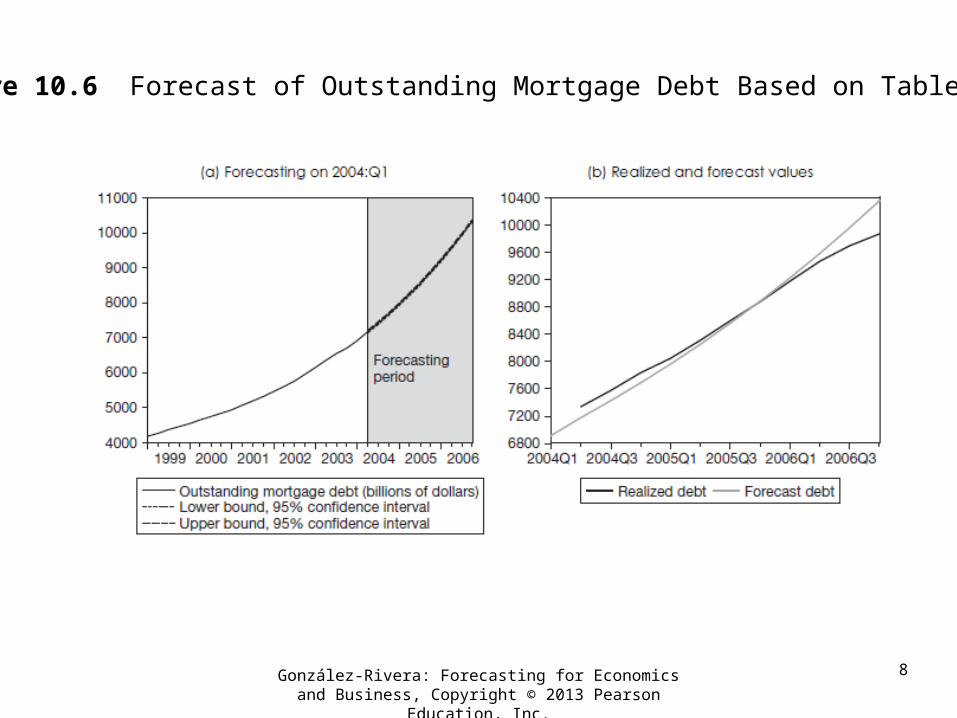
Figure 10.6 Forecast of Outstanding Mortgage Debt Based on Table 10.2

González-Rivera: Forecasting for Economics and Business, Copyright © 2013 Pearson Education, Inc.
9
Figure 10.7 Correlograms of the Residuals of the Fourth Polynomial Trend Model

González-Rivera: Forecasting for Economics and Business, Copyright © 2013 Pearson Education, Inc.
10
Table 10.3 Least Squares Estimation of Trend and AR Model

González-Rivera: Forecasting for Economics and Business, Copyright © 2013 Pearson Education, Inc.
11
Figure 10.8 Random Walk without Drift and with Drift
10.2 Stochastic Trends10.2.1 Trend Shapes

González-Rivera: Forecasting for Economics and Business, Copyright © 2013 Pearson Education, Inc.
12
Figure 10.9 Autocorrelograms of Random Walks10.2.2 Stationarity Properties
González-Rivera: Forecasting for Economics and Business, Copyright © 2013 Pearson Education, Inc.
13
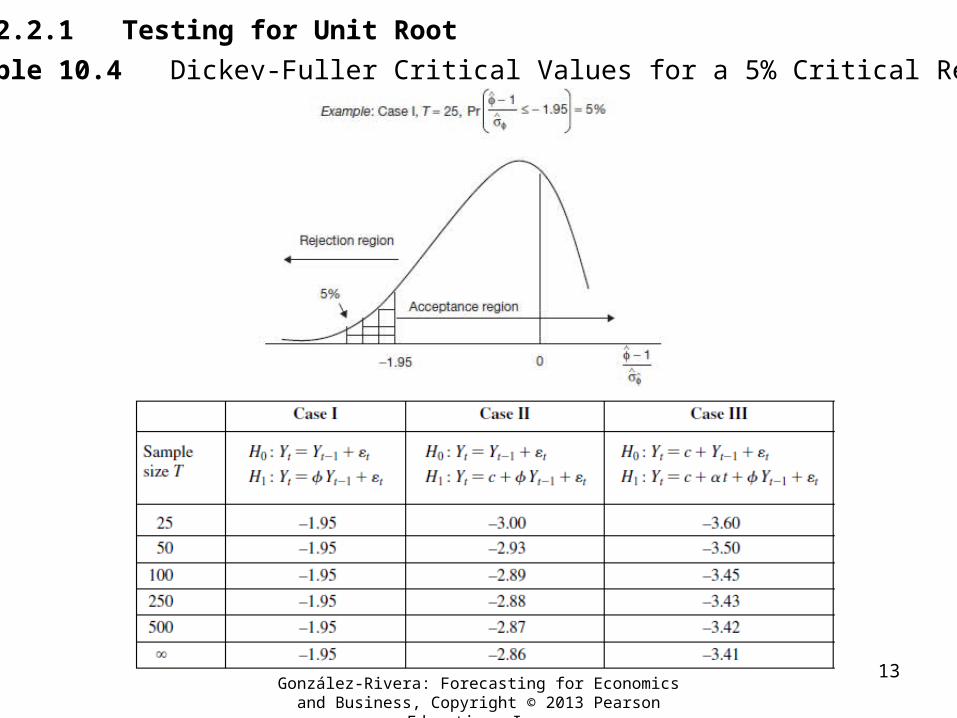
10.2.2.1 Testing for Unit RootTable 10.4 Dickey-Fuller Critical Values for a 5% Critical Region

González-Rivera: Forecasting for Economics and Business, Copyright © 2013 Pearson Education, Inc.
14
Table 10.5 Unit Root Testing Procedure

González-Rivera: Forecasting for Economics and Business, Copyright © 2013 Pearson Education, Inc.
15
Figure 10.10 Differences in the Forecasts of Random Walk and Trend-Stationary Processes
10.2.3 Optimal Forecast

González-Rivera: Forecasting for Economics and Business, Copyright © 2013 Pearson Education, Inc.
16
Figure 10.11 Index of Total Hours Worked in United States and Spain

González-Rivera: Forecasting for Economics and Business, Copyright © 2013 Pearson Education, Inc.
17
Table 10.6 Augmented Dickey-Fuller Unit Root Test on Spain

González-Rivera: Forecasting for Economics and Business, Copyright © 2013 Pearson Education, Inc.
18
Figure 10.12 Correlogram of Residuals

González-Rivera: Forecasting for Economics and Business, Copyright © 2013 Pearson Education, Inc.
19
Table 10.7 Augmented Dickey-Fuller Unit Root Test on Spain

González-Rivera: Forecasting for Economics and Business, Copyright © 2013 Pearson Education, Inc.
20
Table 10.8 Least Squares Estimation of 11 ttt YY

González-Rivera: Forecasting for Economics and Business, Copyright © 2013 Pearson Education, Inc.
21
Table 10.9 Four-Step-Ahead Forecast of Index of Total Hours Worked in Spain

González-Rivera: Forecasting for Economics and Business, Copyright © 2013 Pearson Education, Inc.
22
Figure 10.13 Forecast of Index Total Hours Worked in Spain with 95% Confidence Bands

González-Rivera: Forecasting for Economics and Business, Copyright © 2013 Pearson Education, Inc.
23
Table 10.10 Augmented Dickey-Fuller Unit Root Test on the United States
González-Rivera: Forecasting for Economics and Business, Copyright © 2013 Pearson Education, Inc.
24
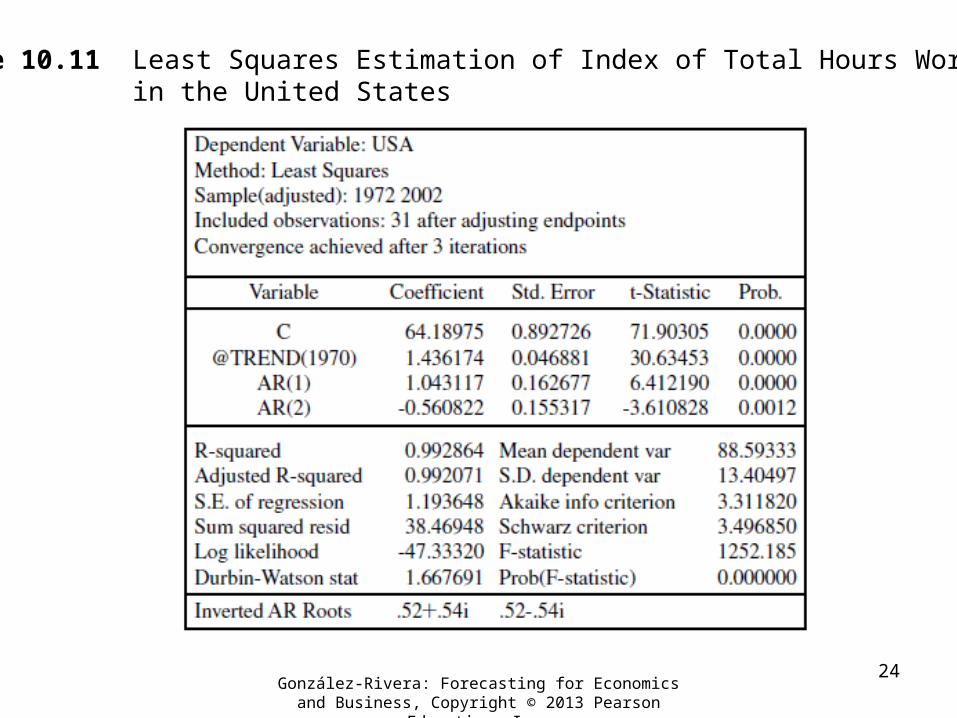
Table 10.11 Least Squares Estimation of Index of Total Hours Worked in the United States