1 catchment areas of airports -...
TRANSCRIPT
1
Area Development Twente
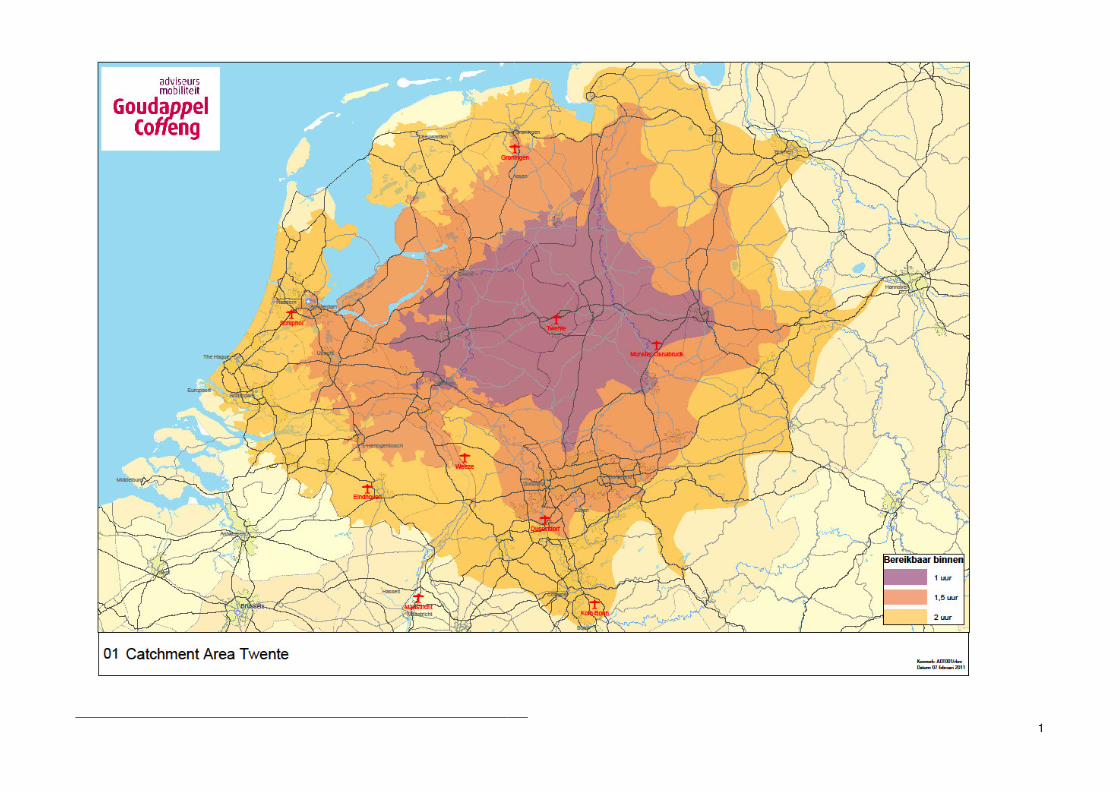
Catchment area of Twente Airport
23 February 2011
ADT001/Hnr/0002
1 Catchment areas of airports
1.1 Background
Area Development Twente is investigating the potential of Twente Airport within the
framework of the business case for the airport. A key measure of airport viability is
the number of people able to get to the airport in a given period of time. This is known
as the airport’s catchment area. Area Development Twente wishes to know how
accessible the location of the airport currently is, and how accessible it will be in 2020
when it will have been partly developed, accommodating 600,000 passengers.
In addition, Area Development Twente wishes to compare the catchment area of
Twente Airport with those of other airports. These include:
■ Twente;
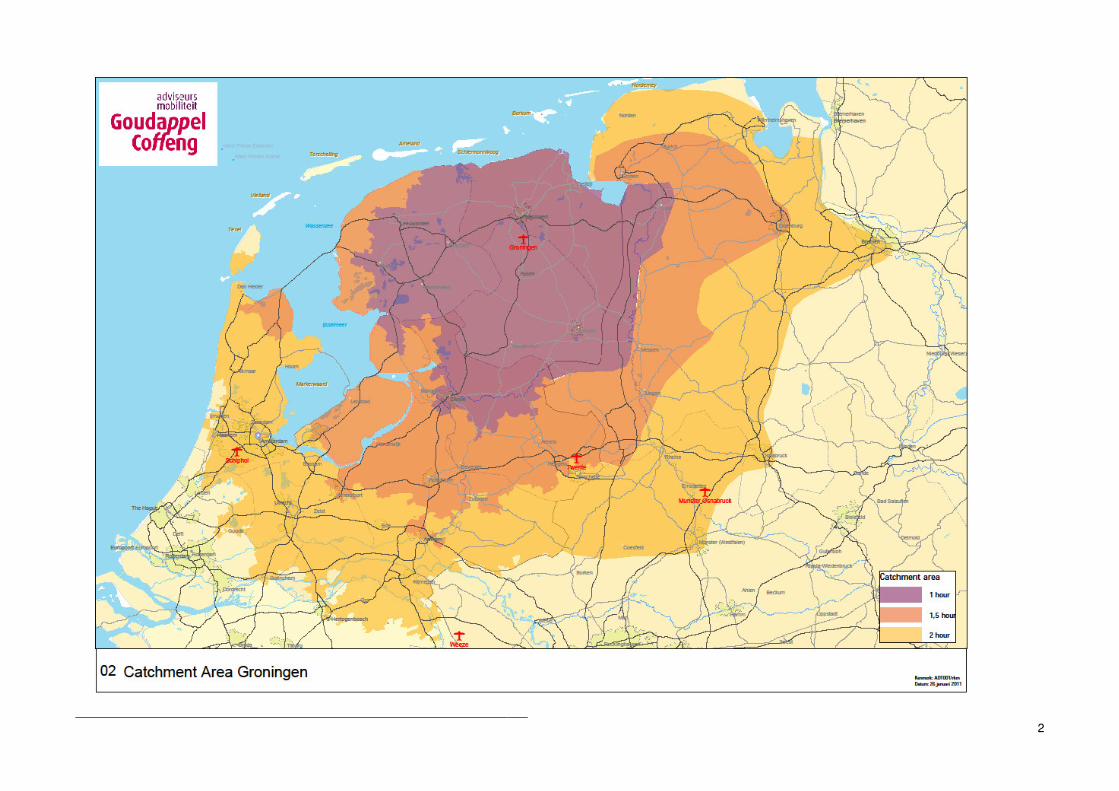
■ Groningen;
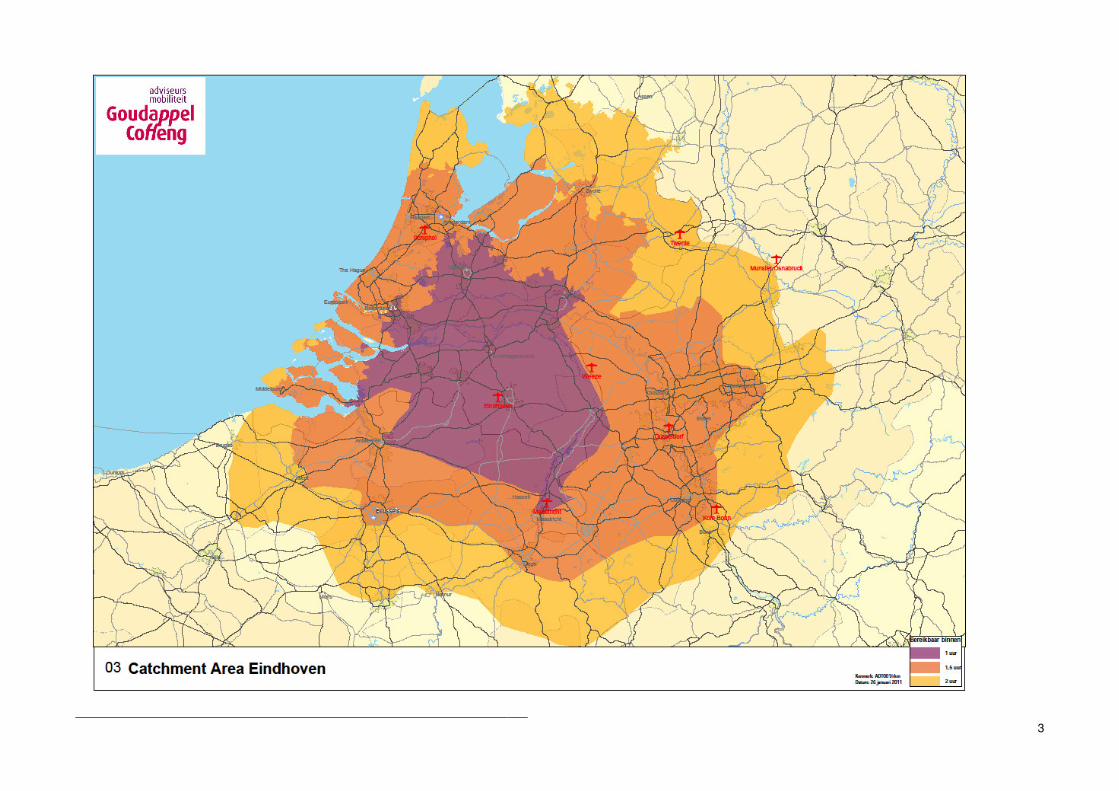
■ Eindhoven;
■ Maastricht;
■ Schiphol;
■ Weeze (Germany);
■ Münster-Osnabrück (Germany);
■ Düsseldorf (Germany);
■ Cologne (Germany).
To answer these questions, the National Model developed by traffic and transport
consultants Goudappel Coffeng has been used (see section 1.2). Because the
catchment areas cross national boundaries, additional data was obtained for
Germany and Belgium (see section 1.3).

2
1.2 The National Model
Goudappel Coffeng has constructed a National Model, a modelling system designed
to perform calculations for the Netherlands and hence ideally suited to this study.
This transport model contains infrastructure data (speeds, number of lanes, road
types) and socio-economic data (population and jobs) for 2008 and 2020. The year
2020 is based on the “Global Economy” national scenario. Using this information, we
can calculate the journey times to the airport from any given area, and the number of
people and jobs located in that area. This is how we establish the size of the
population in the catchment area.
The data from the National Model is less detailed for countries outside the
Netherlands. This is why we obtained additional data for Belgium and Germany in
order to calculate the Belgian and German catchment areas at a similar level of detail.
1.3 Gathering German and Belgian data
We obtained detailed information on residents and jobs for 2008 and 2020 from
Eurostat, the European statistics office.
Data for Belgium was taken from a transport model for the South of the Netherlands
also developed by Goudappel Coffeng. This model uses a detailed division into
zones and shows the production of journeys for each zone (i.e. the number of
journeys to and from each zone). Information on the number of residents and jobs for
2008 and 2020 is only available for the somewhat larger zones, but can simply be
distributed across the smaller zones in proportion to the available journey production
information.
Figure 1.1 makes this clear. It shows the journeys for all small zones, and the total
number of residents and jobs in the red area. If journey production in a small zone
accounts for 10% of journeys in the larger red area, it also accounts for 10% of all
residents and jobs. We applied this method for both 2008 and 2020.
Figure 1.1: Division into zones for Belgium
In cases where the division into zones was still not detailed enough, we defined the
catchment areas by looking at what percentage of each zone was accessible within a
given amount of time.

3
1.4 Calculation of journey times
The catchment area of an airport is based on the number of residents and jobs that
can be accessed from the airport by car within a given period of time. This is not so
much about the accessibility of the airport to office workers (who generally commute
during peak periods) as about the number of passengers, who arrive at and depart
from the airport much more spread out throughout the day. The majority of
passengers are likely to travel outside peak hours and will not therefore have to cope
with daily congestion. This is why journey times have been calculated on the basis of
free-flow speeds. During the rush-hour, catchment areas tend to become smaller in
highly urbanised areas in particular. However, the area around Twente Airport still
sees only limited delays due to congestion.
Journey times between all zones in the Netherlands have been calculated using the
National Transport Model. Because the National Transport Model provides less detail
in terms of the road networks in neighbouring countries, we adopted a different
approach to ensure an even quality of travel times for the Netherlands and abroad.
Using a route planner, we calculated the journey times from the airport to locations
abroad. Next, we determined the number of residents and jobs located in the areas
situated at distances of 1, 1.5 and 2 hours of travel from the airport.
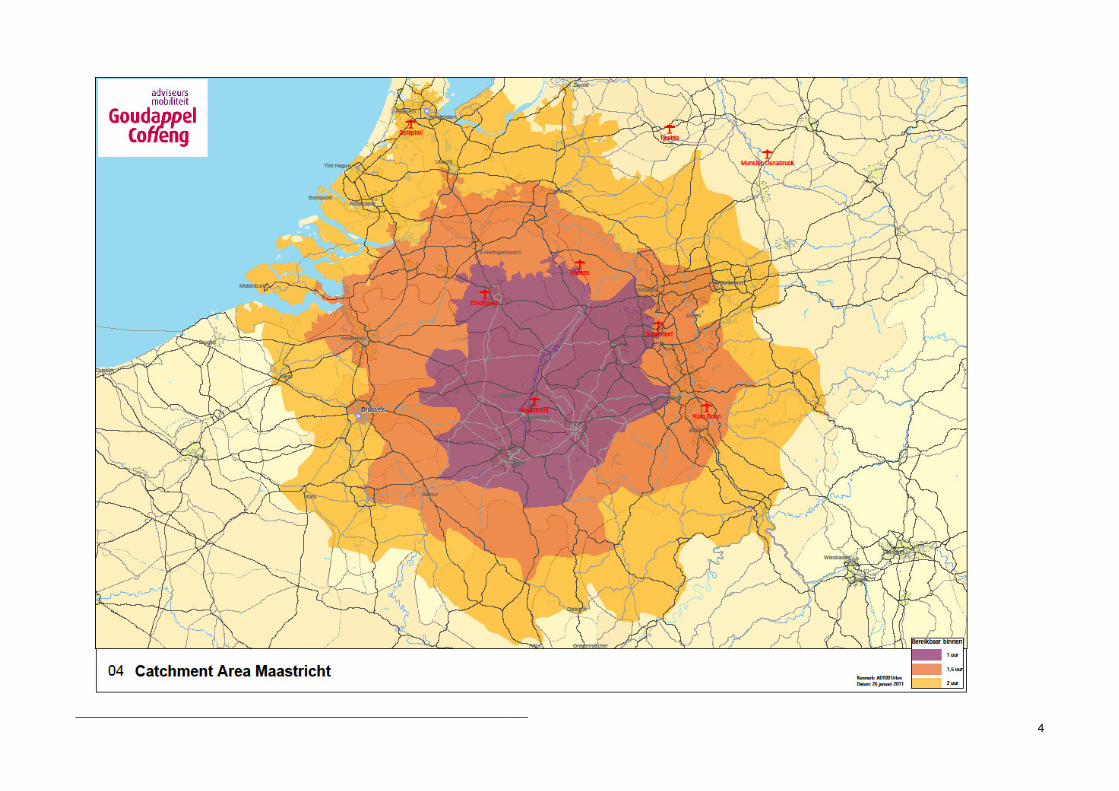
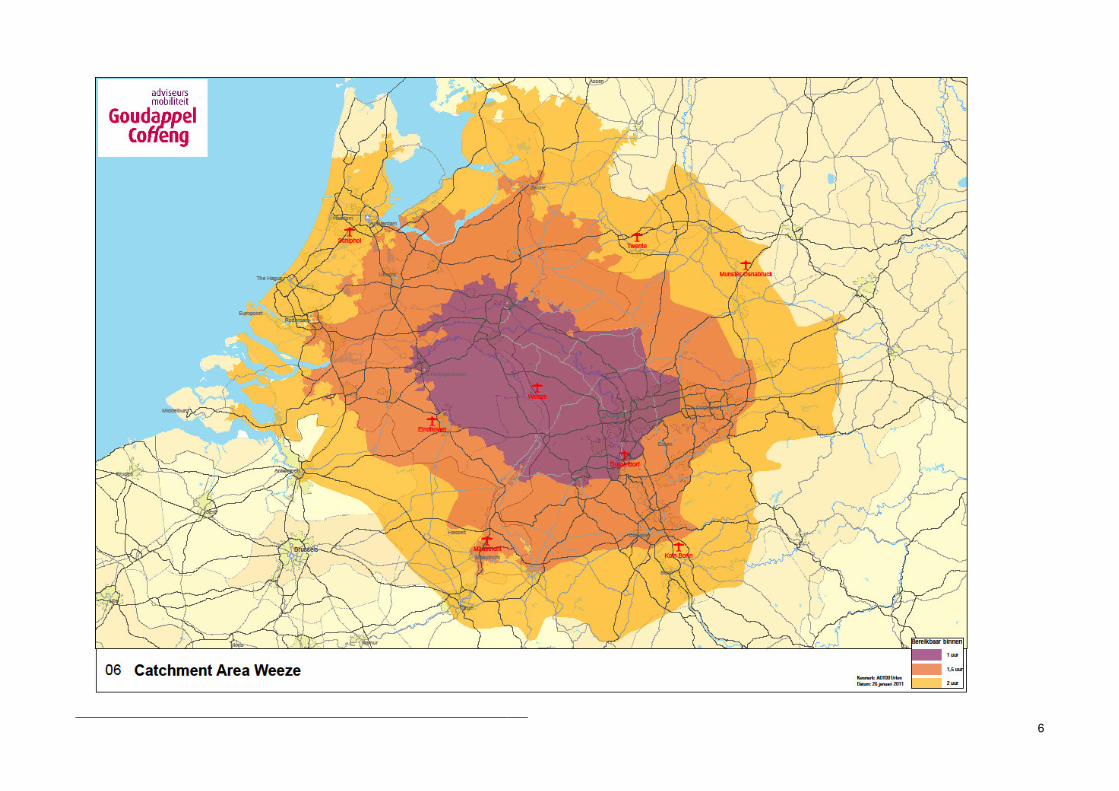
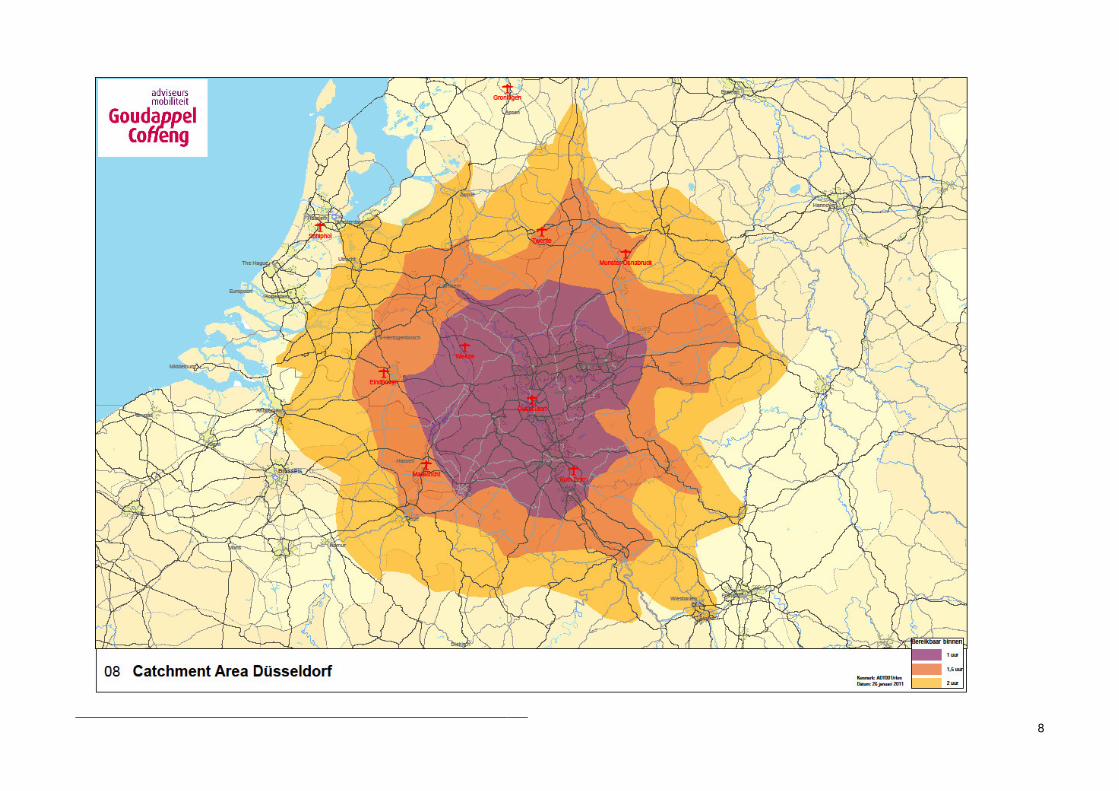
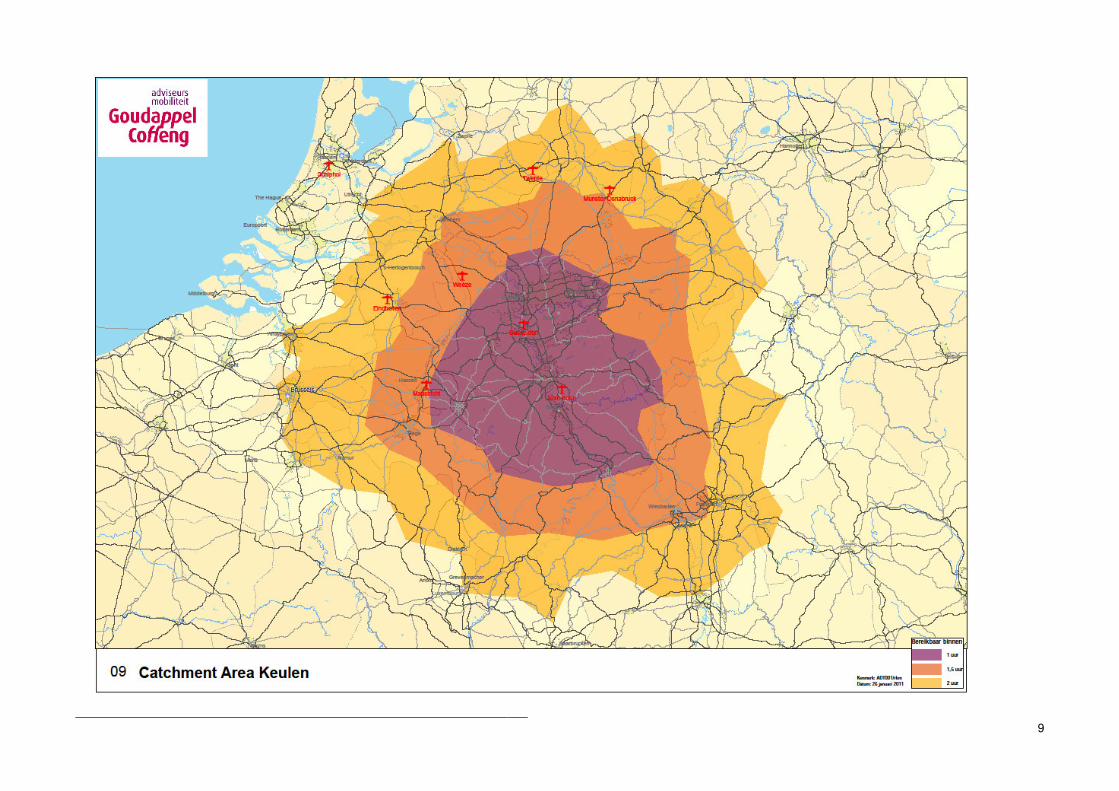
1.5 Catchment areas defined
We have established the number of residents and jobs accessible from the airports
by car at travel distances of 60, 90 and 120 minutes for 2008 and 2020.
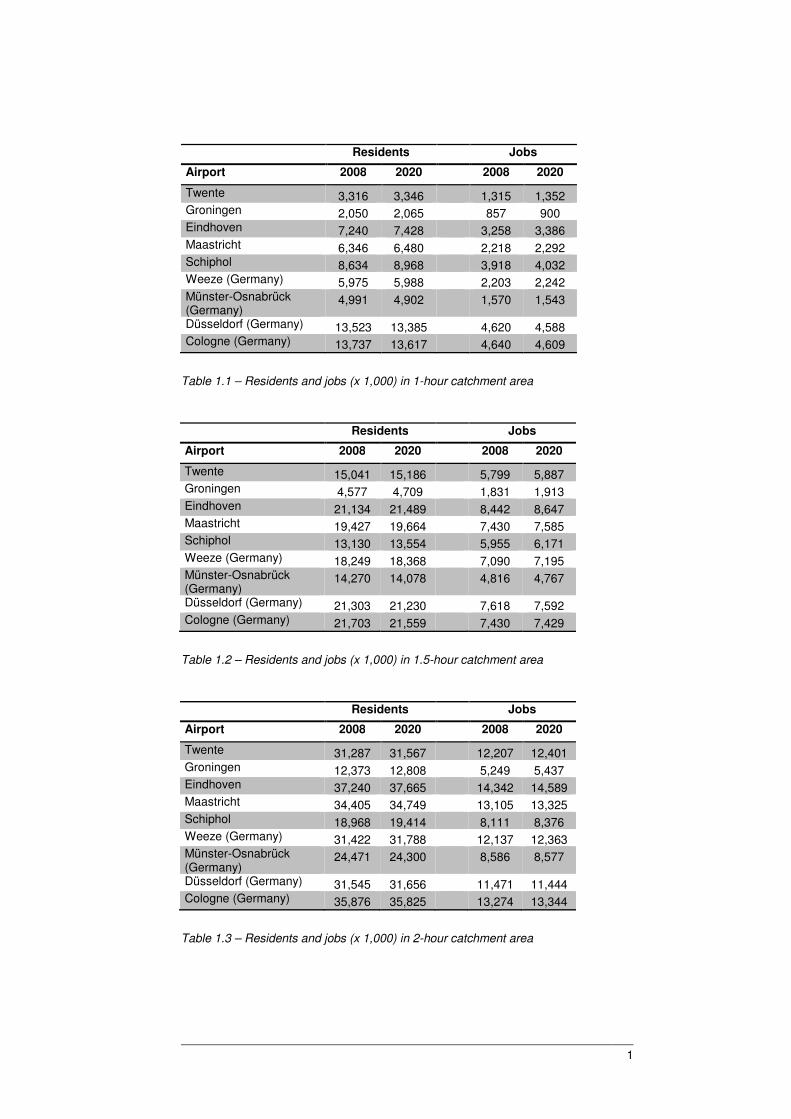
The total number of residents and jobs accessible from the airports are shown in
tables 1.1 to 1.3 (at distances of 1, 1.5 and 2 hours’ travel, respectively). Schedule 1
shows the same data broken down by country of origin (Netherlands, Germany, and
Belgium). Figures 1 to 9 show the catchment areas of each of the airports analysed.
We have also calculated how many residents and jobs are nearer to Twente Airport
than any other airport (in terms of travel time). The results are shown in table 1.4 and
figure 11.
1
Table 1.1 – Residents and jobs (x 1,000) in 1-hour catchment area
Residents Jobs
Airport 2008 2020 2008 2020
Twente 15,041 15,186 5,799 5,887 Groningen 4,577 4,709 1,831 1,913 Eindhoven 21,134 21,489 8,442 8,647 Maastricht 19,427 19,664 7,430 7,585 Schiphol 13,130 13,554 5,955 6,171 Weeze (Germany) 18,249 18,368 7,090 7,195 Münster-Osnabrück (Germany)
14,270 14,078 4,816 4,767
Düsseldorf (Germany) 21,303 21,230 7,618 7,592 Cologne (Germany) 21,703 21,559 7,430 7,429
Table 1.2 – Residents and jobs (x 1,000) in 1.5-hour catchment area
Residents Jobs
Airport 2008 2020 2008 2020
Twente 31,287 31,567 12,207 12,401 Groningen 12,373 12,808 5,249 5,437 Eindhoven 37,240 37,665 14,342 14,589 Maastricht 34,405 34,749 13,105 13,325 Schiphol 18,968 19,414 8,111 8,376 Weeze (Germany) 31,422 31,788 12,137 12,363 Münster-Osnabrück (Germany)
24,471 24,300 8,586 8,577
Düsseldorf (Germany) 31,545 31,656 11,471 11,444 Cologne (Germany) 35,876 35,825 13,274 13,344
Table 1.3 – Residents and jobs (x 1,000) in 2-hour catchment area
Residents Jobs
Airport 2008 2020 2008 2020
Twente 3,316 3,346 1,315 1,352 Groningen 2,050 2,065 857 900 Eindhoven 7,240 7,428 3,258 3,386 Maastricht 6,346 6,480 2,218 2,292 Schiphol 8,634 8,968 3,918 4,032 Weeze (Germany) 5,975 5,988 2,203 2,242 Münster-Osnabrück (Germany)
4,991 4,902 1,570 1,543
Düsseldorf (Germany) 13,523 13,385 4,620 4,588 Cologne (Germany) 13,737 13,617 4,640 4,609
2
Residents Jobs
Airport 2008 2020 2008 2020
Twente 2,094 2,106 858 887
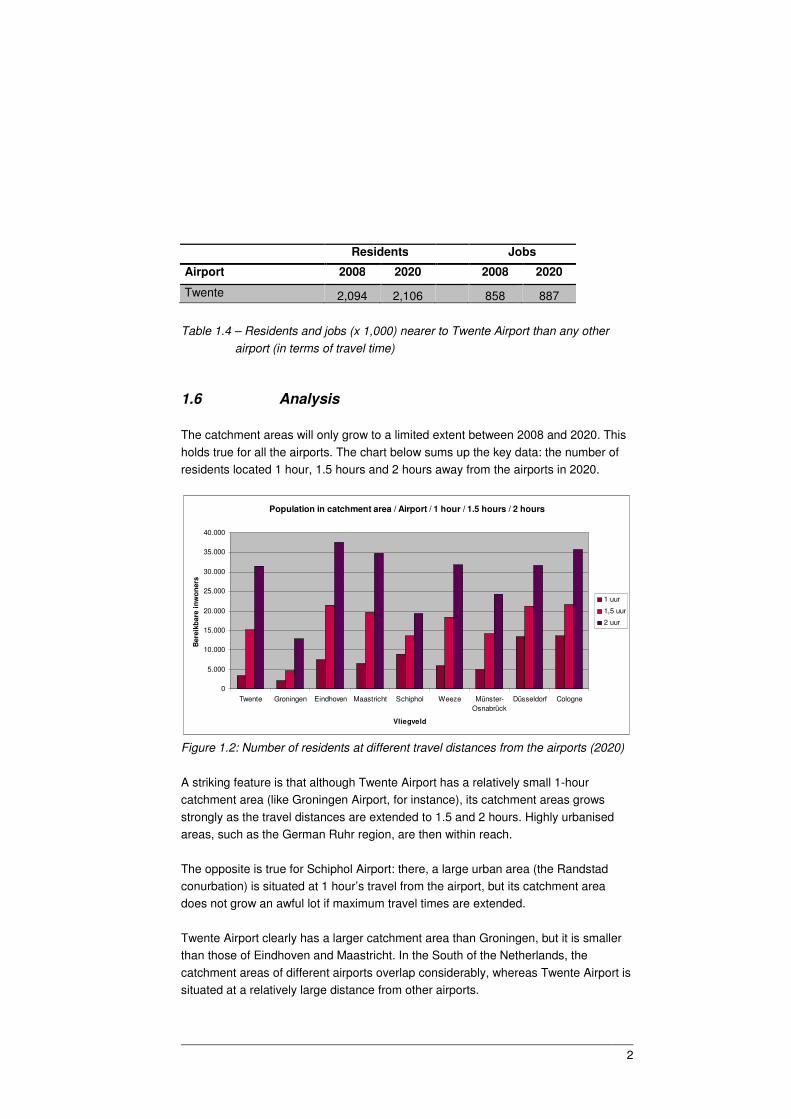
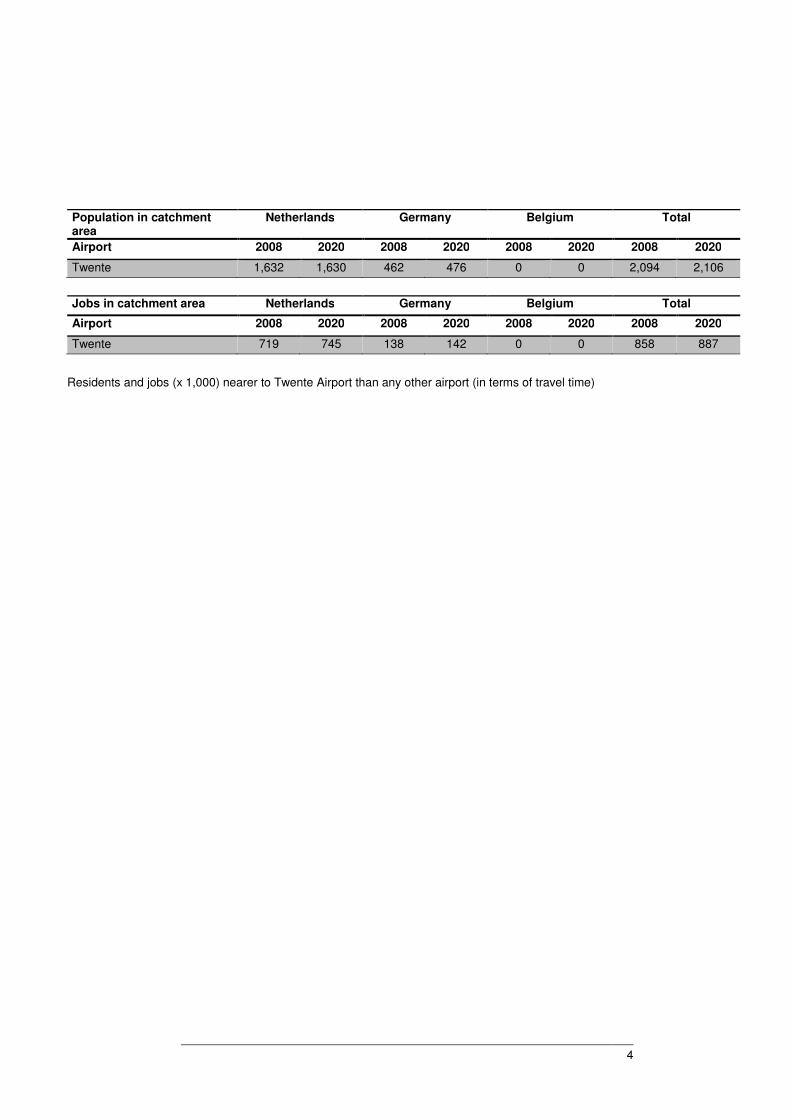
Table 1.4 – Residents and jobs (x 1,000) nearer to Twente Airport than any other
airport (in terms of travel time)
1.6 Analysis
The catchment areas will only grow to a limited extent between 2008 and 2020. This
holds true for all the airports. The chart below sums up the key data: the number of
residents located 1 hour, 1.5 hours and 2 hours away from the airports in 2020.
Population in catchment area / Airport / 1 hour / 1.5 hours / 2 hours
0
5.000
10.000
15.000
20.000
25.000
30.000
35.000
40.000
Twente Groningen Eindhoven Maastricht Schiphol Weeze Münster-
Osnabrück
Düsseldorf Cologne
Vliegveld
Bere
ikb
are
in
wo
ners
1 uur
1,5 uur
2 uur
Figure 1.2: Number of residents at different travel distances from the airports (2020)
A striking feature is that although Twente Airport has a relatively small 1-hour
catchment area (like Groningen Airport, for instance), its catchment areas grows
strongly as the travel distances are extended to 1.5 and 2 hours. Highly urbanised
areas, such as the German Ruhr region, are then within reach.
The opposite is true for Schiphol Airport: there, a large urban area (the Randstad
conurbation) is situated at 1 hour’s travel from the airport, but its catchment area
does not grow an awful lot if maximum travel times are extended.
Twente Airport clearly has a larger catchment area than Groningen, but it is smaller
than those of Eindhoven and Maastricht. In the South of the Netherlands, the
catchment areas of different airports overlap considerably, whereas Twente Airport is
situated at a relatively large distance from other airports.

3
Figure 10 makes this clear. The more the airports analysed can be reached within
one hour, the darker the area in question is in this figure. (The light areas at the
edges of the figure are not representative, because they are also largely situated in
the catchment areas of other airports which have not been looked at, such Rotterdam,
Antwerp, and Brussels). There is a fairly large area around Twente Airport from which
only this airport can be reached within an hour. This also applies to Groningen and,
to a lesser extent, Amsterdam Schiphol Airport, but it does not apply to Eindhoven
and Maastricht.
Twente Airport is the nearest airport for 2.1 million residents and nearly 900,000 jobs.
The area for which Twente is the nearest airport is shown in figure 11.

1
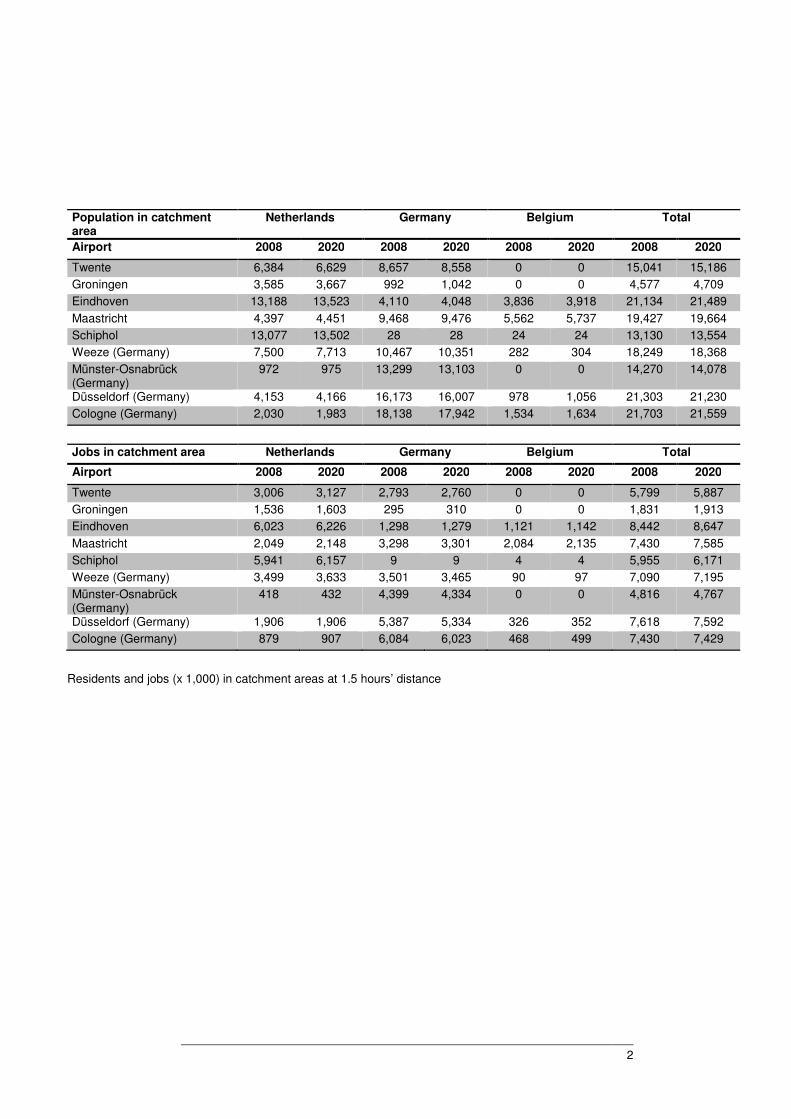
Schedule 1 Catchment areas by country of origin
Population in catchment area
Netherlands Germany Belgium Total
Airport 2008 2020 2008 2020 2008 2020 2008 2020
Twente 1,819 1,831 1,497 1,515 0 0 3,316 3,346
Groningen 1,884 1,890 166 174 0 0 2,050 2,065
Eindhoven 6,321 6,449 67 66 853 913 7,240 7,428
Maastricht 1,844 1,815 2,608 2,620 1,895 2,045 6,346 6,480
Schiphol 8,634 8,968 0 0 0 0 8,634 8,968
Weeze (Germany) 2,174 2,229 3,801 3,760 0 0 5,975 5,988
Münster-Osnabrück (Germany)
30 29 4,961 4,873 0 0 4,991 4,902
Düsseldorf (Germany) 1,024 994 12,477 12,368 22 23 13,523 13,385
Cologne (Germany) 447 413 13,209 13,123 81 81 13,737 13,617
Jobs in catchment area Netherlands Germany Belgium Total
Airport 2008 2020 2008 2020 2008 2020 2008 2020
Twente 824 854 491 498 0 0 1,315 1,352
Groningen 813 853 45 47 0 0 857 900
Eindhoven 2,981 3,093 14 14 262 279 3,258 3,386
Maastricht 850 877 804 808 564 607 2,218 2,292
Schiphol 3,918 4,032 0 0 0 0 3,918 4,032
Weeze (Germany) 1,007 1,059 1,196 1,183 0 0 2,203 2,242
Münster-Osnabrück (Germany)
7 7 1,563 1,536 0 0 1,570 1,543
Düsseldorf (Germany) 429 429 4,187 4,155 4 4 4,620 4,588
Cologne (Germany) 163 159 4,453 4,425 24 24 4,640 4,609
Residents and jobs (x 1,000) in catchment areas at 1 hours’ distance
2
Population in catchment area
Netherlands Germany Belgium Total
Airport 2008 2020 2008 2020 2008 2020 2008 2020
Twente 6,384 6,629 8,657 8,558 0 0 15,041 15,186
Groningen 3,585 3,667 992 1,042 0 0 4,577 4,709
Eindhoven 13,188 13,523 4,110 4,048 3,836 3,918 21,134 21,489
Maastricht 4,397 4,451 9,468 9,476 5,562 5,737 19,427 19,664
Schiphol 13,077 13,502 28 28 24 24 13,130 13,554
Weeze (Germany) 7,500 7,713 10,467 10,351 282 304 18,249 18,368
Münster-Osnabrück (Germany)
972 975 13,299 13,103 0 0 14,270 14,078
Düsseldorf (Germany) 4,153 4,166 16,173 16,007 978 1,056 21,303 21,230
Cologne (Germany) 2,030 1,983 18,138 17,942 1,534 1,634 21,703 21,559
Jobs in catchment area Netherlands Germany Belgium Total
Airport 2008 2020 2008 2020 2008 2020 2008 2020
Twente 3,006 3,127 2,793 2,760 0 0 5,799 5,887
Groningen 1,536 1,603 295 310 0 0 1,831 1,913
Eindhoven 6,023 6,226 1,298 1,279 1,121 1,142 8,442 8,647
Maastricht 2,049 2,148 3,298 3,301 2,084 2,135 7,430 7,585
Schiphol 5,941 6,157 9 9 4 4 5,955 6,171
Weeze (Germany) 3,499 3,633 3,501 3,465 90 97 7,090 7,195
Münster-Osnabrück (Germany)
418 432 4,399 4,334 0 0 4,816 4,767
Düsseldorf (Germany) 1,906 1,906 5,387 5,334 326 352 7,618 7,592
Cologne (Germany) 879 907 6,084 6,023 468 499 7,430 7,429
Residents and jobs (x 1,000) in catchment areas at 1.5 hours’ distance

3
Population in catchment area
Netherlands Germany Belgium Total
Airport 2008 2020 2008 2020 2008 2020 2008 2020
Twente 14,498 14,927 16,789 16,640 0 0 31,287 31,567
Groningen 9,254 9,588 3,119 3,220 0 0 12,373 12,808
Eindhoven 14,977 15,356 14,111 13,981 8,152 8,327 37,240 37,665
Maastricht 11,835 12,105 14,246 14,145 8,324 8,499 34,405 34,749
Schiphol 15,654 16,076 1,470 1,470 1,844 1,867 18,968 19,414
Weeze (Germany) 14,176 14,532 15,014 14,882 2,231 2,374 31,422 31,788
Münster-Osnabrück (Germany)
3,182 3,212 21,289 21,087 0 0 24,471 24,300
Düsseldorf (Germany) 8,226 8,400 20,169 19,938 3,150 3,318 31,545 31,656
Cologne (Germany) 5,793 5,848 24,651 24,370 5,432 5,608 35,876 35,825
Jobs in catchment area Netherlands Germany Belgium Total
Airport 2008 2020 2008 2020 2008 2020 2008 2020
Twente 6,570 6,812 5,637 5,589 0 0 12,207 12,401
Groningen 4,247 4,404 1,001 1,033 0 0 5,249 5,437
Eindhoven 6,725 6,960 4,722 4,682 2,896 2,947 14,342 14,589
Maastricht 5,492 5,692 4,722 4,690 2,892 2,943 13,105 13,325
Schiphol 7,033 7,294 420 416 659 666 8,111 8,376
Weeze (Germany) 6,416 6,639 4,999 4,958 722 766 12,137 12,363
Münster-Osnabrück (Germany)
1,405 1,460 7,181 7,117 0 0 8,586 8,577
Düsseldorf (Germany) 3,785 3,785 6,739 6,664 947 995 11,471 11,444
Cologne (Germany) 2,662 2,770 8,579 8,490 2,033 2,084 13,274 13,344
Residents and jobs (x 1,000) in catchment areas at 2 hours’ distance
4
Population in catchment area
Netherlands Germany Belgium Total
Airport 2008 2020 2008 2020 2008 2020 2008 2020
Twente 1,632 1,630 462 476 0 0 2,094 2,106
Jobs in catchment area Netherlands Germany Belgium Total
Airport 2008 2020 2008 2020 2008 2020 2008 2020
Twente 719 745 138 142 0 0 858 887
Residents and jobs (x 1,000) nearer to Twente Airport than any other airport (in terms of travel time)
1
2
3
4

5
6

7
8
9

10

11

12
13