1 building petabyte servers jim gray microsoft research [email protected]/talks kilo10 3 mega10...
TRANSCRIPT

1
Building PetaByte ServersBuilding PetaByte Servers
Jim GrayJim Gray
Microsoft ResearchMicrosoft Research
[email protected]@Microsoft.com
http://www.Research.Microsoft.com/~Gray/talkshttp://www.Research.Microsoft.com/~Gray/talks
KiloKilo 101033
MegaMega 101066
GigaGiga 101099
TeraTera 10101212 today, we are here today, we are here PetaPeta 10101515
ExaExa 10101818

2
OutlineOutline
• The challenge: Building GIANT data storesThe challenge: Building GIANT data stores
– for example, the EOS/DIS 15 PB systemfor example, the EOS/DIS 15 PB system
• Conclusion 1Conclusion 1
– Think about MOX and SCANSThink about MOX and SCANS
• Conclusion 2:Conclusion 2:
– Think about ClustersThink about Clusters

3
The Challenge -- EOS/DISThe Challenge -- EOS/DIS
• Antarctica is melting -- Antarctica is melting -- 77% of fresh water liberated77% of fresh water liberated
– sea level rises 70 meters sea level rises 70 meters – Chico & Memphis are beach-front propertyChico & Memphis are beach-front property– New York, Washington, SF, LA, London, Paris New York, Washington, SF, LA, London, Paris
• Let’s study it! Let’s study it! Mission to Planet EarthMission to Planet Earth
• EOS: Earth Observing System EOS: Earth Observing System (17B$ => 10B$)(17B$ => 10B$)
– 50 instruments on 10 satellites 1997-200150 instruments on 10 satellites 1997-2001– Landsat (added later)Landsat (added later)
• EOS DIS: Data Information System:EOS DIS: Data Information System:
– 3-5 MB/s raw, 30-50 MB/s processed.3-5 MB/s raw, 30-50 MB/s processed.– 4 TB/day, 4 TB/day, – 15 PB by year 200715 PB by year 2007

4
The Process FlowThe Process Flow
• Data arrives and is pre-processed.Data arrives and is pre-processed.– instrument data is instrument data is calibrated, calibrated,
griddedgriddedaveragedaveraged
– Geophysical data is derived Geophysical data is derived • Users ask Users ask for stored data for stored data
OROR to analyze and combine data.to analyze and combine data.• Can make the pull-push split dynamicallyCan make the pull-push split dynamically
Pull Processing Push ProcessingOther Data
5
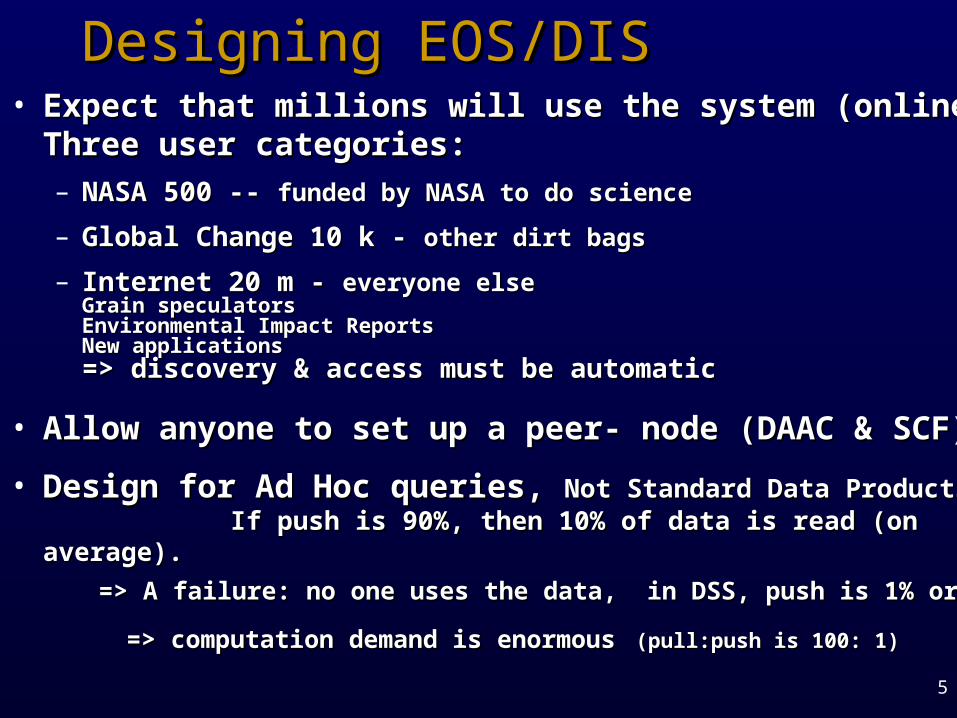
Designing EOS/DIS Designing EOS/DIS • Expect that millions will use the system (online)Expect that millions will use the system (online)
Three user categories:Three user categories:– NASA 500 -- NASA 500 -- funded by NASA to do sciencefunded by NASA to do science
– Global Change 10 k - Global Change 10 k - other dirt bagsother dirt bags
– Internet 20 m - Internet 20 m - everyone elseeveryone elseGrain speculatorsGrain speculatorsEnvironmental Impact ReportsEnvironmental Impact ReportsNew applicationsNew applications
=> discovery & access must be automatic => discovery & access must be automatic
• Allow anyone to set up a peer- node (DAAC & SCF)Allow anyone to set up a peer- node (DAAC & SCF)
• Design for Ad Hoc queries, Design for Ad Hoc queries, Not Standard Data Products Not Standard Data Products If push is 90%, then 10% of data is read (on average). If push is 90%, then 10% of data is read (on average).
=> A failure: no one uses the data, in DSS, push is 1% or less.=> A failure: no one uses the data, in DSS, push is 1% or less.
=> computation demand is enormous=> computation demand is enormous (pull:push is 100: 1)(pull:push is 100: 1)
6
The architectureThe architecture
• 2+N data center design2+N data center design
• Scaleable OR-DBMSScaleable OR-DBMS
• Emphasize Pull vs Push processingEmphasize Pull vs Push processing
• Storage hierarchyStorage hierarchy
• Data PumpData Pump
• Just in time acquisitionJust in time acquisition

7
Obvious Point: Obvious Point: EOS/DIS will be a cluster of SMPsEOS/DIS will be a cluster of SMPs
• It needs 16 PB storageIt needs 16 PB storage
– = 1 M disks in current technology= 1 M disks in current technology
– = 500K tapes in current technology= 500K tapes in current technology
• It needs 100 TeraOps of processing It needs 100 TeraOps of processing
– = 100K processors (current technology)= 100K processors (current technology)
– and ~ 100 Terabytes of DRAMand ~ 100 Terabytes of DRAM
• 1997 requirements are 1000x smaller1997 requirements are 1000x smaller
– smaller data ratesmaller data rate
– almost no re-processing workalmost no re-processing work

8
2+N data center design2+N data center design• duplex the archive (for fault tolerance)duplex the archive (for fault tolerance)
• let anyone build an extract (the +N)let anyone build an extract (the +N)
• Partition data by time and by space Partition data by time and by space (store 2 or 4 ways).(store 2 or 4 ways).
• Each partition is a free-standing OR-DBBMSEach partition is a free-standing OR-DBBMS(similar to Tandem, Teradata designs).(similar to Tandem, Teradata designs).
• Clients and Partitions interact Clients and Partitions interact via standard protocolsvia standard protocols
– OLE-DB, DCOM/CORBA, HTTP,…OLE-DB, DCOM/CORBA, HTTP,…

9
Hardware ArchitectureHardware Architecture
• 2 Huge Data Centers2 Huge Data Centers
• Each has 50 to 1,000 nodes in a clusterEach has 50 to 1,000 nodes in a cluster
– Each node has about 25…250 TB of storageEach node has about 25…250 TB of storage– SMP SMP .5Bips to 50 Bips .5Bips to 50 Bips 20K$ 20K$ – DRAMDRAM 50GB to 1 TB50GB to 1 TB 50K$ 50K$– 100 disks 100 disks 2.3 TB to 230 TB2.3 TB to 230 TB 200K$ 200K$– 10 tape robots10 tape robots 25 TB to 250 TB 25 TB to 250 TB 200K$ 200K$– 2 Interconnects2 Interconnects 1GBps to 100 GBps1GBps to 100 GBps 20K$ 20K$
• Node costs 500K$ Node costs 500K$
• Data Center costs 25M$ (capital cost)Data Center costs 25M$ (capital cost)

10
Scaleable OR-DBMSScaleable OR-DBMS
• Adopt cluster approach Adopt cluster approach (Tandem, Teradata, VMScluster,..)(Tandem, Teradata, VMScluster,..)
• System must scale to many processors, disks, linksSystem must scale to many processors, disks, links
• OR DBMS based on standard object modelOR DBMS based on standard object model
– CORBA or DCOM (not vendor specific) CORBA or DCOM (not vendor specific)
• Grow by adding componentsGrow by adding components
• System must be self-managingSystem must be self-managing
11
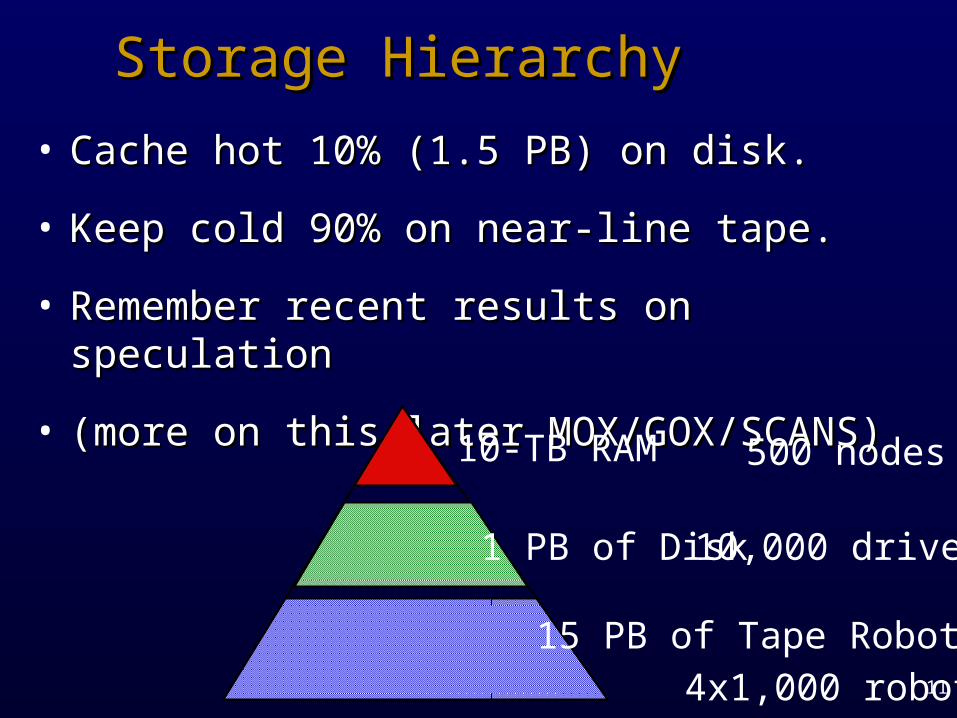
Storage HierarchyStorage Hierarchy
• Cache hot 10% (1.5 PB) on disk.Cache hot 10% (1.5 PB) on disk.
• Keep cold 90% on near-line tape.Keep cold 90% on near-line tape.
• Remember recent results on speculationRemember recent results on speculation
• (more on this later MOX/GOX/SCANS) (more on this later MOX/GOX/SCANS)
15 PB of Tape Robot
1 PB of Disk
10-TB RAM 500 nodes
10,000 drives
4x1,000 robots

12
Data PumpData Pump
• Some queries require reading ALL the data Some queries require reading ALL the data (for reprocessing)(for reprocessing)
• Each Data Center scans the data every 2 weeks.Each Data Center scans the data every 2 weeks.– Data rate 10 PB/day = 10 TB/node/day = 120 MB/sData rate 10 PB/day = 10 TB/node/day = 120 MB/s
• Compute on demand small jobsCompute on demand small jobs• less than 1,000 tape mountsless than 1,000 tape mounts• less than 100 M disk accessesless than 100 M disk accesses• less than 100 TeraOps.less than 100 TeraOps.• (less than 30 minute response time)(less than 30 minute response time)
• For BIG JOBS scan entire 15PB database For BIG JOBS scan entire 15PB database • Queries (and extracts) “snoop” this data pump.Queries (and extracts) “snoop” this data pump.

13
Just-in-time acquisition 30%Just-in-time acquisition 30%• Hardware prices decline 20%-40%/yearHardware prices decline 20%-40%/year
• So buy at last momentSo buy at last moment
• Buy best product that day: commodityBuy best product that day: commodity
• Depreciate over 3 years so that facility is fresh. Depreciate over 3 years so that facility is fresh. • (after 3 years, cost is 23% of original). 60% decline peaks at 10M$(after 3 years, cost is 23% of original). 60% decline peaks at 10M$
1996
EOS DIS Disk Storage Size and Cost
1994 1998 2000 2002 2004 2006 2008
Storage Cost M$
Data Need TB
1
10
10
10
10
10
2
3
4
5 assume 40% price decline/year
14
ProblemsProblems
• HSMHSM
• Design and Meta-dataDesign and Meta-data
• IngestIngest
• Data discovery, search, and analysisData discovery, search, and analysis
• reorg-reprocessreorg-reprocess
• disaster recoverydisaster recovery
• costcost

15
What this system teaches usWhat this system teaches us
• Traditional storage metricsTraditional storage metrics
– KOX: KB objects accessed per secondKOX: KB objects accessed per second
– $/GB: Storage cost$/GB: Storage cost
• New metrics:New metrics:
– MOX: megabyte objects accessed per secondMOX: megabyte objects accessed per second
– SCANS: Time to scan the archiveSCANS: Time to scan the archive

16
Thesis: Performance =Storage Accesses not Instructions ExecutedThesis: Performance =Storage Accesses not Instructions Executed• In the “old days” we counted instructions and IO’sIn the “old days” we counted instructions and IO’s
• Now we count memory referencesNow we count memory references
• Processors wait most of the timeProcessors wait most of the time
SortDisc Wait
Where the time goes: clock ticks used by AlphaSort Components
SortDisc WaitOS
Memory Wait
D-Cache Miss
I-Cache MissB-Cache
Data Miss

17
The Pico ProcessorThe Pico ProcessorThe Pico ProcessorThe Pico Processor
1 M SPECmarks
106 clocks/ fault to bulk ram
Event-horizon on chip.
VM reincarnated
Multi-program cache
Terror Bytes!
10 microsecond ram
10 millisecond disc
10 second tape archive 100 petabyte
100 terabyte
1 terabyte
Pico Processor
10 pico-second ram1 MM
3
megabyte
10 nano-second ram 10 gigabyte

18
Storage Latency: How Far Storage Latency: How Far Away is the Data?Away is the Data?Storage Latency: How Far Storage Latency: How Far Away is the Data?Away is the Data?
RegistersOn Chip CacheOn Board Cache
Memory
Disk
12
10
100
Tape /Optical Robot
10 9
10 6
Sacramento
This CampusThis Room
My Head
10 min
1.5 hr
2 Years
1 min
Pluto
2,000 YearsAndromeda

19
DataFlow ProgrammingDataFlow ProgrammingPrefetch & Postwrite Hide Latency Prefetch & Postwrite Hide Latency DataFlow ProgrammingDataFlow ProgrammingPrefetch & Postwrite Hide Latency Prefetch & Postwrite Hide Latency Can't wait for the data to arrive (2,000 years!)Need a memory that gets the data in advance ( 100MB/S)
Solution: Pipeline data to/from the processor Pipe data from source (tape, disc, ram...) to cpu cache

20
MetaMessage:MetaMessage: Technology Ratios Are Important Technology Ratios Are ImportantMetaMessage:MetaMessage: Technology Ratios Are Important Technology Ratios Are Important
• If everything gets faster&cheaper If everything gets faster&cheaper
at the same rate at the same rate THEN nothing really changes.THEN nothing really changes.
•
Things getting MUCH BETTER:Things getting MUCH BETTER:
– communication speed & cost 1,000xcommunication speed & cost 1,000x– processor speed & cost 100xprocessor speed & cost 100x– storage size & cost 100xstorage size & cost 100x
• Things staying about the sameThings staying about the same– speed of light (more or less constant)speed of light (more or less constant)– people (10x more expensive)people (10x more expensive)– storage speed (only 10x better)storage speed (only 10x better)

21
Trends: Storage Got CheaperTrends: Storage Got CheaperTrends: Storage Got CheaperTrends: Storage Got Cheaper
• $/byte got 10$/byte got 1044 better better
• $/access got 10$/access got 1033 better better
• capacity grew 10capacity grew 1033
• Latency improved 10Latency improved 10
• Bandwidth improved 10Bandwidth improved 10
Year
1e 9
1e 8
1e 7
1e 6
1e 5
1e 4
1e 3
1960 1970 1980 1990 2000
Disk (kB)
Storage Capacity
RAM (b)
Tape (kB)
Uni
t S
tora
ge S
ize

22
Trends: Trends: Access Times Improved LittleAccess Times Improved LittleTrends: Trends: Access Times Improved LittleAccess Times Improved Little
1
1e 9
1e 8
1e 7
1e 6
1e 5
1e 4
1e 3
1960 1970 1980 1990 2000
Processors
Year
Inst
ruct
ions
/ s
econ
d
Processor Speedups
Bits
/ s
econ
d
WANs
1e 2
1e 1
1e 0
1e -1
1e-2
1e-3
1e-4
1e-5
1e-6
1e-7
1e 3
1960 1970 1980 1990 2000
Tape
Disk
RAM
Year
Access Times Improved Little

23
Trends: Trends: Storage Bandwidth Improved LittleStorage Bandwidth Improved LittleTrends: Trends: Storage Bandwidth Improved LittleStorage Bandwidth Improved Little
1e 9
1e 8
1e 7
1e 6
1e 5
1e 4
1e 3
1960 1970 1980 1990 2000
TapeDisk
RAM
Year
Transfer Rates Improved Little
1e -11
1e 9
1e 8
1e 7
1e 6
1e 5
1e 4
1e 3
1960 1970 1980 1990 2000
Processors
Year
Processor Speedups
WANs
24
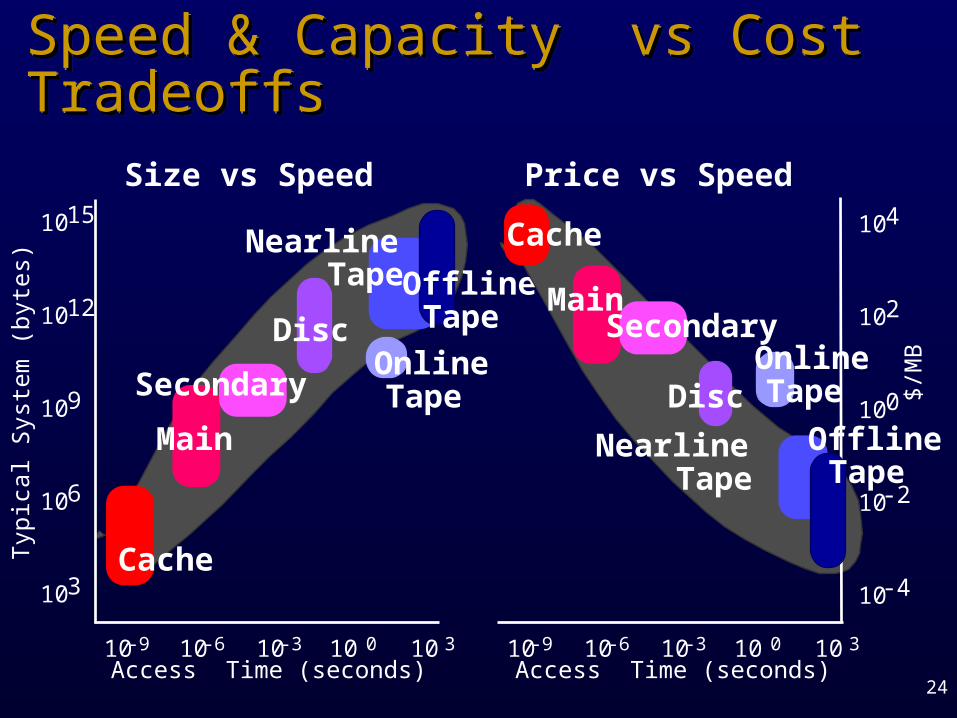
Today’s Storage Hierarchy : Today’s Storage Hierarchy : Speed & Capacity vs Cost TradeoffsSpeed & Capacity vs Cost TradeoffsToday’s Storage Hierarchy : Today’s Storage Hierarchy : Speed & Capacity vs Cost TradeoffsSpeed & Capacity vs Cost Tradeoffs
1015
1012
109
106
103
Typ
ical
Sys
tem
(by
tes)
Size vs Speed
Access Time (seconds)10-9 10-6 10-3 10 0 10 3
Cache
Main
Secondary
Disc
Nearline Tape Offline
Tape
Online Tape
104
102
100
10-2
10-4
$/M
B
Price vs Speed
Access Time (seconds)10-9 10-6 10-3 10 0 10 3
Cache
MainSecondary
Disc
Nearline Tape
Offline Tape
Online Tape

25
Trends: Trends: Application Storage Demand GrewApplication Storage Demand GrewTrends: Trends: Application Storage Demand GrewApplication Storage Demand Grew
• The New World:The New World:
– Billions of objectsBillions of objects
– Big objects (1MB)Big objects (1MB)
People
Name Address Papers Picture Voice
Mike
Won
David NY
Berk
Austin
The Old World:– Millions of
objects– 100-byte objectsPeople
Name Address
Mike
Won
David NY
Berk
Austin

26
Trends:Trends:New ApplicationsNew ApplicationsTrends:Trends:New ApplicationsNew Applications
The paperless office
Library of congress online (on your campus)
All information comes electronically entertainment publishing business
Information Network, Knowledge Navigator, Information at Your Fingertips
Multimedia: Text, voice, image, video, ...

27
What's a TerabyteWhat's a Terabyte1 Terabyte 1,000,000,000 business letters 100,000,000 book pages 50,000,000 FAX images 10,000,000 TV pictures (mpeg) 4,000 LandSat images
Library of Congress (in ASCI) is 25 TB 1980: 200 M$ of disc 10,000 discs 5 M$ of tape silo 10,000 tapes
1997: 200 K$ of magnetic disc 120 discs 300 K$ of optical disc robot 250 platters 50 K$ of tape silo 50 tapes
Terror Byte !!.1% of a PetaByte!!!!!!!!!!!!!!!!!!
150 miles of bookshelf 15 miles of bookshelf 7 miles of bookshelf 10 days of video

28
The Cost of Storage & AccessThe Cost of Storage & AccessThe Cost of Storage & AccessThe Cost of Storage & Access• File Cabinet: File Cabinet: cabinet (4 drawer)cabinet (4 drawer) 250$250$
paper (24,000 sheets)paper (24,000 sheets) 250$250$space (2x3 @ 10$/ft2)space (2x3 @ 10$/ft2) 180$180$ totaltotal
700$700$ 3 3 ¢/sheet¢/sheet
• Disk:Disk: disk (9 GB =)disk (9 GB =) 2,000$ 2,000$ASCII: ASCII: 5 m pages 5 m pages
0.20.2 ¢/sheet ¢/sheet (50x cheaper(50x cheaper
• Image:Image: 200 k pages200 k pages
1 ¢/sheet (similar to paper)1 ¢/sheet (similar to paper)

29
Standard Storage MetricsStandard Storage MetricsStandard Storage MetricsStandard Storage Metrics• Capacity: Capacity:
– RAM: RAM: MB and $/MB: today at 10MB & 100$/MBMB and $/MB: today at 10MB & 100$/MB– Disk:Disk: GB and $/GB: today at 5GB and 500$/GBGB and $/GB: today at 5GB and 500$/GB– Tape: Tape: TB and $/TB:TB and $/TB: today at .1TB and 100k$/TB today at .1TB and 100k$/TB
(nearline)(nearline)
• Access time (latency)Access time (latency)– RAM:RAM: 100 ns100 ns– Disk: Disk: 10 ms 10 ms– Tape: 30 second pick, 30 second position Tape: 30 second pick, 30 second position
• Transfer rateTransfer rate– RAM:RAM: 1 GB/s 1 GB/s– Disk:Disk: 5 MB/s - - - Arrays can go to 1GB/s 5 MB/s - - - Arrays can go to 1GB/s– Tape: 3 MB/s - - - not clear that striping worksTape: 3 MB/s - - - not clear that striping works
30
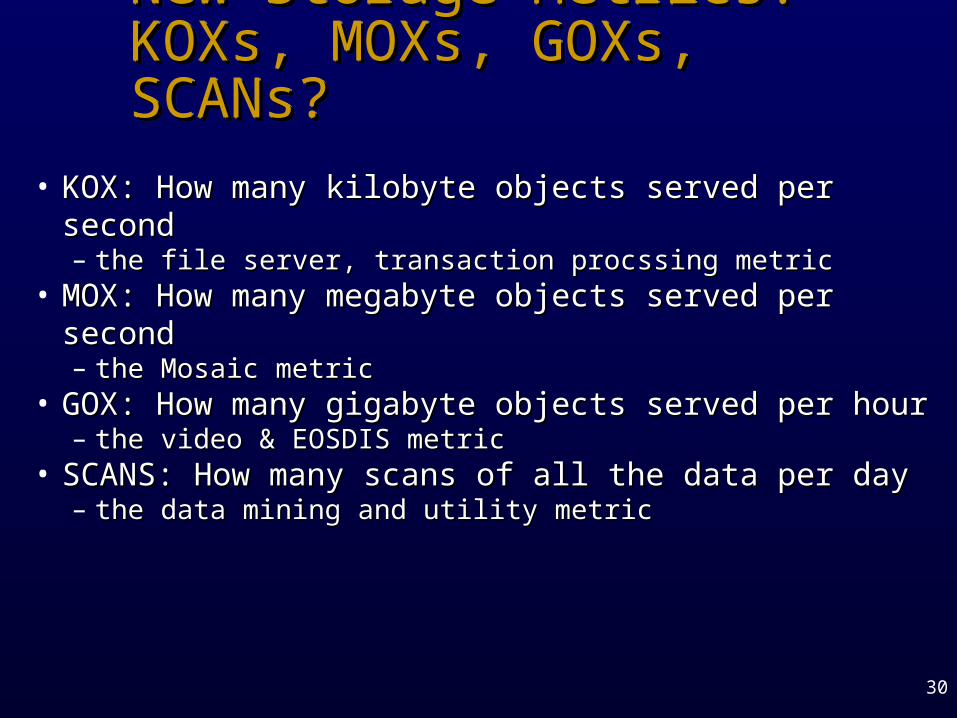
New Storage Metrics: New Storage Metrics: KOXs, MOXs, GOXs, SCANs?KOXs, MOXs, GOXs, SCANs?New Storage Metrics: New Storage Metrics: KOXs, MOXs, GOXs, SCANs?KOXs, MOXs, GOXs, SCANs?
• KOX: How many kilobyte objects served per secondKOX: How many kilobyte objects served per second– the file server, transaction procssing metricthe file server, transaction procssing metric
• MOX: How many megabyte objects served per MOX: How many megabyte objects served per secondsecond– the Mosaic metricthe Mosaic metric
• GOX: How many gigabyte objects served per hourGOX: How many gigabyte objects served per hour– the video & EOSDIS metricthe video & EOSDIS metric
• SCANS: How many scans of all the data per daySCANS: How many scans of all the data per day– the data mining and utility metricthe data mining and utility metric

31
How To Get Lots of MOX, How To Get Lots of MOX, GOX, SCANSGOX, SCANSHow To Get Lots of MOX, How To Get Lots of MOX, GOX, SCANSGOX, SCANS
• parallelism: use many little devices in parallelparallelism: use many little devices in parallel
• Beware of the media mythBeware of the media myth
• Beware of the access time mythBeware of the access time myth
1 Terabyte
10 MB/s
At 10 MB/s: 1.2 days to scan
1 Terabyte
1,000 x parallel: 15 minute SCAN.
Parallelism: divide a big problem into many smaller ones to be solved in parallel.
32
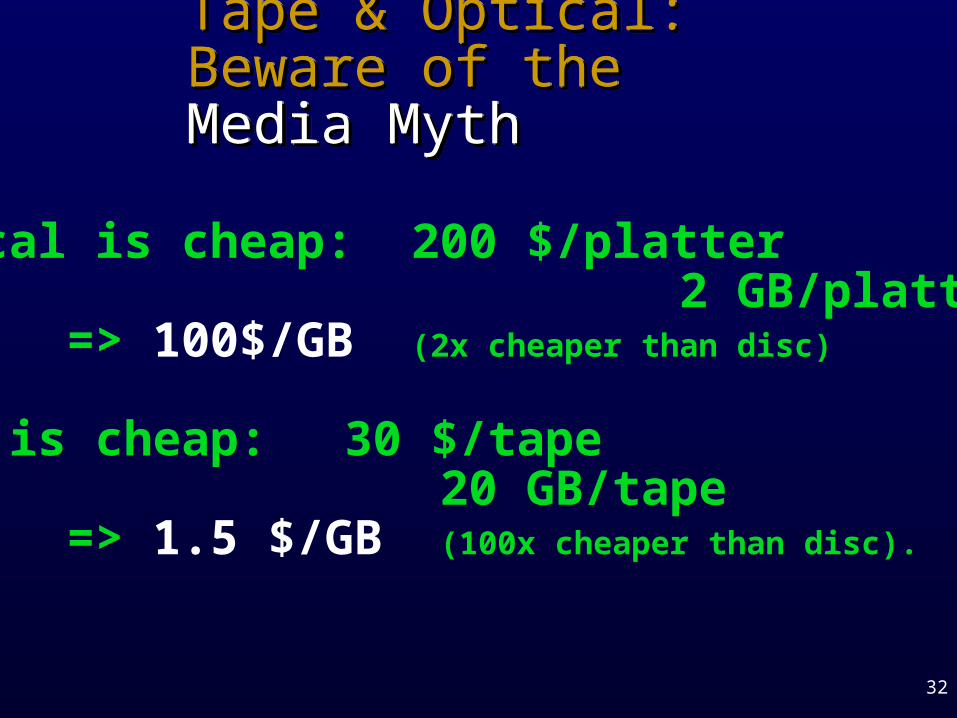
Tape & Optical: Tape & Optical: Beware of the Beware of the Media MythMedia MythTape & Optical: Tape & Optical: Beware of the Beware of the Media MythMedia Myth
Optical is cheap: 200 $/platter 2 GB/platter => 100$/GB (2x cheaper than disc)
Tape is cheap: 30 $/tape 20 GB/tape => 1.5 $/GB (100x cheaper than disc).

33
Tape & Optical Tape & Optical RealityReality: : Media is 10% of System CostMedia is 10% of System CostTape & Optical Tape & Optical RealityReality: : Media is 10% of System CostMedia is 10% of System Cost
Tape needs a robot (10 k$ ... 3 m$ ) 10 ... 1000 tapes (at 20GB each) => 20$/GB ... 200$/GB
(1x…10x cheaper than disc)
Optical needs a robot (100 k$ ) 100 platters = 200GB ( TODAY ) => 400 $/GB
( more expensive than mag disc ) Robots have poor access times Not good for Library of Congress (25TB) Data motel: data checks in but it never checks out!

34
The Access Time MythThe Access Time MythThe Access Time MythThe Access Time MythThe Myth: seek or pick time dominatesThe Myth: seek or pick time dominatesThe reality: (1) Queuing dominatesThe reality: (1) Queuing dominates (2) Transfer dominates BLOBs(2) Transfer dominates BLOBs (3) Disk seeks often short(3) Disk seeks often shortImplication: many cheap servers Implication: many cheap servers
better than one fast expensive server better than one fast expensive server– shorter queuesshorter queues– parallel transferparallel transfer– lower cost/access and cost/bytelower cost/access and cost/byte
This is now obvious for disk arraysThis is now obvious for disk arraysThis will be obvious for tape arraysThis will be obvious for tape arrays
Seek
Rotate
Transfer
Seek
Rotate
Transfer
Wait

35
The Disk Farm On a CardThe Disk Farm On a CardThe Disk Farm On a CardThe Disk Farm On a CardThe 100GB disc cardThe 100GB disc cardAn array of discsAn array of discsCan be used asCan be used as 100 discs100 discs 1 striped disc1 striped disc 10 Fault Tolerant discs10 Fault Tolerant discs ....etc....etcLOTS of accesses/secondLOTS of accesses/second bandwidthbandwidth
14"
Life is cheap, its the accessories that cost ya.
Processors are cheap, it’s the peripherals that cost ya (a 10k$ disc card).

36
My Solution to Tertiary StorageMy Solution to Tertiary StorageTape Farms, Not Mainframe SilosTape Farms, Not Mainframe SilosMy Solution to Tertiary StorageMy Solution to Tertiary StorageTape Farms, Not Mainframe SilosTape Farms, Not Mainframe Silos
Scan in 24 hours.many independent tape robots(like a disc farm)
10K$ robot 10 tapes500 GB 6 MB/s 20$/GB 30 MOX 15 GOX
100 robots
50TB 50$/GB 3K MOX1.5K GOX1 Scans
1M$
37
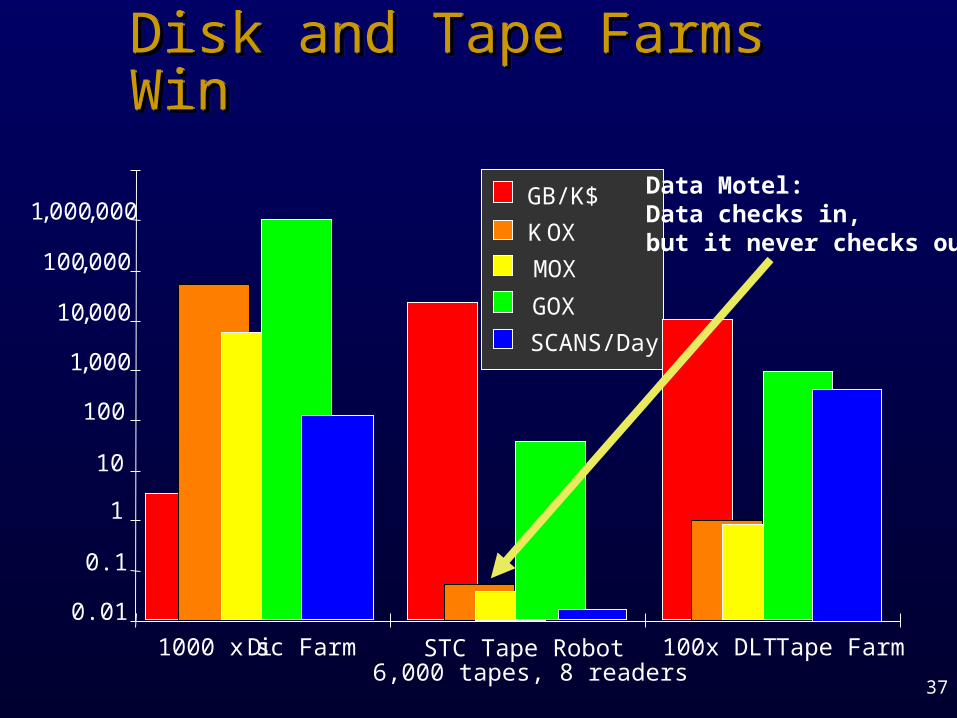
0.01
0.1
1
10
100
1,000
10,000
100,000
1,000,000
1000 x Disc Farm STC Tape Robot 6,000 tapes, 8 readers
100x DLT Tape Farm
GB/K$
MOX
GOX
SCANS/Day
KOX
The Metrics: The Metrics: Disk and Tape Farms Win Disk and Tape Farms Win The Metrics: The Metrics: Disk and Tape Farms Win Disk and Tape Farms Win
Data Motel:Data checks in, but it never checks out
38
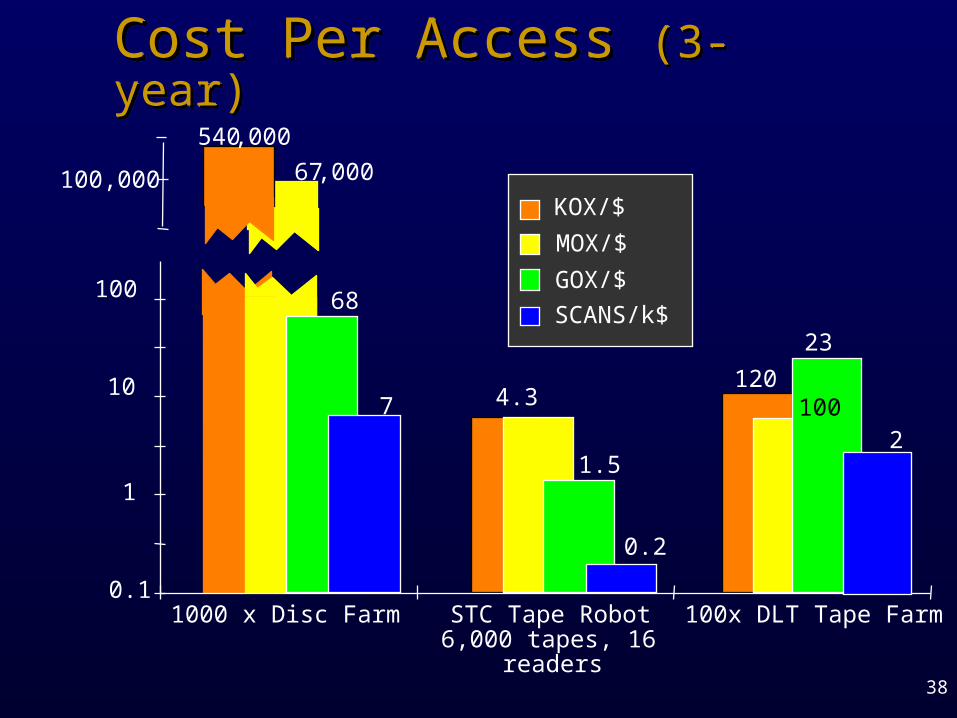
Cost Per Access Cost Per Access (3-year)(3-year)Cost Per Access Cost Per Access (3-year)(3-year)
0.1
1
10
100
100,000
120
2
1000 x Disc Farm STC Tape Robot 6,000 tapes, 16
readers
100x DLT Tape Farm
KOX/$
MOX/$
GOX/$
SCANS/k$
500K
540,000
67,000
68
77 4.3
1.5
0.2
23
100
39
Summary (of new ideas)Summary (of new ideas)Summary (of new ideas)Summary (of new ideas)• Storage accesses are the bottleneckStorage accesses are the bottleneck
• Accesses are getting larger (MOX, GOX, SCANS)Accesses are getting larger (MOX, GOX, SCANS)
• Capacity and cost are improvingCapacity and cost are improving
• BUTBUT
• Latencies and bandwidth are not improving muchLatencies and bandwidth are not improving much
• SOSO
• Use parallel access (disk and tape farms)Use parallel access (disk and tape farms)

40
MetaMessage:MetaMessage: Technology Ratios Are Important Technology Ratios Are ImportantMetaMessage:MetaMessage: Technology Ratios Are Important Technology Ratios Are Important
• If everything gets faster&cheaper at the same If everything gets faster&cheaper at the same rate nothing really changes.rate nothing really changes.
• Some things getting MUCH BETTER:Some things getting MUCH BETTER:– communication speed & cost 1,000xcommunication speed & cost 1,000x– processor speed & cost 100xprocessor speed & cost 100x– storage size & cost 100xstorage size & cost 100x
• Some things staying about the sameSome things staying about the same– speed of light (more or less constant)speed of light (more or less constant)– people (10x worse)people (10x worse)– storage speed (only 10x better)storage speed (only 10x better)

41
Disk Performance vs Time
1
10
100
1980 1990 2000
Year
accesstime(ms)
1
10
bandwidth(MB/s)access time
transfer rate
Disk Performance vs Time(accesses/ second & Capacity
1
10
100
1980 1990 2000
Year
AccessesperSecond
0
1
10
DiskCapackty(GB)
1K 8 KB 64 KB
1 MB capacity (GB)
Storage Price vs Time
0.1
1
10
100
1000
10000
1980 1990 2000
Year
$/MB
$/MB Disk
$/MB DRAM
Ratios ChangedRatios Changed
• 10x better access time10x better access time
• 10x more bandwidth10x more bandwidth
• 10,000x lower media price10,000x lower media price
• DRAM/DISK 100:1 to 10:10 to 50:1DRAM/DISK 100:1 to 10:10 to 50:1

42
The Five Minute RuleThe Five Minute Rule
• Trade DRAM for Disk AccessesTrade DRAM for Disk Accesses
• Cost of an access (DriveCost / Access_per_second)Cost of an access (DriveCost / Access_per_second)
• Cost of a DRAM page ( $/MB / pages_per_MB)Cost of a DRAM page ( $/MB / pages_per_MB)
• Break even has two terms:Break even has two terms:
• Technology term and an Economic termTechnology term and an Economic term
• Grew page size to compensate for changing ratios.Grew page size to compensate for changing ratios.
• Now at 10 minute for random, 2 minute sequentialNow at 10 minute for random, 2 minute sequential 1
ofDRAMPricePerMB
skDrivePricePerDi
skecondPerDiAccessPerS
ofDRAMPagesPerMBtervaleferenceInBreakEvenR
1ofDRAMPricePerMB
skDrivePricePerDi
skecondPerDiAccessPerS
ofDRAMPagesPerMBtervaleferenceInBreakEvenR

43
Shows Best Page Index Page Size ~16KBShows Best Page Index Page Size ~16KB
Index Page Utility vs Page Size and Index Elemet Size
0.40
0.50
0.60
0.70
0.80
0.90
1.00
Page Size (KB)
Uti
lity
16 B 0.64 0.72 0.78 0.82 0.79 0.69 0.54
32 B 0.54 0.62 0.69 0.73 0.71 0.63 0.50
64 B 0.44 0.53 0.60 0.64 0.64 0.57 0.45
128 B 0.34 0.43 0.51 0.56 0.56 0.51 0.41
2 4 8 16 32 64 128
16 byte entries
32 byte
64 byte
128 byte
Index Page Utility vs Page Size and Disk Performance
0.40
0.50
0.60
0.70
0.80
0.90
1.00
Page Size (KB)
Uti
lity
40 MB/s 0.65 0.74 0.83 0.91 0.97 0.99 0.94
10 MB/s 0.64 0.72 0.78 0.82 0.79 0.69 0.54
5 MB/s 0.62 0.69 0.73 0.71 0.63 0.50 0.34
3 MB/s 0.51 0.56 0.58 0.54 0.46 0.34 0.22
1 MB/s 0.40 0.44 0.44 0.41 0.33 0.24 0.16
2 4 8 16 32 64 128
10 MB/s
5 MB/s
3 MB/s
1MB/s

44
The Ideal InterconnectThe Ideal Interconnect
• High bandwidthHigh bandwidth• Low latencyLow latency
– No software stackNo software stack– Zero CopyZero Copy– User mode access to deviceUser mode access to device– Low HBA latencyLow HBA latency
• Error FreeError Free– (required if no software stack)(required if no software stack)
• Flow ControlledFlow Controlled• WE NEED A NEW PROTOCOLWE NEED A NEW PROTOCOL
– best of SCSI and Commbest of SCSI and Comm– allow push & pullallow push & pull– industry is doing it SAN + VIAindustry is doing it SAN + VIA
SCSI Comm+++ ---- -- -- + - + - - - - ++++ ---
+++ -

45
OutlineOutline
• The challenge: Building GIANT data storesThe challenge: Building GIANT data stores
– for example, the EOS/DIS 15 PB systemfor example, the EOS/DIS 15 PB system
• Conclusion 1Conclusion 1
– Think about MOX and SCANSThink about MOX and SCANS
• Conclusion 2:Conclusion 2:
– Think about ClustersThink about Clusters
– SMP reportSMP report
– Cluster reportCluster report
46
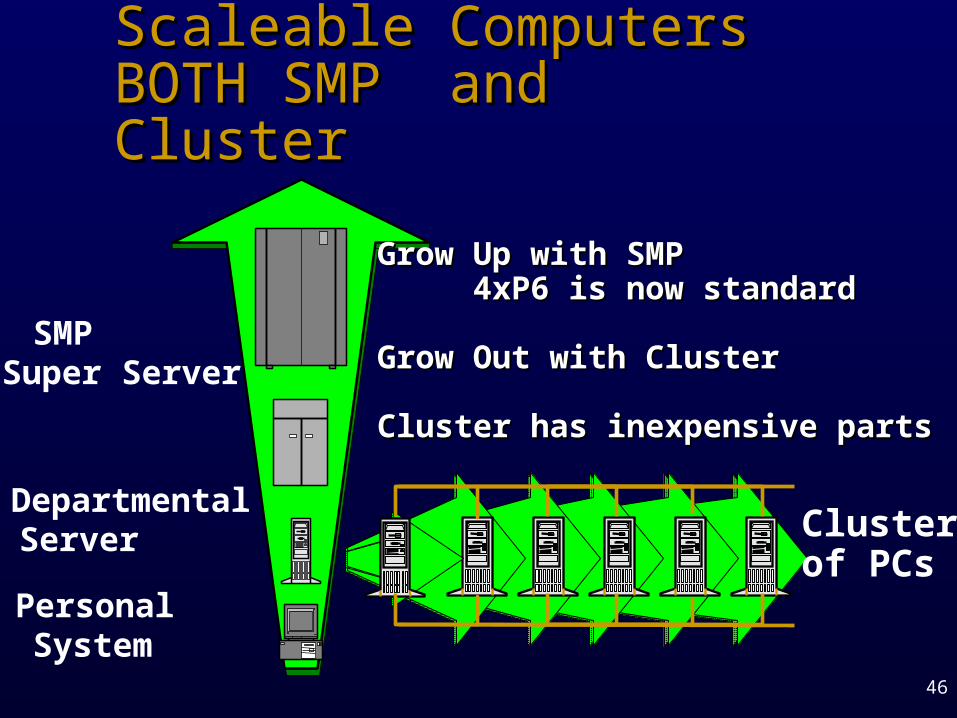
Scaleable ComputersScaleable ComputersBOTH SMP and Cluster BOTH SMP and Cluster
SMPSuper Server
DepartmentalServer
PersonalSystem
Grow Up with SMPGrow Up with SMP4xP6 is now standard4xP6 is now standard
Grow Out with ClusterGrow Out with Cluster
Cluster has inexpensive partsCluster has inexpensive parts
Clusterof PCs

47
TPC-C Current ResultsTPC-C Current ResultsTPC-C Current ResultsTPC-C Current Results• Best Performance is 30,390 tpmC @ $305/tpmC (Oracle/DEC)
• Best Price/Perf. is 7,693 tpmC @ $43.5/tpmC (MS SQL/Dell)
• Graphs show– UNIX high price – UNIX scaleup diseconomy
tpmC vs $/tpmC
$0
$50
$100
$150
$200
$250
$300
0 5000 10000 15000 20000 25000 30000
tpmC
$/tp
mC
DB2
Informix
MS SQL Server
Oracle
Sybase
tpmC vs $/tpmClow -end
$0
$50
$100
$150
$200
0 2000 4000 6000 8000 10000
tpmC
$/t
pm
C
DB2
Informix
MS SQL Server
Oracle
Sybase

48
Compare SMP PerformanceCompare SMP Performance
tpmC vs CPS
0
5,000
10,000
15,000
20,000
0 5 10 15 20
CPUs
tpm
C
SUN Scaleability
0
2,000
4,000
6,000
8,000
10,000
12,000
14,000
16,000
18,000
20,000
0 5 10 15 20
cpus
tpm
C
SUN Scaleability
SQL Server

49
Where the money goesWhere the money goes
TPC Price/tpmC
6664
54
3942 41
30
9
33
47
17
11
4042
31
3835
38
22
4145
30
8
19
27
40
3
21
9
22
3
9
0
10
20
30
40
50
60
70
processor disk software net
Oracle on DEC UnixOracle on UltraSparc/SolarisOracle on Compaq/NTSybase on Compaq/NTMicrosoft on Compaq with VisigenicsMicrosoft on Intergraph with IISMicrosoft on Compaq with IISMicrosoft on Dell with IIS

50
TPC C improved fastTPC C improved fast
$/tpmC vs time
$10
$100
$1,000
Mar-94 Sep-94 Apr-95 Oct-95 May-96 Dec-96 Jun-97
date
$/tp
mC
250 %/year improvement!
tpmC vs time
100
1,000
10,000
100,000
Mar-94 Sep-94 Apr-95 Oct-95 May-96 Dec-96 Jun-97
date
tpm
C
250 %/year improvement!
40% hardware, 100% software, 100% PC Technology

51
What does this mean?What does this mean?
• PC Technology is 3x cheaper than high-end SMPsPC Technology is 3x cheaper than high-end SMPs
• PC nodes performance are 1/2 of high-end SMPsPC nodes performance are 1/2 of high-end SMPs
– 4xP6 vs 20xUltraSparc 4xP6 vs 20xUltraSparc
• Peak performance is a clusterPeak performance is a cluster
– Tandem 100 node clusterTandem 100 node cluster
– DEC Alpha 4x8 clusterDEC Alpha 4x8 cluster
• Commodity solutions WILL come to this marketCommodity solutions WILL come to this market

53
Clusters being builtClusters being built• Teradata 500 nodes Teradata 500 nodes (50k$/slice) (50k$/slice)• Tandem,VMScluster 150 nodes Tandem,VMScluster 150 nodes (100k$/slice)(100k$/slice)• Intel, 9,000 nodes @ 55M$ Intel, 9,000 nodes @ 55M$ ( (
6k$/slice)6k$/slice)• Teradata, Tandem, DEC moving to NT+low slice priceTeradata, Tandem, DEC moving to NT+low slice price
• IBM: 512 nodes @ 100m$ (200k$/slice)IBM: 512 nodes @ 100m$ (200k$/slice)• PC clusters (bare handed) at dozens of nodes PC clusters (bare handed) at dozens of nodes
web servers (msn, PointCast,…), DB serversweb servers (msn, PointCast,…), DB servers
• KEY TECHNOLOGY HERE IS THE APPS.KEY TECHNOLOGY HERE IS THE APPS.– Apps distribute dataApps distribute data– Apps distribute executionApps distribute execution

54
Cluster AdvantagesCluster Advantages
• Clients and Servers made from the same stuff.Clients and Servers made from the same stuff.
– Inexpensive: Built with commodity components Inexpensive: Built with commodity components
• Fault tolerance: Fault tolerance: – Spare modules mask failures Spare modules mask failures
• Modular growthModular growth
– grow by adding small modulesgrow by adding small modules
• Parallel data searchParallel data search
– use multiple processors and disksuse multiple processors and disks

55
Clusters are winning the high endClusters are winning the high end• You saw that a 4x8 cluster has best TPC-C performanceYou saw that a 4x8 cluster has best TPC-C performance• This year, a 32xUltraSparc cluster won the MinuteSort This year, a 32xUltraSparc cluster won the MinuteSort
Speed Trophy Speed Trophy (see NOWsort at www.now.cs.berkeley.edu)(see NOWsort at www.now.cs.berkeley.edu)
• Ordinal 16x on SGI Origin is close (but the loser!).Ordinal 16x on SGI Origin is close (but the loser!).
1.0E+02
1.0E+03
1.0E+04
1.0E+05
1.0E+06
1.0E+07
1985 1990 1995 2000
Sort Records/second vs Time
M68000
Cray YMP
IBM 3090
Tandem
Hardware Sorter
Sequent
Intel Hyper
SGIIBM RS6000
NOW
Alpha
Next NOW (100 nodes)
56
Clusters (Plumbing)Clusters (Plumbing)
• Single system imageSingle system image
– namingnaming
– protection/securityprotection/security
– management/load balancemanagement/load balance
• Fault ToleranceFault Tolerance
– Wolfpack DemoWolfpack Demo
• Hot Pluggable hardware & SoftwareHot Pluggable hardware & Software

57
So, What’s New?So, What’s New?• When slices cost 50k$, you buy 10 or 20.When slices cost 50k$, you buy 10 or 20.• When slices cost 5k$ you buy 100 or 200.When slices cost 5k$ you buy 100 or 200.• Manageability, programmability, usability Manageability, programmability, usability
become key issues (total cost of ownership).become key issues (total cost of ownership).• PCs are MUCH easier to use and programPCs are MUCH easier to use and program
New MPP &NewOS
New App
New MPP &NewOS
New App
New MPP &NewOS
New App
New MPP &NewOS
New App
StandardOS & Hardware
Apps
Customers
MPPVicious CycleNo Customers!
CP/CommodityVirtuous Cycle:Standards allow progressand investment protection
58
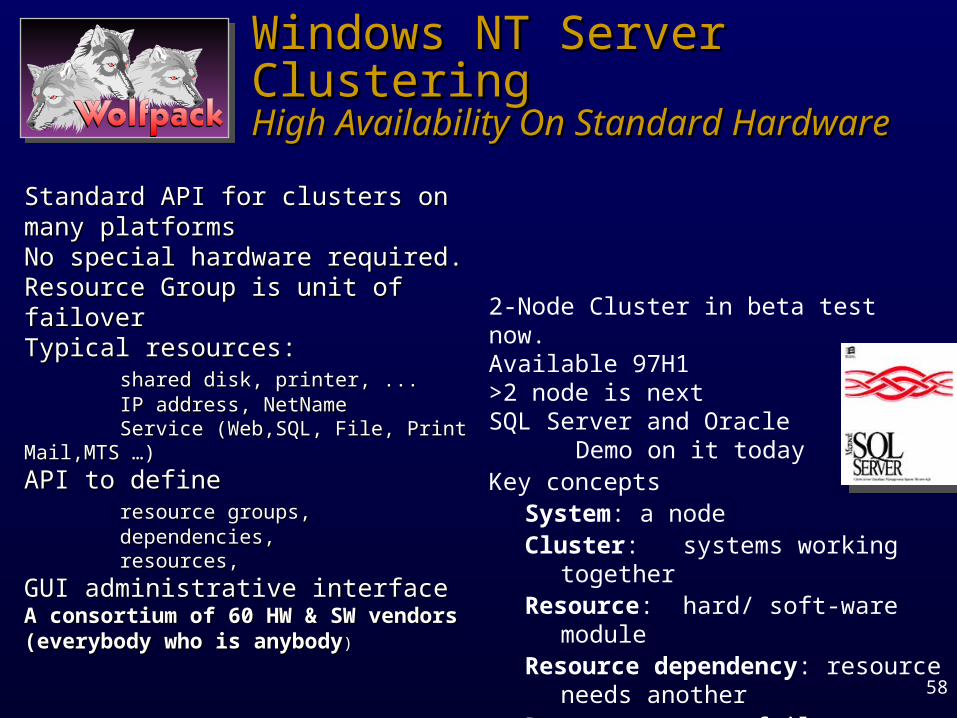
Windows NT Server ClusteringWindows NT Server ClusteringHigh Availability On Standard HardwareHigh Availability On Standard Hardware
Standard API for clusters on many platformsStandard API for clusters on many platformsNo special hardware required.No special hardware required.Resource Group is unit of failoverResource Group is unit of failoverTypical resources: Typical resources:
shared disk, printer, ...shared disk, printer, ...IP address, NetNameIP address, NetNameService (Web,SQL, File, Print Mail,MTS Service (Web,SQL, File, Print Mail,MTS
…)…)
API to define API to define resource groups,resource groups,dependencies, dependencies, resources, resources,
GUI administrative interfaceGUI administrative interfaceA consortium of 60 HW & SW vendors A consortium of 60 HW & SW vendors (everybody who is anybody(everybody who is anybody))
2-Node Cluster in beta test now.Available 97H1>2 node is nextSQL Server and Oracle
Demo on it todayKey concepts
System: a nodeCluster: systems working together Resource: hard/ soft-ware moduleResource dependency: resource needs
anotherResource group: fails over as a unitDependencies: do not cross group
boundaries

59
WolfpackWolfpack NT Clusters 1.0 NT Clusters 1.0
Shared SCSI Disk Strings
BettyAlice
PrivateDisks
PrivateDisks
Clients
• Two node file and print failover
• GUI admin interface

60
SQL Server 6.5 FailoverSQL Server 6.5 Failover • Failover unit is DB ServerFailover unit is DB Server
•When one node fails, other takes over shared disksrecovers database starts offering service to the DB
• Client failover via reconnectIP impersonation orODBC or DBlib reconnect in SQL Server 6.5

61
What is Wolfpack?What is Wolfpack?
Cluster Api DLL
DatabaseManager
Event ProcessorNode
Manager
Failover MgrResource Mgr
CommunicationManager
Resource Monitors
Cluster Service
Cluster Management Tools
PhysicalResource
DLL
LogicalResource
DLL
AppResource
DLL
ResourceManagementInterface
AppResource
DLL
Non AwareApp
Cluster AwareApp
RPC
Global UpdateManager
OpenOnlineIsAliveLooksAliveOfflineClose
Other Nodes

62
Where We Are TodayWhere We Are Today• Clusters moving fast Clusters moving fast
– OLTPOLTP
– SortSort
– WolfPackWolfPack
• Technology ahead of scheduleTechnology ahead of schedule
– cpus, disks, tapes,wires,..cpus, disks, tapes,wires,..
• OR Databases are evolvingOR Databases are evolving
• Parallel DBMSs are evolvingParallel DBMSs are evolving
• HSM still immatureHSM still immature

63
OutlineOutline
• The challenge: Building GIANT data storesThe challenge: Building GIANT data stores
– for example, the EOS/DIS 15 PB systemfor example, the EOS/DIS 15 PB system
• Conclusion 1Conclusion 1
– Think about MOX and SCANSThink about MOX and SCANS
• Conclusion 2:Conclusion 2:
– Think about ClustersThink about Clusters
– SMP reportSMP report
– Cluster reportCluster report