1 anova greg c elvers. 2 multi-level experiments often the research that psychologists perform has...
TRANSCRIPT
1
ANOVA
Greg C Elvers

2
Multi-Level Experiments
Often the research that psychologists perform has more conditions than just the control and experimental conditions
You might want to compare the effectiveness of two treatments to each other and to no treatment
Such research designs are called multi-level because there are more than two levels to the independent variable
3
Multiple t Tests
How would you analyze data from a multi-level experiment?
Given what we know so far, our only real option would be to perform multiple t-tests
The problem with this approach to the data analysis is that you might have to perform many, many t-tests to test all possible combinations of the levels
4
Multiple t-Tests
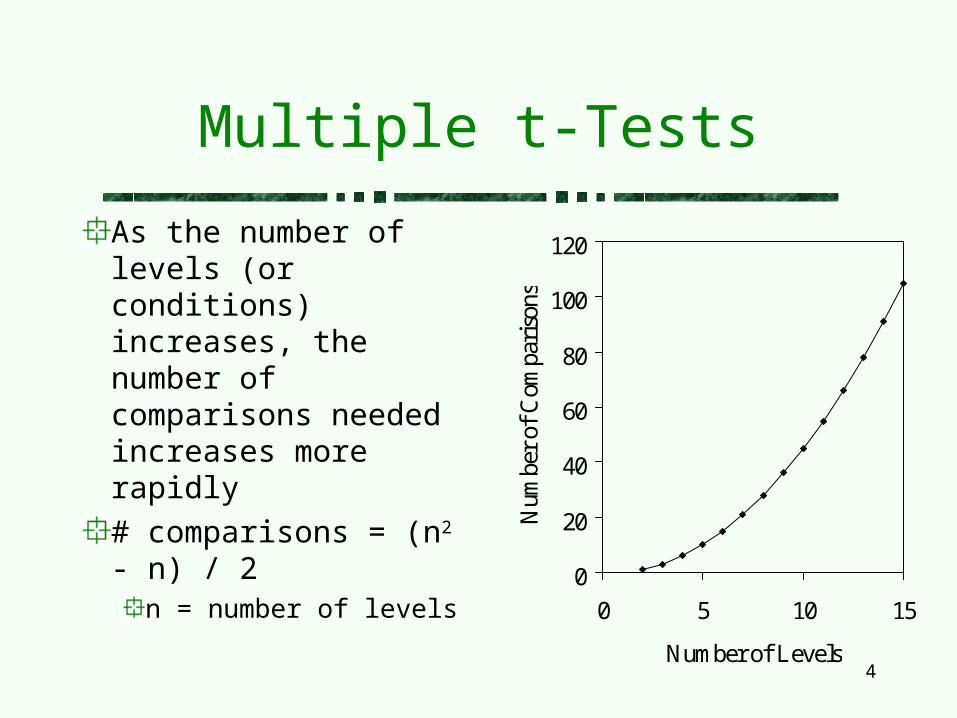
As the number of levels (or conditions) increases, the number of comparisons needed increases more rapidly
# comparisons = (n2 - n) / 2
n = number of levels 0
20
40
60
80
100
120
0 5 10 15
Number of Levels
Num
ber
of C
ompa
riso
ns
5
Why Not Perform Multiple t Tests?
With a computer, it is easy, quick, and error-free to perform multiple t-tests, so why shouldn’t we do it?
The answer lies in is the probability of making a Type-I error, or incorrectly rejecting H0 when H0 is true
applies to a single comparisonIt is correctly called comparison wise
6
Why Not Perform Multiple t Tests?
What happens to the probability of making at least 1 Type-I error as the number of comparisons increases?
It increases too
The probability of making at least one Type-I error across all of your inferential statistical tests is called familywise or fw
7
fw
If the probability of making a Type-I error on a given comparison is given by , what is the probability of making at least 1 Type-I error when you make n comparisons?
The simplest way to solve this problem is to realize that p(at least 1 Type-I error in n comparisons) + p(no Type-I errors in n comparisons) = 1
So, fw = 1 - p(no Type-I errors)

8
fw
p(no Type-I errors in n comparisons) = p(no Type-I error on the 1st comparison) * p(no Type-I error on the 2nd comparison)* …* p(no Type-I error on the nth comparison)
p(no Type-I errors in n comparisons) = p(no Type-I error on 1 comparison)n
p(no Type-I error on 1 comparison) = 1 -
9
fw
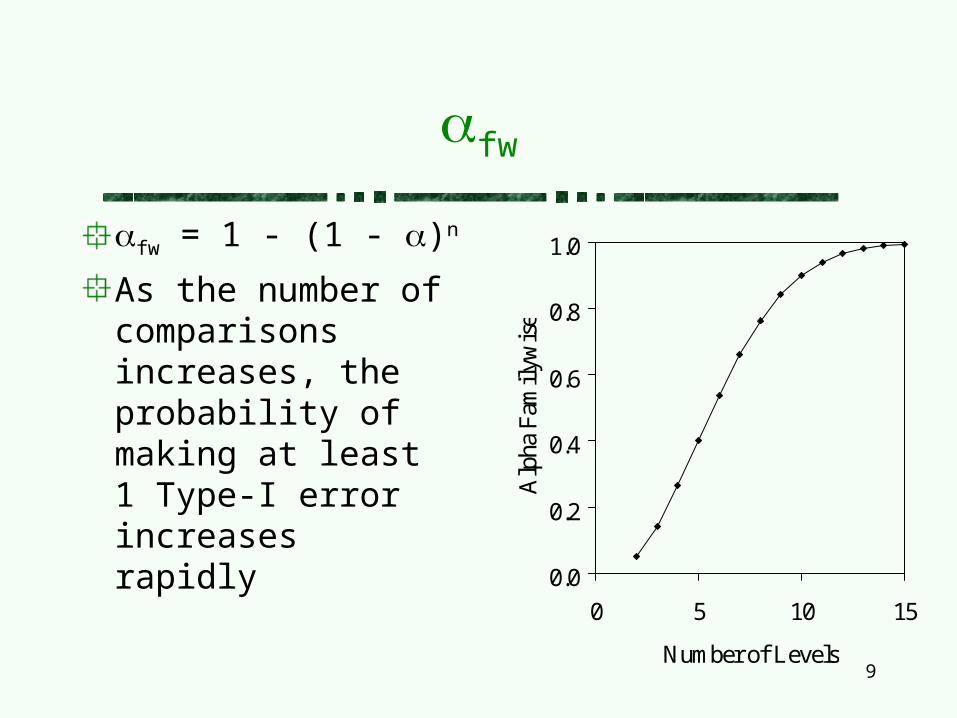
fw = 1 - (1 - )n
As the number of comparisons increases, the probability of making at least 1 Type-I error increases rapidly
0.0
0.2
0.4
0.6
0.8
1.0
0 5 10 15
Number of Levels
Alp
ha F
amil
ywis
e

10
Why Not Multiple t-Tests?
Performing multiple t-tests is bad because it increases the probability that you will make at least one Type-I error
You can never determine which statistically significant results, if any, are probably due to chance
11
ANOVA
Part of the solution to this problem rests in a statistical procedure known as the analysis of variance or ANOVA for short
ANOVA replaces the multiple comparisons with a single omnibus null hypothesis
Omnibus -- covers all aspects
In ANOVA, H0 is always of the form:H0: 1 = 2 = 3 = …. = n
That is, H0 is that all the means are equal
12
ANOVA Alternative Hypothesis
Given the H0 and H1 must be both mutually exclusive and exhaustive, what is H1 for ANOVA?
Why isn’t this H1?H1: 1 2 3 …. n
In ANOVA, the alternative hypothesis is always of the form:H1: not H0

13
Two Estimates of Variance
ANOVA compares two estimates of the variability in the data in order to determine if H0 can be rejected:
Between-groups variance
Within-groups variance
Do not confuse these terms with between-subject and within-subjects designs
14
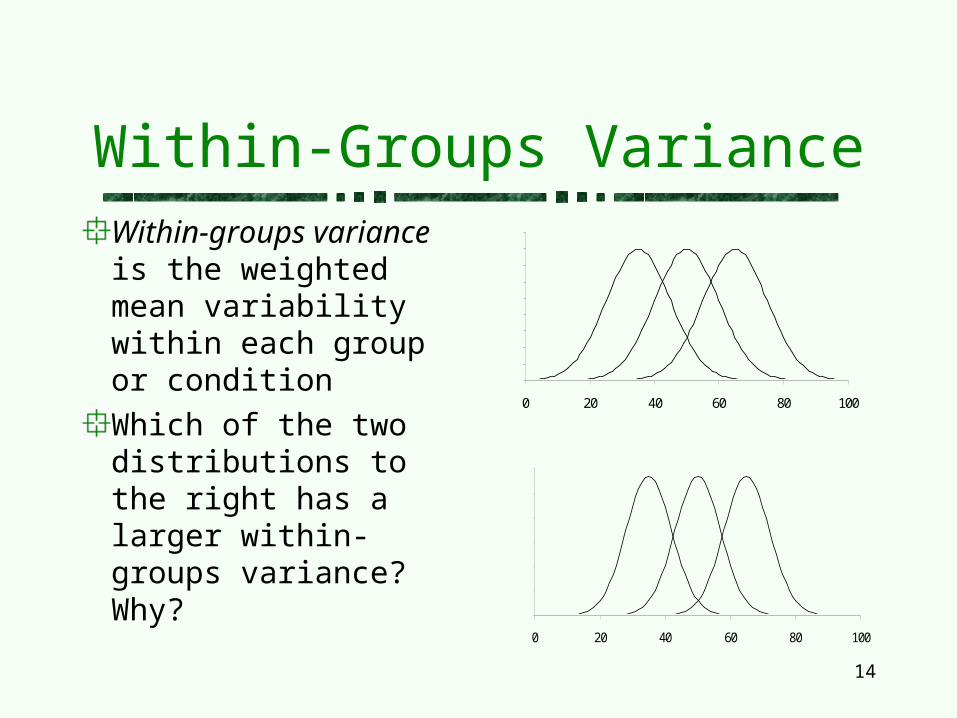
Within-Groups VarianceWithin-groups variance is the weighted mean variability within each group or condition
Which of the two distributions to the right has a larger within-groups variance? Why?
0 20 40 60 80 100
0 20 40 60 80 100
15
Within-Groups Variance
What causes variability within a group?Within-groups variation is caused by factors that we cannot or did not control in the experiment, such as individual differences between the participants
Do you want within-group variability to be large or small?
Within-groups variation should be as small as possible as it is a source of error
16
Between-Groups Variance
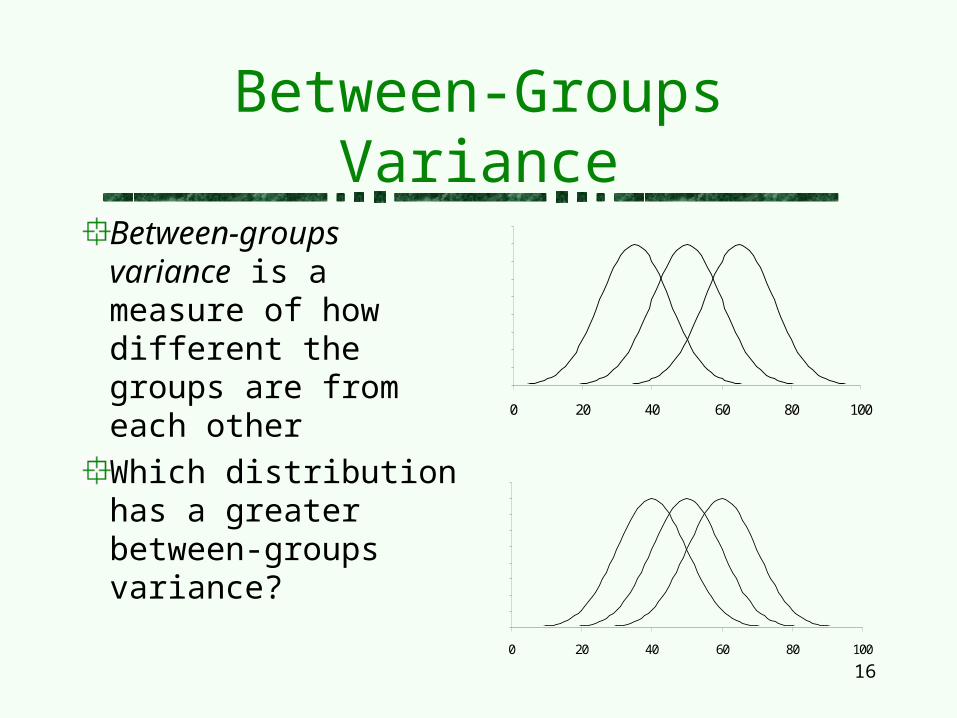
Between-groups variance is a measure of how different the groups are from each other
Which distribution has a greater between-groups variance?
0 20 40 60 80 100
0 20 40 60 80 100
17
Sources of Between-Groups Variance
What causes, or is the source of, between-groups variance? That is, why are not all the groups identical to each other?
Between-groups variance is partially caused by the effect that the treatment has on the dependent variable
The larger the effect is, the more different the groups become and the larger between-groups variance will be

18
Sources of Between-Groups Variance
Between-groups variance also measures sampling error
Even if the treatment had no effect on the dependent variable, you still would not expect the distributions to be equal because samples rarely are identical to each other
That is, some of the between-groups variance is due to the fact that the groups are initially different due to random fluctuations (or errors) in our sampling

19
Variance Summary
Within-groups variance measures error
Between-groups variance measures the effect of the treatment on the dependent variable and error

20
F Ratio
Fisher’s F ratio is defined as:
iancevarerror
iancevarerroriancevarDVontreatmentofeffectF
iancevargroupswithin
iancevargroupsbetweenF
21
F Ratio
What should F equal if H0 is true?
When H0 is true, then there is no effect of the treatment on the DV
Thus, when H0 is true, we have error / error which should equal 1
What should F be if H0 is not true?
When H0 is not true, then there is an effect of the treatment on the DV
Thus, when H0 is not true, F should be larger than 1

22
How Big Does F Have to Be?
Several factors influence how big F has to be in order to reject the null hypothesis
To reject H0, the calculated F must be larger than the critical F which can be found in a table
Anything that makes the critical F value large will make it more difficult to reject H0

23
Factors That Influence the Size of the Critical F
level -- as decreases, the size of the critical F increases
Sample size -- as the sample size increase, the degrees of freedom for the within-groups variance increases, and the size of the critical F decreases
As the sample becomes larger, it becomes more representative of the population

24
Factors That Influence the Size of the Critical F
Number of conditions -- as the number of conditions increase, so does the degrees of freedom for the between-groups variance term
If the degrees of freedom for the denominator are larger than 2, then the size of the critical F will decrease as the number of conditions increases
The opposite is true if the degrees of freedom for the denominator equal 1 or 2
25
Factors That Influence the Size of the Observed F
Experimental Control -- as experimental control increases, within-groups variance decreases, and the observed F increases

26
ANOVA Summary Table
SS = sum of squares -- the numerator of the variance formula = (X-)2
df = degrees of freedom -- the denominator of the variance formuladf between-groups = # levels - 1df within-groups = (# participants in a condition - 1)MS = SS / df
F = MSbetween-groups / MSwithin-groups
p = p value (significance level)
Source SS df MS F pBetween-group 10 1 10 5 < .05Within-group 20 10 2Total 30 11

27
ANOVA Assumptions
ANOVA makes certain assumptions:Sampling error is normal, or Gaussian in shape, and is centered around the mean of the distribution
Homogeneity of variance -- the variability within each group is approximately equal
Independence of observations

28
ANOVA Assumptions
ANOVA is fairly robust (it will give good results even if the assumptions are violated) to the normality assumption and the homogeneity of variance assumption as long as:
the number of participants in each group is equal
the number of participants in each group is fairly large
29
Multiple Comparisons
ANOVA only tells us if there is an effectThat is, are the means of the groups not all equal?
ANOVA does not tell us which means are different from which other means
Multiple comparisons are used to determine which means are probably different from which other means

30
Multiple Comparisons
Multiple comparisons are not fundamentally different from performing a t-test
That is, both multiple comparisons and t-tests answer the same question: are two means different from each other
The difference is that the multiple comparisons protect us from making a Type-I error even though we perform many such comparisons

31
Multiple Comparisons
There are many types of multiple comparison
E.g. Tukey, Newman-Keuls, Dunnett, Scheffé, Bonferroni
There is little agreement about which particular one is best
The different tests trade off statistical power for protection from Type-I errors
32
Tukey Tests
We will consider only the Tukey test; other people may feel that other tests are more appropriate
The Tukey test offers reasonable protection from Type-I errors while maintaining reasonable statistical power
33
Tukey Tests
You should perform Tukey tests only when two criteria have been met:
There are more than two levels to the IV
The IV is statistically significant
34
Steps in Performing Tukey Tests
Write the hypothesesH0: 1 = 2
H1: 1 2
Specify the level = .05
35
Steps in Performing Tukey Tests
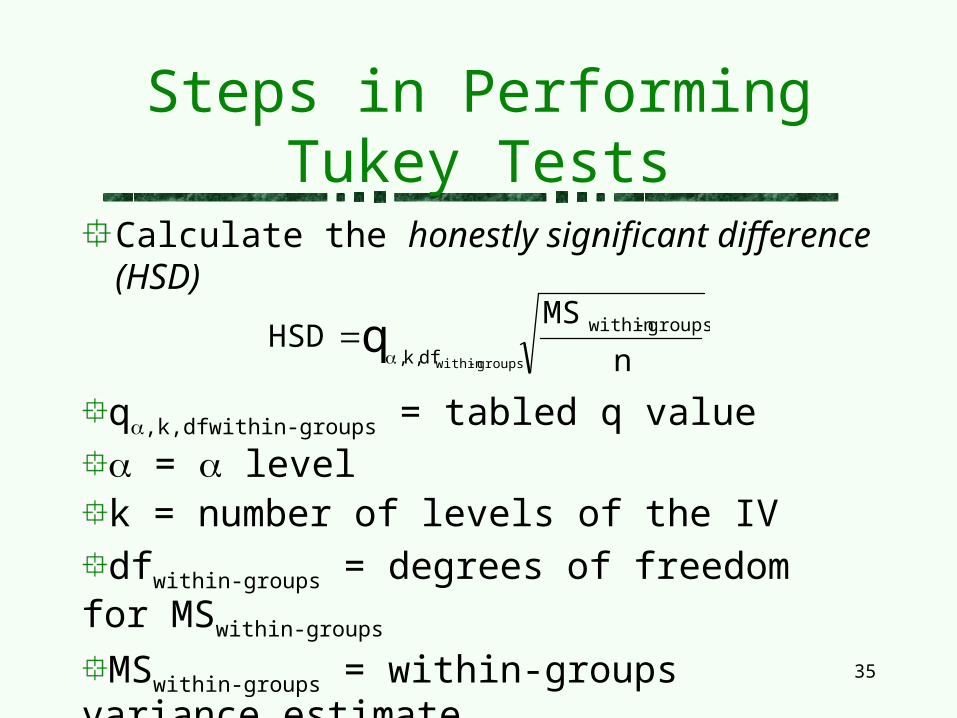
Calculate the honestly significant difference (HSD)
n
MSHSD groupswithin
df,k,q
groupswithin
q,k,dfwithin-groups = tabled q value
= levelk = number of levels of the IV
dfwithin-groups = degrees of freedom for MSwithin-groups
MSwithin-groups = within-groups variance estimate
n = number of participants
36
Steps in Performing Tukey Tests
Take the difference of the means of the conditions you are comparing
If the difference of the means is at least as large as the HSD, you can reject H0
Repeat for whatever other comparisons need to be made

37
A-Priori vs A-Posteriori Comparisons
The Tukey comparisons we have been talking about are post-hoc or a-posteriori (after the fact) comparisons
That is, we did not specify prior to the experiment that we would perform these particular comparisons
A-posteriori comparisons are the most frequently used comparisons in the social sciences
38
A-Priori vs A-Posteriori Comparisons
There are other comparison techniques that are appropriate to use when, prior to the study, you have decided which comparisons you would like to make
These comparisons are a-priori (before the fact) comparisons
39
A-Priori vs A-Posteriori Comparisons
A-posteriori comparisons should only be performed after finding a statistically significant result in an ANOVA
This helps to reduce the probability of making a Type-I error
A-priori comparisons can be, but need not be, preceded by an ANOVA
A-priori tests tend to have greater statistical power than their a-posteriori counterparts

40
Between- vs Within-Subjects Designs
Like the t-test, there are separate procedures to be used when you have between-subjects and when you have within-subjects designs
Be sure to use the appropriate test
SPSS (and many other statistical programs) call within-subjects ANOVA repeated measures ANOVA