1 animal feeding operations: air quality issues and options william schrock office of air quality...
TRANSCRIPT

1
Animal Feeding Operations: Air Quality Issues and Options
William SchrockOffice of Air Quality Planning & Standards, US EPA
Presentation at the NACAA Permitting WorkshopPhoenix, AZ
February 27, 2007

2
Overview
• Introduction
• National Air Emissions Monitoring Study
• Short-term Goals for EPA

3
Landscape
• Animals being concentrated
• Public air quality complaints abundant
• Lawsuits increasing against farms
• CAA applicability confusing
• Political fallout likely for either inaction or heavy-handed control

4
• EPA & USDA asked National Academy of Science (NAS) to conduct the AFO air emissions study
• NAS study conclusions:– No reliable emission factors for AFO exist– Additional data needed to develop estimating methodologies– Current methods for estimating emissions not appropriate– Use process-based approach
• Consent agreement developed in response to:– Public concerns– NAS report
• Consent agreement developed by:– EPA– Industry representatives
• Proposed agreement coordinated with:– Agricultural industry representatives– State & local government officials– Environmental organizations– Citizen groups
Agreement Overview

5
• What is the Agreement? Voluntary consent agreement open to contract growers and integrators. Industry agrees to pay to conduct emissions testing. Targeted AFO sectors:
– Swine– Poultry
• Layers• Broilers• Turkey
– Dairy
• Federal Register Notices:– Signed on Jan. 21, 2005– Published on Jan. 31, 2005 (70 FR 4958)– “Initial” public comment period closed on March 2, 2005– Re-opening comment period from April 1 through May 2, 2005– Extending signup period to July 1, 2005
• Information available at:– www.epa.gov/fedrgstr– www.epa.gov/airlinks/airlinks3.html– www.epa.gov/compliance/resources/agreements/caa/cafo-agr-0501.html
Agreement Overview (cont)

6
Monitoring Study - Signups
• EPA received approximately 2,700 agreements representing over 13,000
farms. Number of Farms Represented in AFO Consent Agreement
Dairies, 4% of all Farms
Swine, 42% of all Farms
Broilers, 35% of all Farms
Layers, 19% of all Farms

7
Monitoring Study - Overview
• Purpose: gather data for developing emission estimating methodologies
• Funding provided by participating AFO• Monitor for:
– Particulate matter– Hydrogen sulfide– Volatile organic compounds– Ammonia
• Monitoring anticipated to begin in early 2007 and continue for 2 years
• Data made available to the public

8
Monitoring Study – Site Selection
• Focuses on three AFO sectors– Swine– Poultry– Dairy
• Types of operations– Sow, nursery, finisher (swine)– layers, broilers, hatchery, pullet (poultry)– Dairy
• Manure Management Techniques– Liquid system– Solid system
• Regional representation• Proximity to potential principal investigators

9
Monitoring Study – Site Selection

10
Monitoring Study – Work Plan Development
• EPA has approved the monitoring plan & sites:– Approved on November 29, 2006 – Plan included:
– Quality Assurance Project Plans (1 each for lagoons and barns)– Standard Operating Procedures (76 unique SOP’s drafted)
– 24 monitoring sites approved
• EPA anticipates monitoring will begin in Spring ‘07

11
Monitoring Study – The Challenges
Changing Climatic ConditionsPartially Enclosed and Naturally Ventilated
Changing Feed Rations
Animal MovementsLarge Open Sources
12
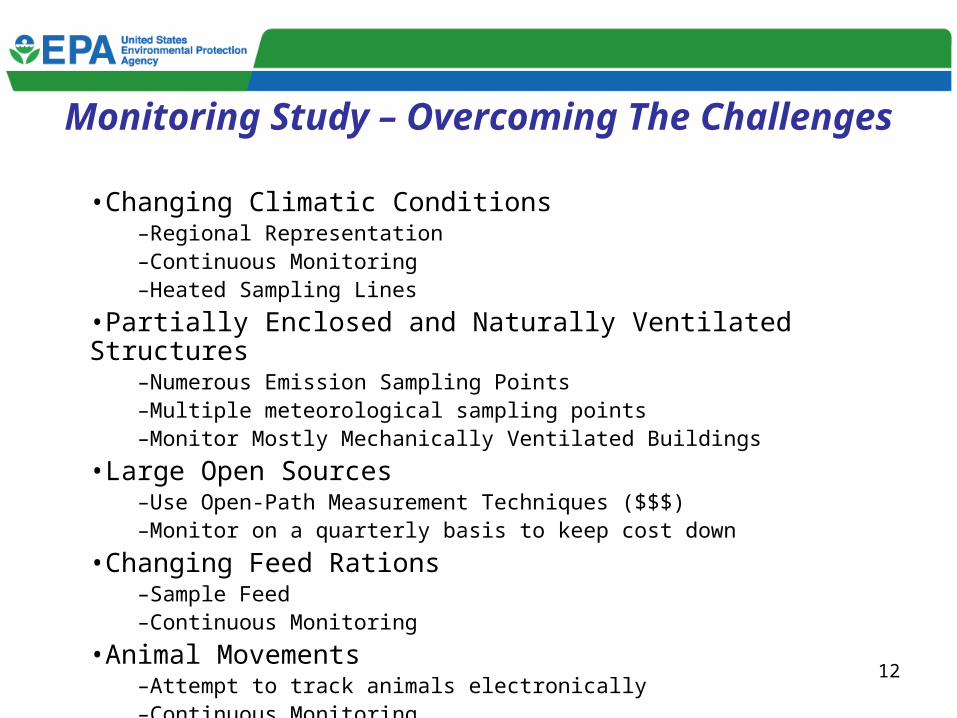
Monitoring Study – Overcoming The Challenges
•Changing Climatic Conditions–Regional Representation–Continuous Monitoring–Heated Sampling Lines
•Partially Enclosed and Naturally Ventilated Structures–Numerous Emission Sampling Points–Multiple meteorological sampling points–Monitor Mostly Mechanically Ventilated Buildings
•Large Open Sources–Use Open-Path Measurement Techniques ($$$)–Monitor on a quarterly basis to keep cost down
•Changing Feed Rations–Sample Feed–Continuous Monitoring
•Animal Movements–Attempt to track animals electronically–Continuous Monitoring

13
Approach to Naturally Ventilated & Partially Enclosed
N
Thermocouple
Air samplingRH/Temp probePM10, continuousActivity sensor
TSP, gravimetric
PM2.5, gravimetric
Wind sensorSolar sensorS
Ultrasonic anemometer
187.5
31.4
Instrument shelter
Heated raceway
61.0 0FIS
Differential Pressure
31.4
S
2 2 2
4444 44
2 2 2
1 3 3 3 3 3 3
1
7 7 7
10 9 99 9 9 9
77 7 10
6 8 8 8 8 8 8
6
Exercise lots between barns
11
Gas sampling location group
5
5
Barn 2 (103 ft x 615 ft)
Barn 1 (103 ft x 615 ft)

14
Approach for Large Open Sources

15
Approach for Large Open Sources
Open-Path FTIR Concept
wind

16
What’s Next?
• Order equipment and assemble monitoring trailers – 6 months• Train staff and mobilize equipment to the field – concurrent w/
above• Begin data collection – staggered throughout Spring 07• Data collection – Spring 07 + 2 years• Complete data analysis and publish Emission Estimating
Methodologies – 18 months after completion of data collection• Participants must comply with any applicable requirements – 120
days after publication of Emission Estimating Methodology

17
Goals for Next 2-3 Years
• Settle issues of CAA requirements– Emission estimation (e.g., emission factors,
potential to emit)– Source definition– Applicability cutoff (i.e., size cutoff)– Fugitive/non-fugitive– Control technology effectiveness– Monitoring, reporting and recordkeeping
• Find an Ag-appropriate approach to Title V and PSD/NSR

18
Goals (cont.)
• Resolve ambient air quality issues
• Provide catalyst for best management practices (BMP) implementation

19
Thanks.
Questions?