1. an investigation into the beneficial effects of ... investigation into the beneficial effects of...
TRANSCRIPT
FRGP – 2010 - 02
1
An Investigation into the Beneficial Effects of Intentionally Exposing Oysters to Air During Their Normal Growing Season
Dennis K. Gryder, Principal Investigator Michael Oesterling, Virginia Institute of Marine Sciences
Richard H. Couch, Technical Assistant for Electronics
October 27, 2010
Final Report for Project # FRGP – 2010 - 02
Abstract
This report describes a field experiment which was primarily intended to quantify the beneficial effects of intentionally exposing oysters to air during their growing period. Test samples were submerged in the water at different depths and the normal tidal activity uncovered the samples for differing percentages of the tide cycle. The amount of time each sample was in air was monitored by a specially designed electronic instrument and logged. The logged data was processed into graphical data showing the growth rate of the test subjects with respect to exposure. The occurrence of Polydora was also monitored during periodic inspections and correlated with the amount of air exposure. A secondary objective of the experiment was to evaluate external shell fowling.
FRGP – 2010 - 02
2
Table of Contents
Cover Sheet………………………………………………………………… 1 Abstract……………………………………………………………………..1 Table of Contents…………………………………………………………...2 Introduction…………………………………………………………………3 Purpose of Experiment……………………………………………………...3 Experiment Methodology…………………………………………………...3 Special Purpose Equipment…………………………………………………4 Instrumentation and Sensors………………………………… ……..4 Data Collection……………………………………………………… ……...6 Data Analysis……………………………………………………………..….6 Secondary Experiment Objective……………………………………….…...7 Observations………………………………………………………………....7 Conclusions……………………………………………………………….…7 Appendix 1. Dock Summaries Appendix 2. Inspection Summaries Appendix 3. Parasite Summary Appendix 4. Photographs of inspected oysters

FRGP – 2010 - 02
3
An Investigation into the Beneficial Effects of Intentionally Exposing
Oysters to Air During Their Normal Growing Season
Dennis K. Gryder, Principal Investigator
Michael Oesterling, VIMS Richard H. Couch, Technical Assistant
Introduction
Mud blister in oysters, caused by the marine worm Polydora, represent a significant problem for commercial oyster culturists. The presence of Polydora can negatively impact the price that growers receive and/or limit the marketability of their product. While the severity of Polydora infestations will vary spatially and temporally, their presence is universally recognized as a potential problem for oyster growers.
Purpose of Experiment
The purpose of the experiment was to quantify the beneficial effects of intentional periodic and repetitive exposure of oysters to air during their normal growing season. We believe that with increasing exposure, there will be a reduction in the severity of Polydora infestations. A secondary objective of the experiment was to evaluate external shell fowling.
Experiment Methodology
The experiment was conducted between March and October 2010 at the Principal Investigators residence located on Lane’s Creek in Mathews, VA. The property has a dock that extends approximately 160 feet into Lane’s Creek. Cages housing the test subjects were placed on the bottom at four
different locations along the dock. These locations were selected based on estimates of bottom depth with “typical” or “expected” tidal conditions for the months during which the experiment was conducted. There were four separate sample cages in the test population. They were designated as Cages 1, 2, 3 and 4. All four cages actually rested on the bottom but were located at different distances from the beginning of the dock nearest the edge of the water. Cages 1, 2, and 3 were located at depths which would expose them to increasingly shorter periods of time out of the water as their depths increased. Cage 4 was located on the bottom where it would never be out of the water. In this situation, cages 1 and 2 were on a part of the bottom that was sandy and cages 3 and 4 were on a part that was muddy.
Two thousand Rappahannock Diploid oyster spat were purchased for use as test subjects. They were divided into four groups of 500 animals each and placed into four separate fine mesh bags as shown in the photos below.
1. Four groups of 500 spat each, ready to be placed in fine mesh bags.
FRGP – 2010 - 02
4
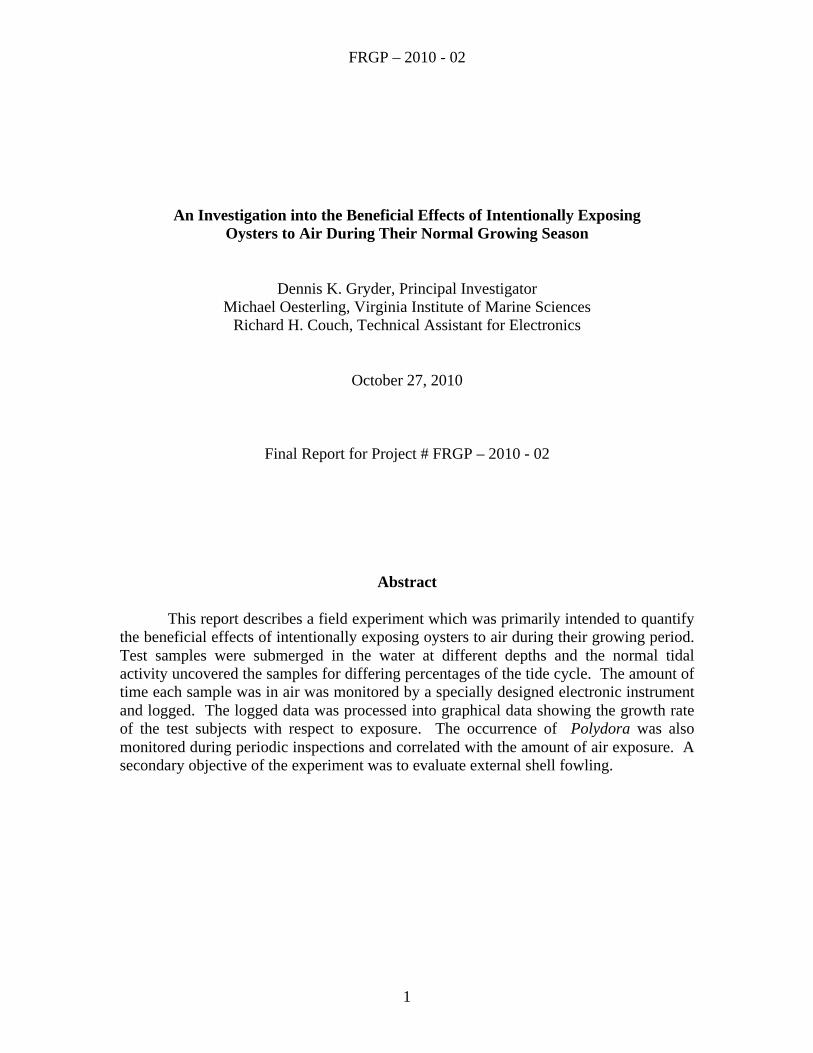
2. Four groups of 500 spat each, in fine mesh bags.
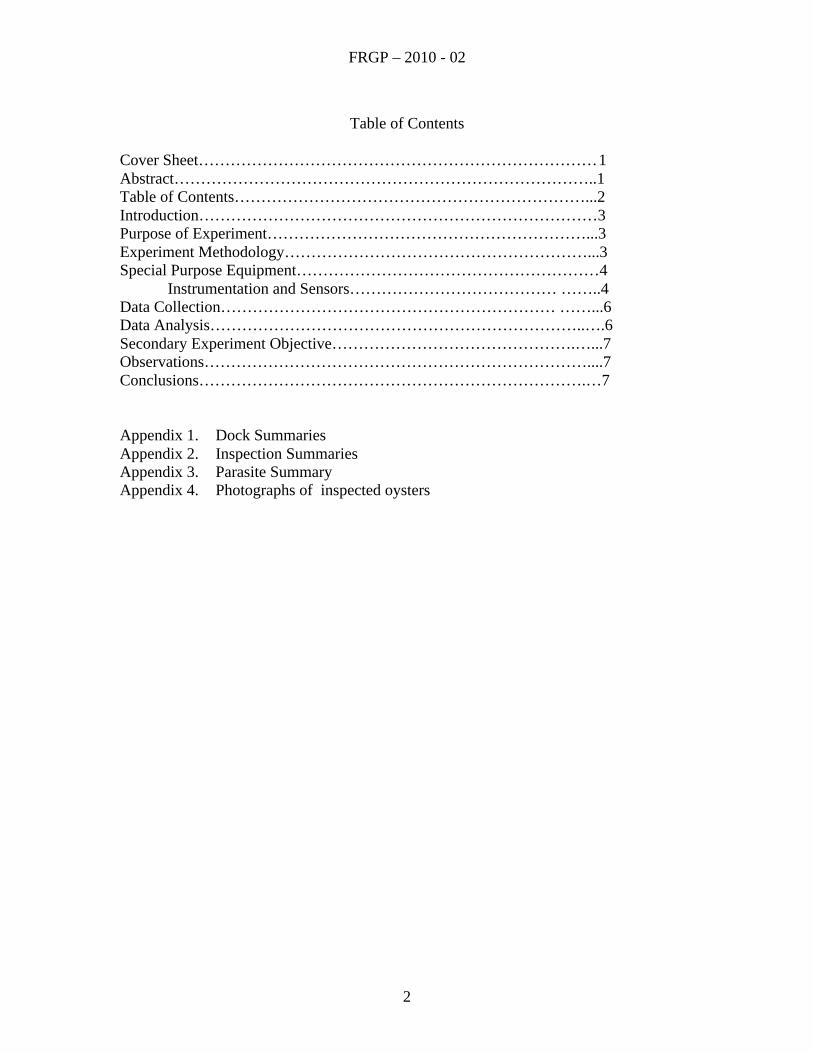
3. Small mesh bag in cage ready to be placed into the water.
4. Long view of dock showing cages ready to go into the water.
5. A side view of the dock with the three test cages resting on the bottom next to the dock. This picture was taken at low tide. From left to right are Cages 1, 2 and 3. Cage 4 is not visible in this photo. Four cages were constructed from four-foot wide oyster wire with one-inch mesh. Cages were 20 inches wide by four inches thick with five-inch high “legs” to allow them to rest slightly above the bottom. Oyster spat were initially contained in small, fine mesh bags until they were large enough to be contained by the ¼” mesh of the next size bags and were then removed from the bags. Cages were placed such that their bottom surfaces, upon which the oysters rested, were 46”, 49.5”, 52.5” and 68” below the top surface of the dock, which was the reference surface for the depth measurements.
Special Purpose Equipment
Special purpose equipment consists of special sensors and instrumentation. These items are described below in this section.
Instrumentation and Sensors
The instrumentation used in the experiment included measuring devices for observing rainfall, water salinity and

FRGP – 2010 - 02
5
temperature. Information from these devices were observed and recorded by hand in an experiment logbook.
6. Rain Gauge
The thermometer and the salinity meter, shown below, were mounted on opposite sides of a wooden handle which was dipped into the water by hand and allowed to reach equilibrium and then removed, read and logged.
7. Thermometer
8. Salinity Meter
A special-purpose instrument was designed and built to measure the period of time each cage was above the water. Three float switches that opened and closed as the tide changed sensed the rising and falling of the tides. When the water level fell below the float switches, the switches closed and a one pulse-per-second (pps) clock signal was connected to an electronic totalizer module which counted the number of seconds the switch was closed. When the tide rose the switch opened, the one pps clock was disconnected and the totalizer stopped counting. There was a float switch and a totalizer for each cage, except that there was no float switch for the Cage 4. When the totalizers were observed and recorded in the experiment logbook, typically at 10:00 am, they were reset to zero and the cycle began again.
FRGP – 2010 - 02
6
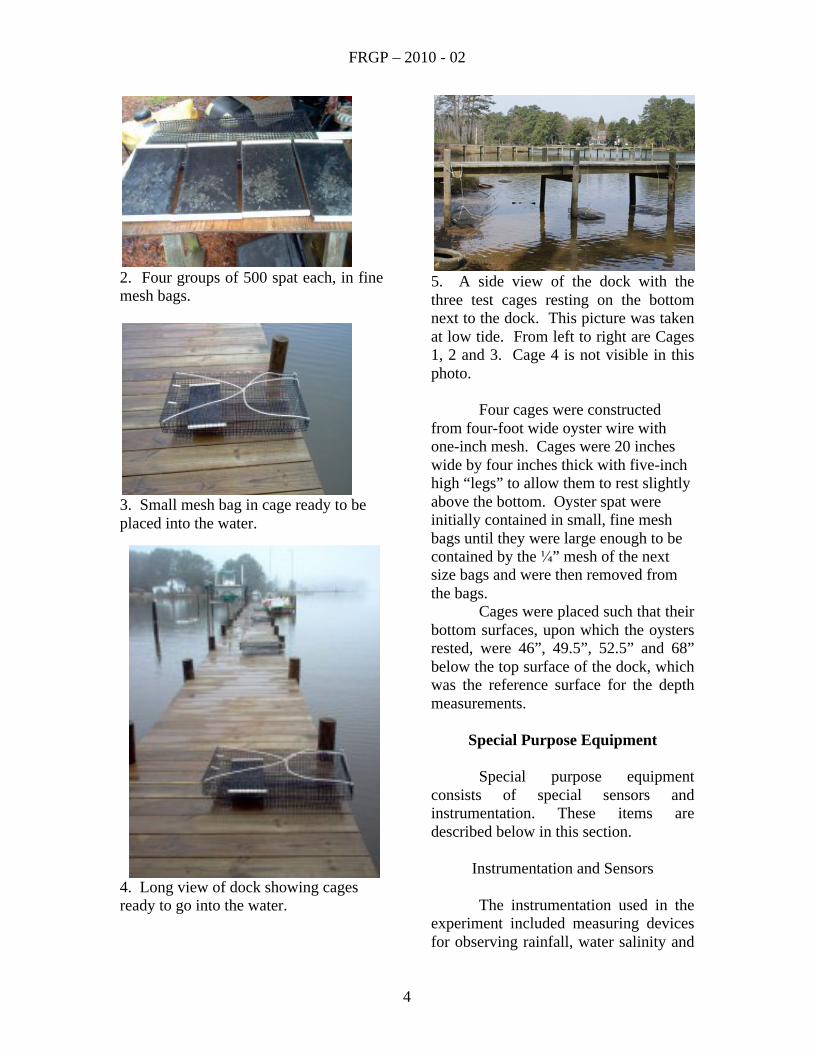
9. Electronics Box
The float switches were located near the instrumentation package on the dock and connected by water resistant cables to the instrument. The depths of the float switches were chosen to be equal to the depths of the cages housing the oysters. The instrument was powered by a 12-volt lead-acid storage battery, which was charged by a small solar panel. The instrument ran continuously and consumed very little energy.
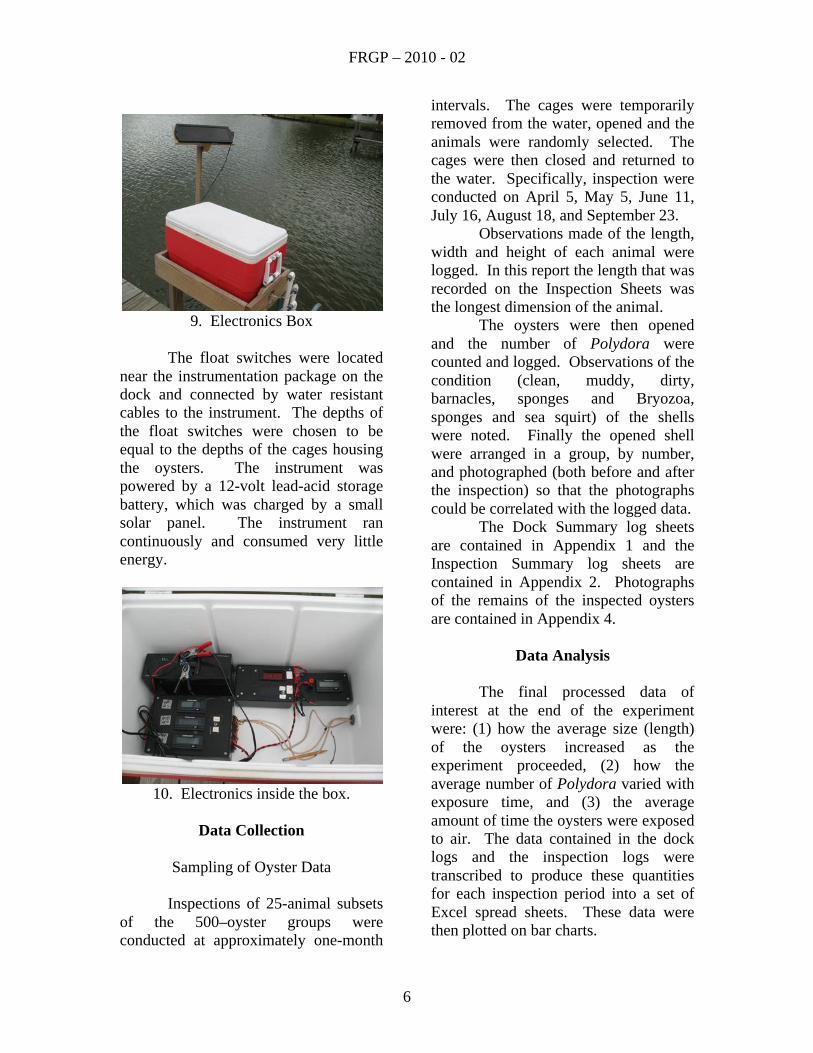
10. Electronics inside the box.
Data Collection
Sampling of Oyster Data
Inspections of 25-animal subsets
of the 500–oyster groups were conducted at approximately one-month
intervals. The cages were temporarily removed from the water, opened and the animals were randomly selected. The cages were then closed and returned to the water. Specifically, inspection were conducted on April 5, May 5, June 11, July 16, August 18, and September 23.
Observations made of the length, width and height of each animal were logged. In this report the length that was recorded on the Inspection Sheets was the longest dimension of the animal.
The oysters were then opened and the number of Polydora were counted and logged. Observations of the condition (clean, muddy, dirty, barnacles, sponges and Bryozoa, sponges and sea squirt) of the shells were noted. Finally the opened shell were arranged in a group, by number, and photographed (both before and after the inspection) so that the photographs could be correlated with the logged data.
The Dock Summary log sheets are contained in Appendix 1 and the Inspection Summary log sheets are contained in Appendix 2. Photographs of the remains of the inspected oysters are contained in Appendix 4.
Data Analysis
The final processed data of
interest at the end of the experiment were: (1) how the average size (length) of the oysters increased as the experiment proceeded, (2) how the average number of Polydora varied with exposure time, and (3) the average amount of time the oysters were exposed to air. The data contained in the dock logs and the inspection logs were transcribed to produce these quantities for each inspection period into a set of Excel spread sheets. These data were then plotted on bar charts.

FRGP – 2010 - 02
7
The processed data are presented in the Results Section. Except for cage 4, there are three bar charts for each sample: (1) mean size (length) in millimeters, (2) average number of Polydora per animal, and (3) average exposure to air in hours per day. Since the Cage 4 is always under water (except when it is removed to extract a monthly sample) there are no average exposure data for this sample.
Secondary Experiment
Objective
A secondary objective of the experiment was to study the buildup of parasites and mud on the exterior of the oysters. In addition to measuring the oysters and counting the Polydora inside the shell, a visual inspection of the outside was made and a count was made of barnacles, bryozoa, mussels, sponges and squirt. These data were recorded on the Inspection Log Sheets as well as the cleanliness of the shells as determined by how muddy they were. The animals inspected had very little mud on their shells. The results of these observations are presented in Appendix 3.
Observations
1. For the Cage 1 the average size of the oysters increased by 387% over the duration of the experiment. For the Cage 2 the average size of the oysters increased by 475% over the life of the experiment. As a result the oysters in the Cage 2 were 23% larger than those in the Cage 1. 2. Cages 1, 2 and 3 exhibited a small infestation of Polydora at the first inspection, ranging from an average of 0.25 to 0.52 per animal. For the first
five inspection periods, the average exposure for Cage 1 was between eight and ten hours per day, during which time the average Polydora per animal decreased to virtually zero. However, during the sixth inspection period, the average exposure to air fell dramatically from 9.2 hours per day to 4.6 hours per day and the average number of Polydora per animal rose to about four. Also during the sixth inspection the exposure time for the cage 2 fell from four hours to one hour per day and the average Polydora count rose from four to ten. 3. There are no significant statistical differences between the average number of Polydora per animal in Cages 3 and 4. 4. During Inspection 1 there was a cumulative total of only 2 parasites observed in the 100 animals inspected. Comparable results were obtained during inspections 2, 3 and 4. 5. Similar results occurred with respect to external shell fowling. In fact, the worst fowling occurred for Cage 4 in Inspection 6.
Conclusions
1. Based on Observation 1 above with respect to the Cage 1, it is reasonable to conclude that exposure to air inhibits the growth of the oysters. 2. It is also reasonable to conclude that the exposure to air reduces the oyster growth rate and results in a less desirable product in the marketplace. 3. In the research situation used in this experiment, the average number of Polydora were virtually identical for Cages 3 and 4.
FRGP – 2010 - 02
8
One possible explanation is that Cages 3 and 4 were both on the muddy part of the bottom while Cages 1 and 2 were on the sandy part of the bottom closer to the shore. The solution to this problem may be to move the Cages further out along the dock and suspend all them above the bottom. This would guarantee that no cage is ever in the mud. 4. In retrospect, we have concluded that the totalizers do not need to be read and logged every day. Since the exposure hours logged on a daily basis are averaged together for the entire month, it would be sufficient to log the readings on a weekly basis, or whenever the equipment is checked to make sure it is operating properly.

FRGP 2010 - 02
Page 1 of 7
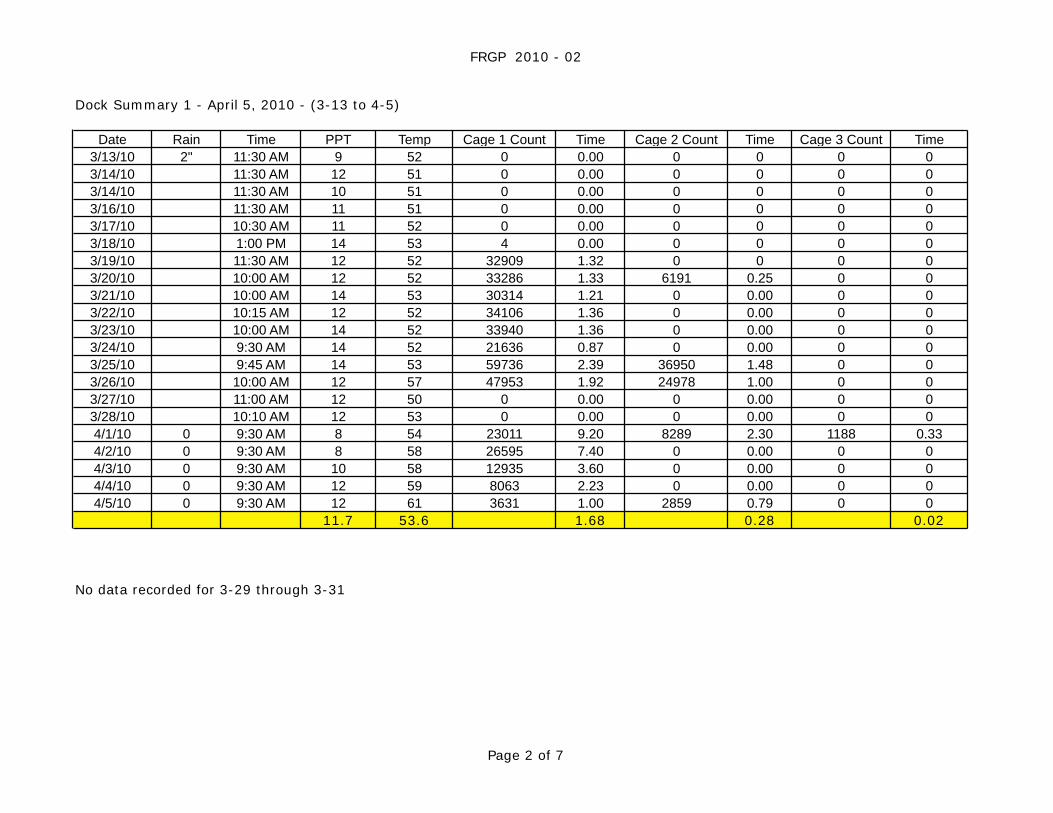
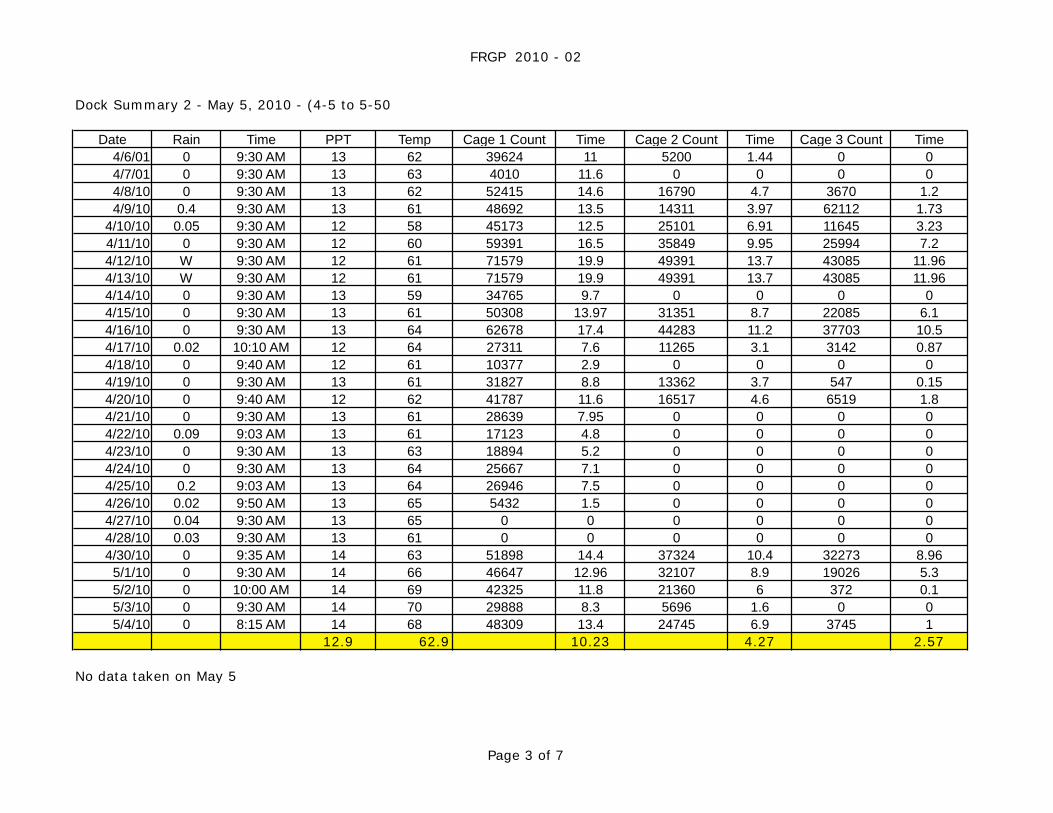
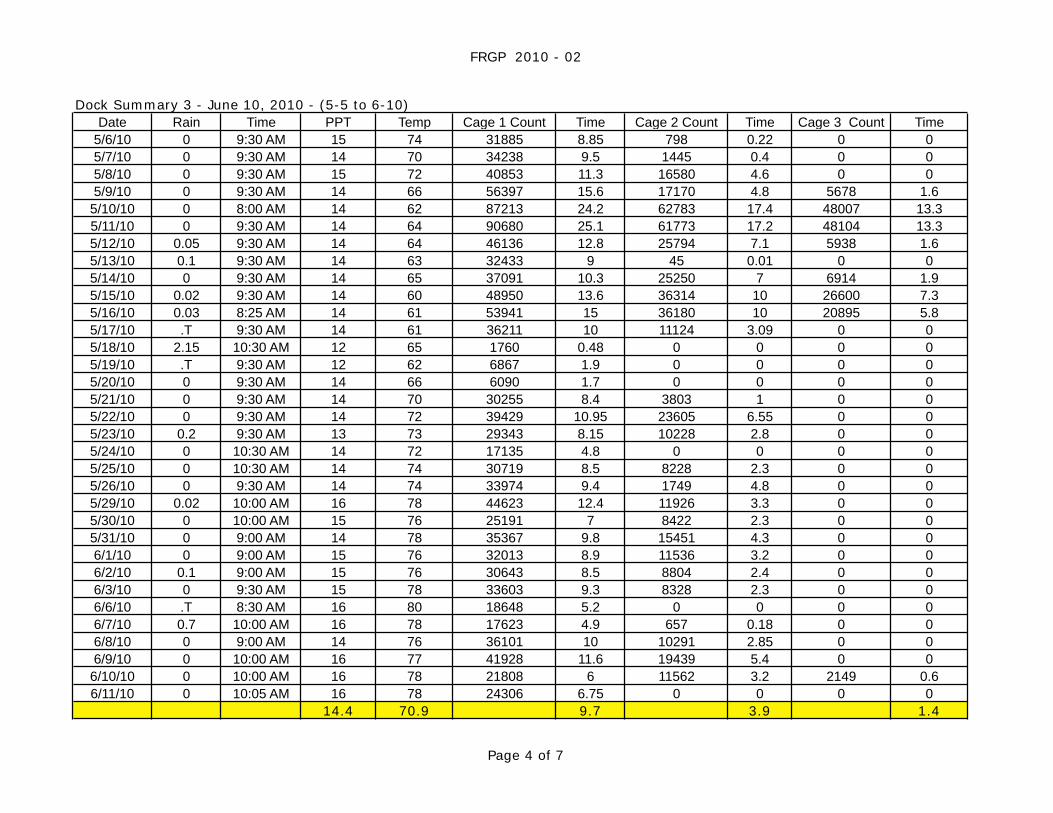
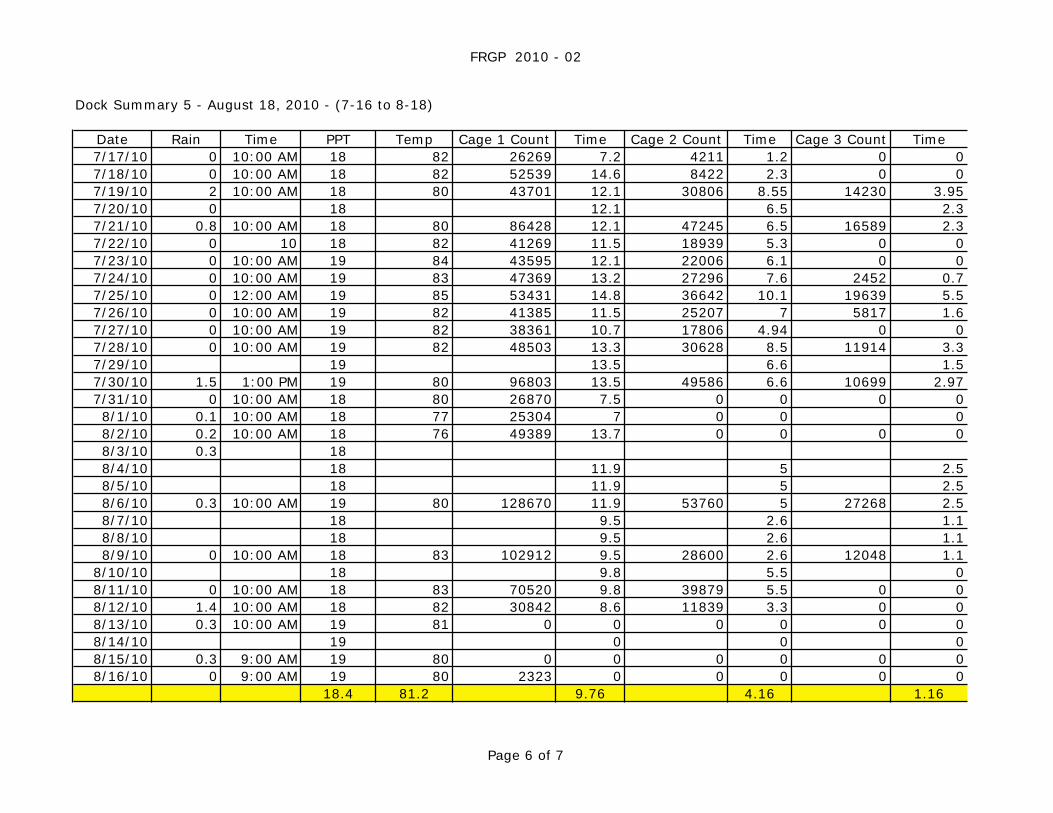
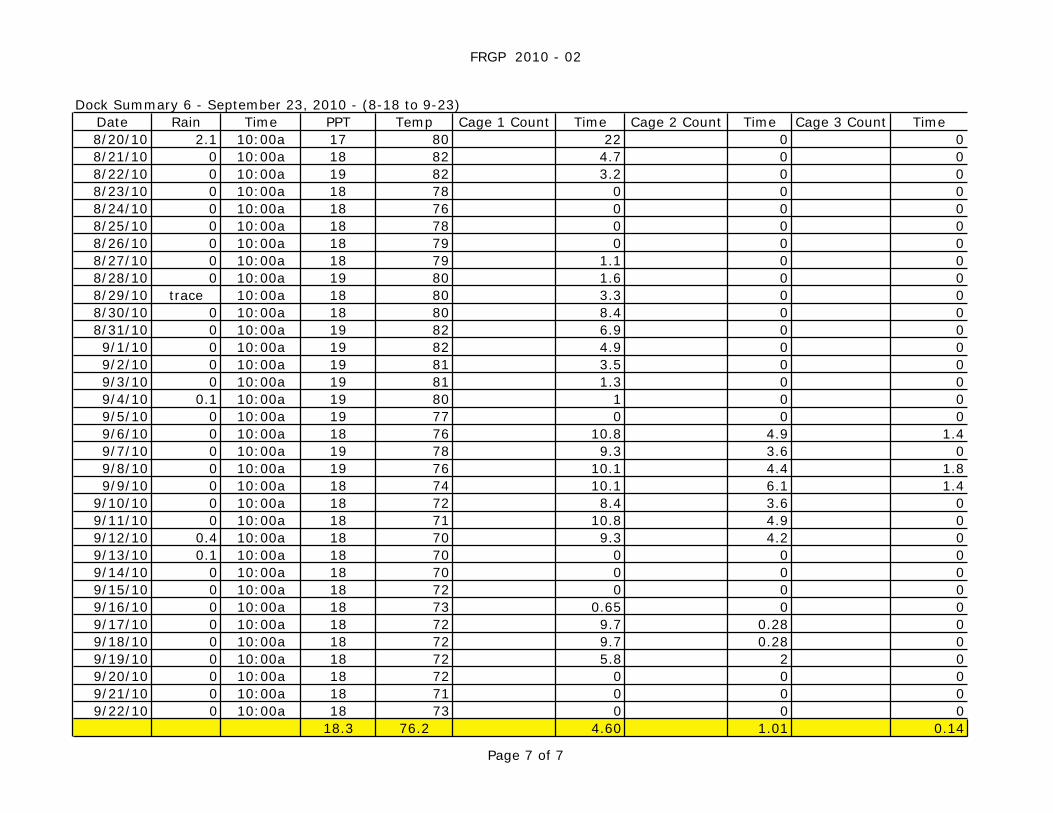
Dock Summary 1 - April 5, 2010 - (3-13 to 4-5)Dock Summary 2 - May 5, 2010 - (4-5 to 5-50Dock Summary 3 - June 10, 2010 - (5-5 to 6-10)Dock Summary 4 - July 16, 2010 - (6-10 to 7-16)Dock Summary 5 - August 18, 2010 - (7-16 to 8-18)Dock Summary 6 - September 23, 2010 - (8-18 to 9-23)
Dock Summaries are a tabulation of the daily observations of rain, salinity, temperature and totalizer counts (time-out-of-water in seconds).
Appendix 1 Dock Summary Sheets
FRGP 2010 - 02
Page 2 of 7
Dock Summary 1 - April 5, 2010 - (3-13 to 4-5)
Date Rain Time PPT Temp Cage 1 Count Time Cage 2 Count Time Cage 3 Count Time3/13/10 2" 11:30 AM 9 52 0 0.00 0 0 0 03/14/10 11:30 AM 12 51 0 0.00 0 0 0 03/14/10 11:30 AM 10 51 0 0.00 0 0 0 03/16/10 11:30 AM 11 51 0 0.00 0 0 0 03/17/10 10:30 AM 11 52 0 0.00 0 0 0 03/18/10 1:00 PM 14 53 4 0.00 0 0 0 03/19/10 11:30 AM 12 52 32909 1.32 0 0 0 03/20/10 10:00 AM 12 52 33286 1.33 6191 0.25 0 03/21/10 10:00 AM 14 53 30314 1.21 0 0.00 0 03/22/10 10:15 AM 12 52 34106 1.36 0 0.00 0 03/23/10 10:00 AM 14 52 33940 1.36 0 0.00 0 03/24/10 9:30 AM 14 52 21636 0.87 0 0.00 0 03/25/10 9:45 AM 14 53 59736 2.39 36950 1.48 0 03/26/10 10:00 AM 12 57 47953 1.92 24978 1.00 0 03/27/10 11:00 AM 12 50 0 0.00 0 0.00 0 03/28/10 10:10 AM 12 53 0 0.00 0 0.00 0 04/1/10 0 9:30 AM 8 54 23011 9.20 8289 2.30 1188 0.334/2/10 0 9:30 AM 8 58 26595 7.40 0 0.00 0 04/3/10 0 9:30 AM 10 58 12935 3.60 0 0.00 0 04/4/10 0 9:30 AM 12 59 8063 2.23 0 0.00 0 04/5/10 0 9:30 AM 12 61 3631 1.00 2859 0.79 0 0
11.7 53.6 1.68 0.28 0.02
No data recorded for 3-29 through 3-31
FRGP 2010 - 02
Page 3 of 7
Dock Summary 2 - May 5, 2010 - (4-5 to 5-50
Date Rain Time PPT Temp Cage 1 Count Time Cage 2 Count Time Cage 3 Count Time4/6/01 0 9:30 AM 13 62 39624 11 5200 1.44 0 04/7/01 0 9:30 AM 13 63 4010 11.6 0 0 0 04/8/10 0 9:30 AM 13 62 52415 14.6 16790 4.7 3670 1.24/9/10 0.4 9:30 AM 13 61 48692 13.5 14311 3.97 62112 1.73
4/10/10 0.05 9:30 AM 12 58 45173 12.5 25101 6.91 11645 3.234/11/10 0 9:30 AM 12 60 59391 16.5 35849 9.95 25994 7.24/12/10 W 9:30 AM 12 61 71579 19.9 49391 13.7 43085 11.964/13/10 W 9:30 AM 12 61 71579 19.9 49391 13.7 43085 11.964/14/10 0 9:30 AM 13 59 34765 9.7 0 0 0 04/15/10 0 9:30 AM 13 61 50308 13.97 31351 8.7 22085 6.14/16/10 0 9:30 AM 13 64 62678 17.4 44283 11.2 37703 10.54/17/10 0.02 10:10 AM 12 64 27311 7.6 11265 3.1 3142 0.874/18/10 0 9:40 AM 12 61 10377 2.9 0 0 0 04/19/10 0 9:30 AM 13 61 31827 8.8 13362 3.7 547 0.154/20/10 0 9:40 AM 12 62 41787 11.6 16517 4.6 6519 1.84/21/10 0 9:30 AM 13 61 28639 7.95 0 0 0 04/22/10 0.09 9:03 AM 13 61 17123 4.8 0 0 0 04/23/10 0 9:30 AM 13 63 18894 5.2 0 0 0 04/24/10 0 9:30 AM 13 64 25667 7.1 0 0 0 04/25/10 0.2 9:03 AM 13 64 26946 7.5 0 0 0 04/26/10 0.02 9:50 AM 13 65 5432 1.5 0 0 0 04/27/10 0.04 9:30 AM 13 65 0 0 0 0 0 04/28/10 0.03 9:30 AM 13 61 0 0 0 0 0 04/30/10 0 9:35 AM 14 63 51898 14.4 37324 10.4 32273 8.96
5/1/10 0 9:30 AM 14 66 46647 12.96 32107 8.9 19026 5.35/2/10 0 10:00 AM 14 69 42325 11.8 21360 6 372 0.15/3/10 0 9:30 AM 14 70 29888 8.3 5696 1.6 0 05/4/10 0 8:15 AM 14 68 48309 13.4 24745 6.9 3745 1
12.9 62.9 10.23 4.27 2.57
No data taken on May 5
FRGP 2010 - 02
Page 4 of 7
Dock Summary 3 - June 10, 2010 - (5-5 to 6-10)Date Rain Time PPT Temp Cage 1 Count Time Cage 2 Count Time Cage 3 Count Time
5/6/10 0 9:30 AM 15 74 31885 8.85 798 0.22 0 05/7/10 0 9:30 AM 14 70 34238 9.5 1445 0.4 0 05/8/10 0 9:30 AM 15 72 40853 11.3 16580 4.6 0 05/9/10 0 9:30 AM 14 66 56397 15.6 17170 4.8 5678 1.6
5/10/10 0 8:00 AM 14 62 87213 24.2 62783 17.4 48007 13.35/11/10 0 9:30 AM 14 64 90680 25.1 61773 17.2 48104 13.35/12/10 0.05 9:30 AM 14 64 46136 12.8 25794 7.1 5938 1.65/13/10 0.1 9:30 AM 14 63 32433 9 45 0.01 0 05/14/10 0 9:30 AM 14 65 37091 10.3 25250 7 6914 1.95/15/10 0.02 9:30 AM 14 60 48950 13.6 36314 10 26600 7.35/16/10 0.03 8:25 AM 14 61 53941 15 36180 10 20895 5.85/17/10 .T 9:30 AM 14 61 36211 10 11124 3.09 0 05/18/10 2.15 10:30 AM 12 65 1760 0.48 0 0 0 05/19/10 .T 9:30 AM 12 62 6867 1.9 0 0 0 05/20/10 0 9:30 AM 14 66 6090 1.7 0 0 0 05/21/10 0 9:30 AM 14 70 30255 8.4 3803 1 0 05/22/10 0 9:30 AM 14 72 39429 10.95 23605 6.55 0 05/23/10 0.2 9:30 AM 13 73 29343 8.15 10228 2.8 0 05/24/10 0 10:30 AM 14 72 17135 4.8 0 0 0 05/25/10 0 10:30 AM 14 74 30719 8.5 8228 2.3 0 05/26/10 0 9:30 AM 14 74 33974 9.4 1749 4.8 0 05/29/10 0.02 10:00 AM 16 78 44623 12.4 11926 3.3 0 05/30/10 0 10:00 AM 15 76 25191 7 8422 2.3 0 05/31/10 0 9:00 AM 14 78 35367 9.8 15451 4.3 0 06/1/10 0 9:00 AM 15 76 32013 8.9 11536 3.2 0 06/2/10 0.1 9:00 AM 15 76 30643 8.5 8804 2.4 0 06/3/10 0 9:30 AM 15 78 33603 9.3 8328 2.3 0 06/6/10 .T 8:30 AM 16 80 18648 5.2 0 0 0 06/7/10 0.7 10:00 AM 16 78 17623 4.9 657 0.18 0 06/8/10 0 9:00 AM 14 76 36101 10 10291 2.85 0 06/9/10 0 10:00 AM 16 77 41928 11.6 19439 5.4 0 0
6/10/10 0 10:00 AM 16 78 21808 6 11562 3.2 2149 0.66/11/10 0 10:05 AM 16 78 24306 6.75 0 0 0 0
14.4 70.9 9.7 3.9 1.4

FRGP 2010 - 02
Page 5 of 7
Dock Summary 4 - July 16, 2010 - (6-10 to 7-16)
Date Rain Time PPT Temp Cage 1 Count Time Cage 2 Count Time Cage 3 Count Time6/12/10 0 11:00 AM 16 80 20928 5.8 0 0 0 06/13/10 0.65 10:00 AM 16 80 28799 8 1076 0.3 0 06/14/10 0.23 10:00 AM 16 80 32980 9.2 10717 2.89 524 0.156/15/10 0.71 10:00 AM 16 82 10620 2.95 0 0 0 06/16/10 0.05 10:00 AM 16 82 11464 3.2 0 0 0 06/17/10 0 10:00 AM 17 81 21728 6 2200 0.6 0 06/18/10 0 10:00 AM 17 81 30680 8.5 4561 1.3 0 06/19/10 0 10:00 AM 16 83 26926 7.5 6826 1.9 0 06/20/10 0 10:00 AM 16 82 25827 7.1 0 0 0 06/22/10 0 8:00 AM 17 84 39815 11.05 22447 6.2 0 06/23/10 0 9:00 AM 17 85 33162 9.2 8679 2.4 0 06/24/10 0.02 10:00 AM 18 86 34918 9.7 7636 2.1 0 06/25/10 0 10:00 AM 17 84 37383 10.3 17339 4.8 0 06/26/10 0 11:00 AM 18 86 42137 11.7 25179 7 4234 1.26/27/10 0.1 11:00 AM 18 86 27533 7.6 4940 1.4 0 06/28/10 31036 8.6 10266 2.86 1514 0.426/29/10 31036 8.6 10266 2.86 1514 0.426/30/10 31036 8.6 10266 2.86 1514 0.427/1/10 31036 8.6 10266 2.86 1514 0.427/2/10 0 10:00 AM 16 76 31036 8.6 10266 2.86 1514 0.427/3/10 0 10:00 AM 16 76 36414 10.1 8738 2.4 0 07/4/10 0 10:00 AM 16 76 46187 12.8 12053 3.3 0 07/5/10 0 10:00 AM 17 78 43311 12.6 20051 5.6 0 07/6/10 0 10:00 AM 18 80 27094 7.5 0 0 0 07/7/10 0 10:00 AM 18 82 29832 8.3 8887 2.5 0 07/8/10 0 10:00 AM 18 82 26353 7.3 0 0 0 07/9/10 0 10:00 AM 18 81 13116 3.6 0 0 0 0
7/10/10 0.2 10:00 AM 19 82 18534 5.1 0 0 0 07/11/10 0.3 10:00 AM 18 80 25672 7.1 9831 2.7 0 07/12/10 T 10:00 AM 18 80 34162 9.5 16567 4.6 0 07/13/10 0.11 10:00 AM 18 81 26372 7.3 2767 0.8 0 07/14/10 0 10:00 AM 18 80 33550 9.3 13391 3.71 7430 2
17.1 81.3 8.2 3.7 0.2
FRGP 2010 - 02
Page 6 of 7
Dock Summary 5 - August 18, 2010 - (7-16 to 8-18)
Date Rain Time PPT Temp Cage 1 Count Time Cage 2 Count Time Cage 3 Count Time7/17/10 0 10:00 AM 18 82 26269 7.2 4211 1.2 0 07/18/10 0 10:00 AM 18 82 52539 14.6 8422 2.3 0 07/19/10 2 10:00 AM 18 80 43701 12.1 30806 8.55 14230 3.957/20/10 0 18 12.1 6.5 2.37/21/10 0.8 10:00 AM 18 80 86428 12.1 47245 6.5 16589 2.37/22/10 0 10 18 82 41269 11.5 18939 5.3 0 07/23/10 0 10:00 AM 19 84 43595 12.1 22006 6.1 0 07/24/10 0 10:00 AM 19 83 47369 13.2 27296 7.6 2452 0.77/25/10 0 12:00 AM 19 85 53431 14.8 36642 10.1 19639 5.57/26/10 0 10:00 AM 19 82 41385 11.5 25207 7 5817 1.67/27/10 0 10:00 AM 19 82 38361 10.7 17806 4.94 0 07/28/10 0 10:00 AM 19 82 48503 13.3 30628 8.5 11914 3.37/29/10 19 13.5 6.6 1.57/30/10 1.5 1:00 PM 19 80 96803 13.5 49586 6.6 10699 2.977/31/10 0 10:00 AM 18 80 26870 7.5 0 0 0 08/1/10 0.1 10:00 AM 18 77 25304 7 0 0 08/2/10 0.2 10:00 AM 18 76 49389 13.7 0 0 0 08/3/10 0.3 188/4/10 18 11.9 5 2.58/5/10 18 11.9 5 2.58/6/10 0.3 10:00 AM 19 80 128670 11.9 53760 5 27268 2.58/7/10 18 9.5 2.6 1.18/8/10 18 9.5 2.6 1.18/9/10 0 10:00 AM 18 83 102912 9.5 28600 2.6 12048 1.1
8/10/10 18 9.8 5.5 08/11/10 0 10:00 AM 18 83 70520 9.8 39879 5.5 0 08/12/10 1.4 10:00 AM 18 82 30842 8.6 11839 3.3 0 08/13/10 0.3 10:00 AM 19 81 0 0 0 0 0 08/14/10 19 0 0 08/15/10 0.3 9:00 AM 19 80 0 0 0 0 0 08/16/10 0 9:00 AM 19 80 2323 0 0 0 0 0
18.4 81.2 9.76 4.16 1.16
FRGP 2010 - 02
Page 7 of 7
Dock Summary 6 - September 23, 2010 - (8-18 to 9-23)Date Rain Time PPT Temp Cage 1 Count Time Cage 2 Count Time Cage 3 Count Time8/20/10 2.1 10:00a 17 80 22 0 08/21/10 0 10:00a 18 82 4.7 0 08/22/10 0 10:00a 19 82 3.2 0 08/23/10 0 10:00a 18 78 0 0 08/24/10 0 10:00a 18 76 0 0 08/25/10 0 10:00a 18 78 0 0 08/26/10 0 10:00a 18 79 0 0 08/27/10 0 10:00a 18 79 1.1 0 08/28/10 0 10:00a 19 80 1.6 0 08/29/10 trace 10:00a 18 80 3.3 0 08/30/10 0 10:00a 18 80 8.4 0 08/31/10 0 10:00a 19 82 6.9 0 09/1/10 0 10:00a 19 82 4.9 0 09/2/10 0 10:00a 19 81 3.5 0 09/3/10 0 10:00a 19 81 1.3 0 09/4/10 0.1 10:00a 19 80 1 0 09/5/10 0 10:00a 19 77 0 0 09/6/10 0 10:00a 18 76 10.8 4.9 1.49/7/10 0 10:00a 19 78 9.3 3.6 09/8/10 0 10:00a 19 76 10.1 4.4 1.89/9/10 0 10:00a 18 74 10.1 6.1 1.4
9/10/10 0 10:00a 18 72 8.4 3.6 09/11/10 0 10:00a 18 71 10.8 4.9 09/12/10 0.4 10:00a 18 70 9.3 4.2 09/13/10 0.1 10:00a 18 70 0 0 09/14/10 0 10:00a 18 70 0 0 09/15/10 0 10:00a 18 72 0 0 09/16/10 0 10:00a 18 73 0.65 0 09/17/10 0 10:00a 18 72 9.7 0.28 09/18/10 0 10:00a 18 72 9.7 0.28 09/19/10 0 10:00a 18 72 5.8 2 09/20/10 0 10:00a 18 72 0 0 09/21/10 0 10:00a 18 71 0 0 09/22/10 0 10:00a 18 73 0 0 0
18.3 76.2 4.60 1.01 0.14

FRGP 2010 - 02
Page 1 of 7
Inspection Summary 1 April 5, 2010Inspection Summary 2 May 5, 2010Inspection Summary 3 Jun 11, 2010Inspection Summary 4 July 16, 2010 Inspection Summary 5 August 18, 2010 Inspection Summary 6 September 23, 2010
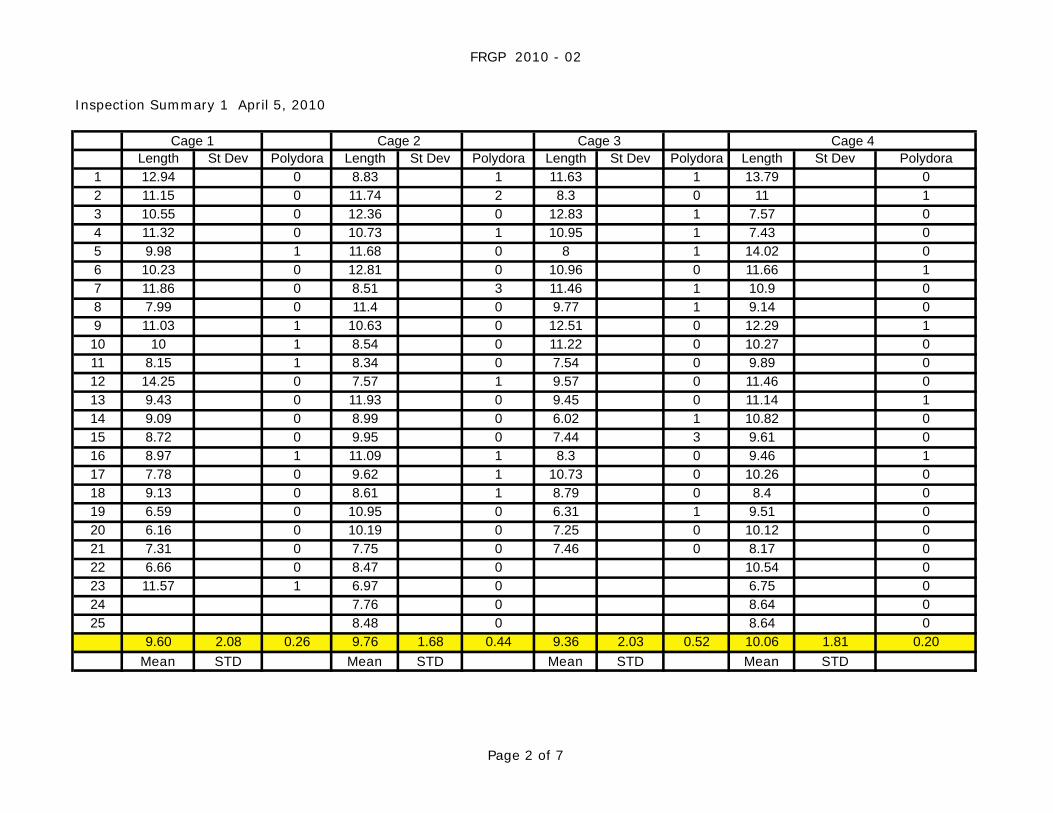
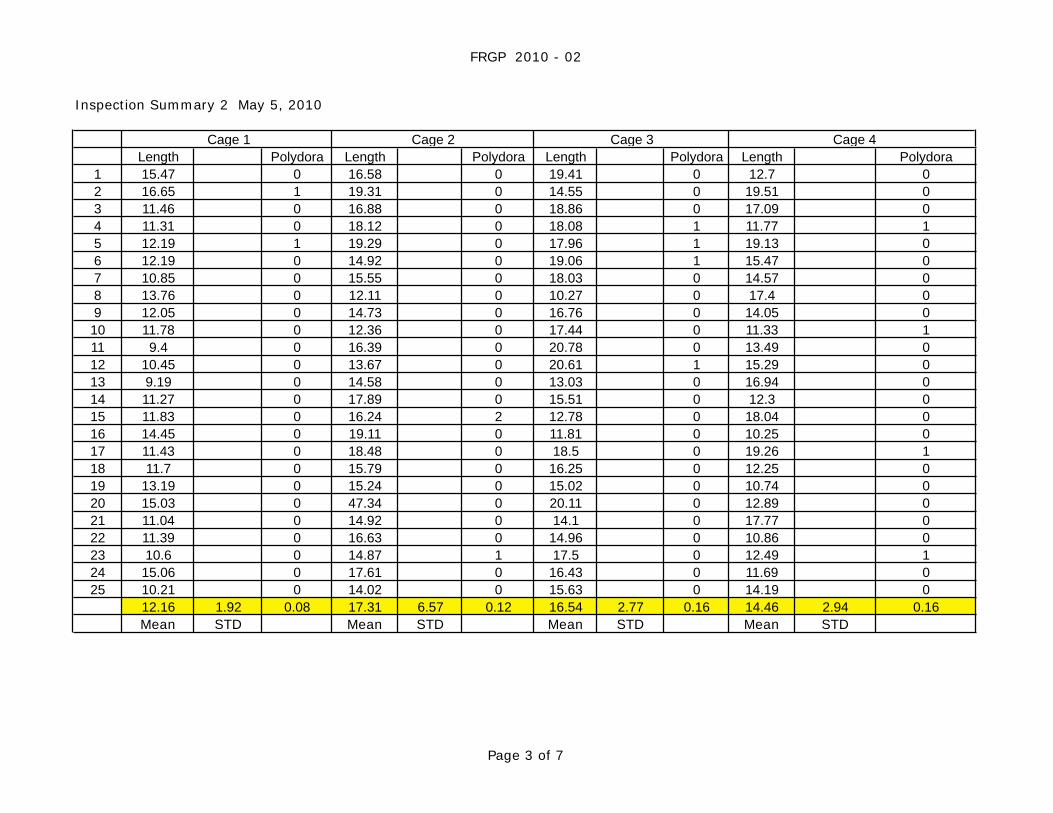
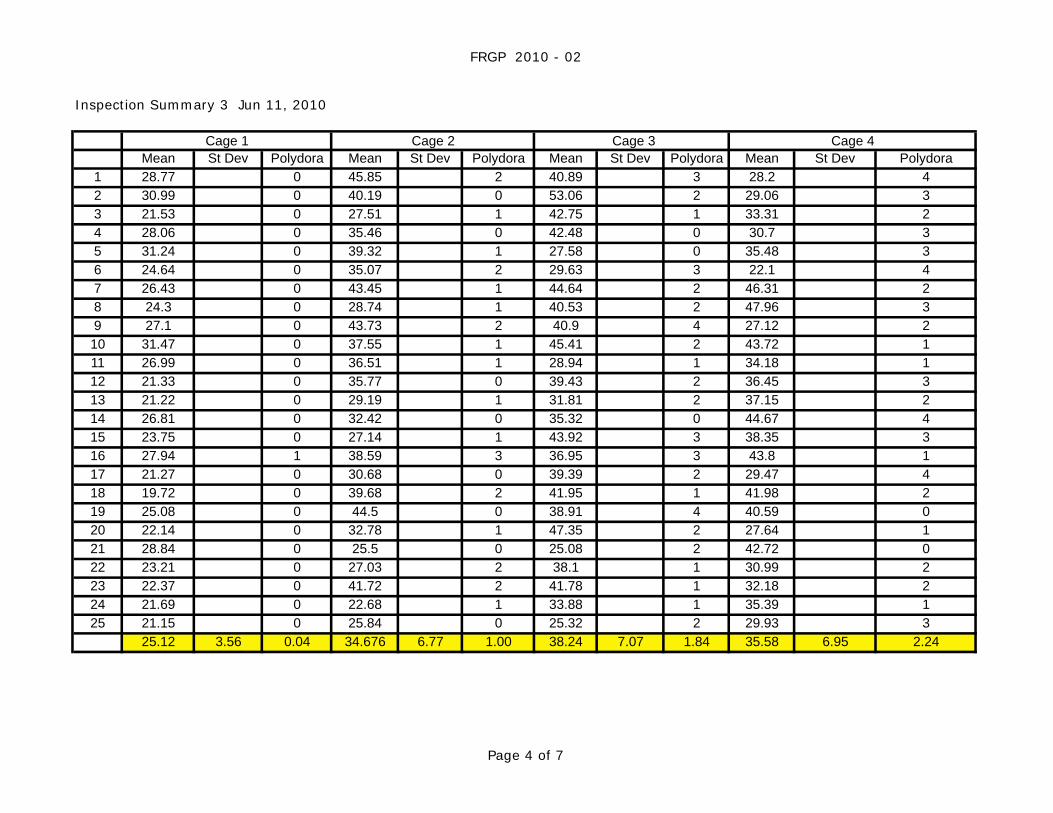
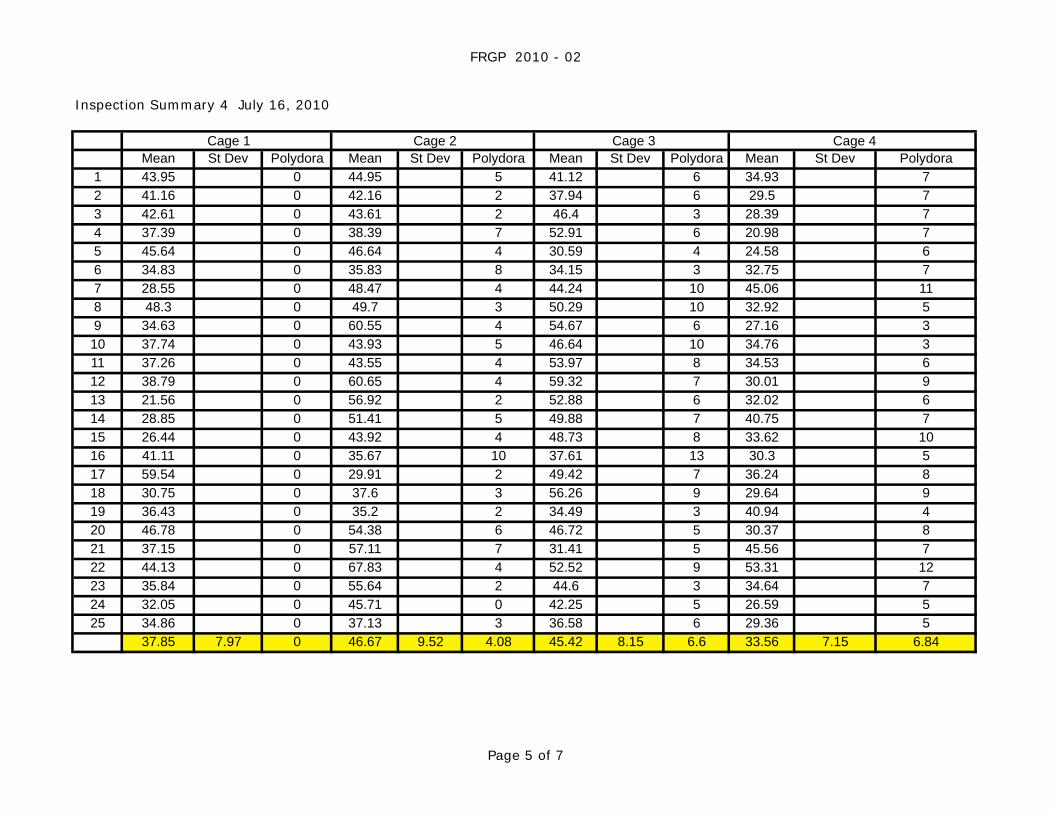
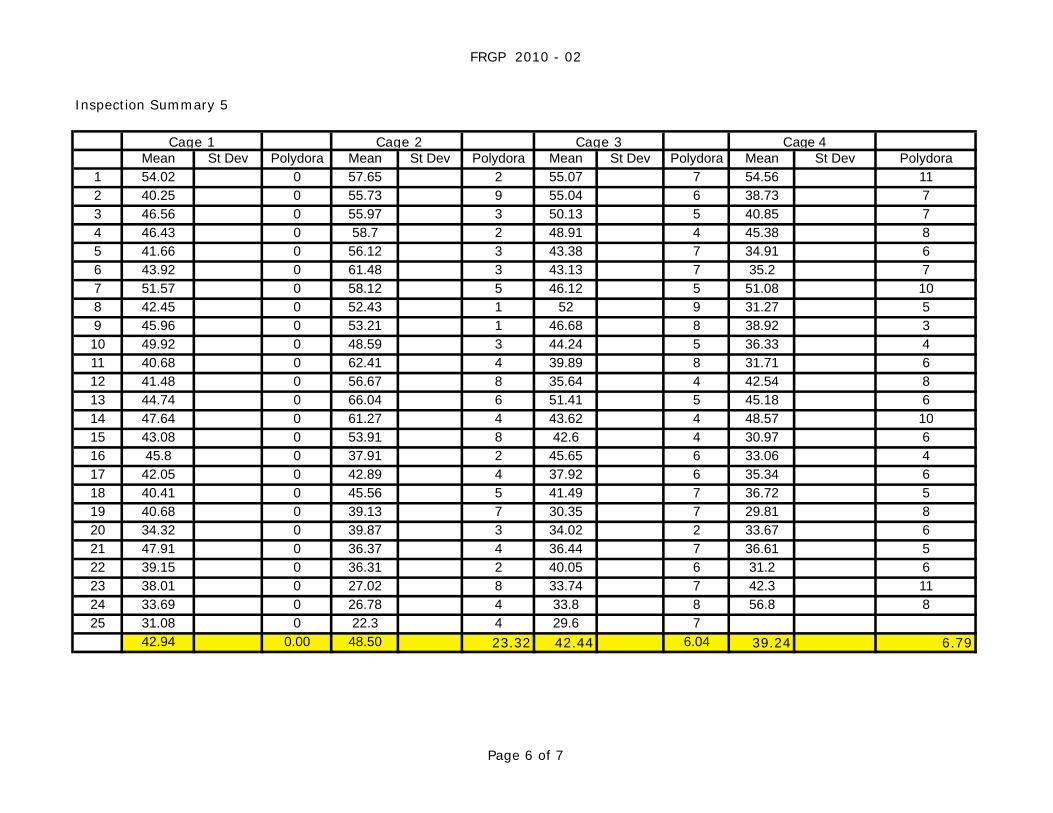
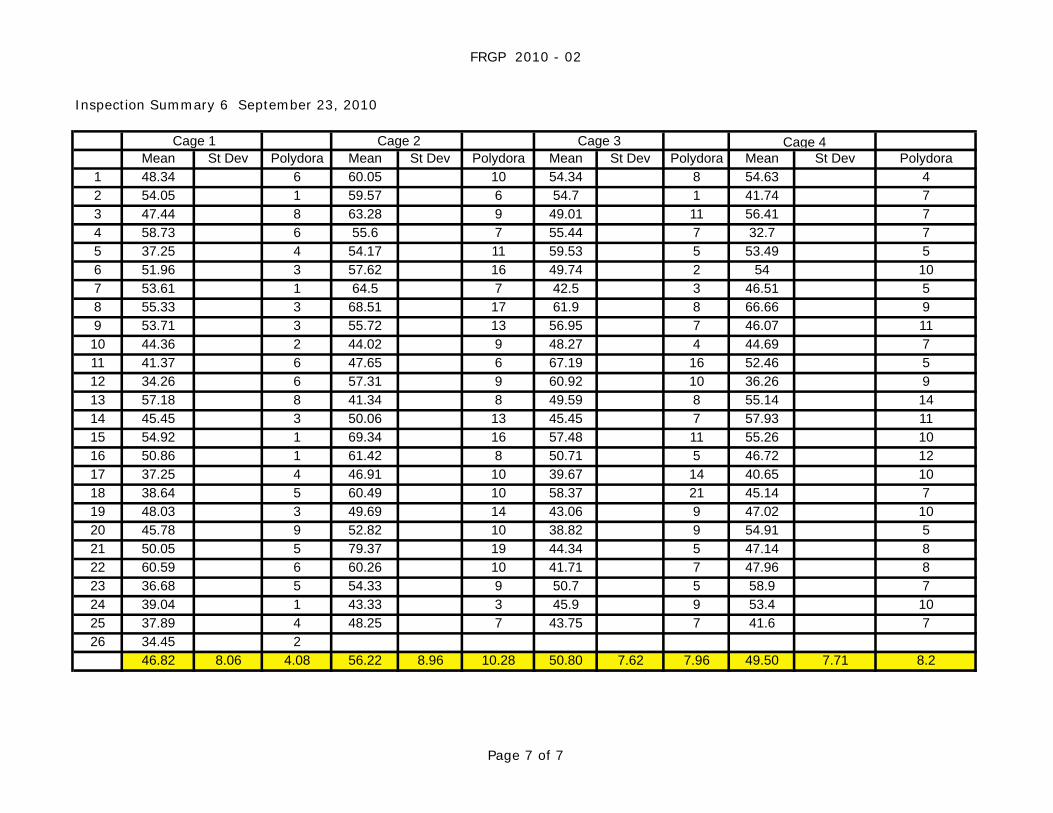
Inspection Summaries are a tabulation of the size and Polydora count for the 25animals sampled for Cages 1, 2, 3 and 4 for each sample period. Length was the longest dimension of the sampled animal.
Appendix 2 Inspection Summary Sheets 1 through 6
FRGP 2010 - 02
Page 2 of 7
Inspection Summary 1 April 5, 2010
Length St Dev Polydora Length St Dev Polydora Length St Dev Polydora Length St Dev Polydora1 12.94 0 8.83 1 11.63 1 13.79 02 11.15 0 11.74 2 8.3 0 11 13 10.55 0 12.36 0 12.83 1 7.57 04 11.32 0 10.73 1 10.95 1 7.43 05 9.98 1 11.68 0 8 1 14.02 06 10.23 0 12.81 0 10.96 0 11.66 17 11.86 0 8.51 3 11.46 1 10.9 08 7.99 0 11.4 0 9.77 1 9.14 09 11.03 1 10.63 0 12.51 0 12.29 110 10 1 8.54 0 11.22 0 10.27 011 8.15 1 8.34 0 7.54 0 9.89 012 14.25 0 7.57 1 9.57 0 11.46 013 9.43 0 11.93 0 9.45 0 11.14 114 9.09 0 8.99 0 6.02 1 10.82 015 8.72 0 9.95 0 7.44 3 9.61 016 8.97 1 11.09 1 8.3 0 9.46 117 7.78 0 9.62 1 10.73 0 10.26 018 9.13 0 8.61 1 8.79 0 8.4 019 6.59 0 10.95 0 6.31 1 9.51 020 6.16 0 10.19 0 7.25 0 10.12 021 7.31 0 7.75 0 7.46 0 8.17 022 6.66 0 8.47 0 10.54 023 11.57 1 6.97 0 6.75 024 7.76 0 8.64 025 8.48 0 8.64 0
9.60 2.08 0.26 9.76 1.68 0.44 9.36 2.03 0.52 10.06 1.81 0.20Mean STD Mean STD Mean STD Mean STD
Cage 1 Cage 2 Cage 3 Cage 4
FRGP 2010 - 02
Page 3 of 7
Inspection Summary 2 May 5, 2010
Length Polydora Length Polydora Length Polydora Length Polydora1 15.47 0 16.58 0 19.41 0 12.7 02 16.65 1 19.31 0 14.55 0 19.51 03 11.46 0 16.88 0 18.86 0 17.09 04 11.31 0 18.12 0 18.08 1 11.77 15 12.19 1 19.29 0 17.96 1 19.13 06 12.19 0 14.92 0 19.06 1 15.47 07 10.85 0 15.55 0 18.03 0 14.57 08 13.76 0 12.11 0 10.27 0 17.4 09 12.05 0 14.73 0 16.76 0 14.05 010 11.78 0 12.36 0 17.44 0 11.33 111 9.4 0 16.39 0 20.78 0 13.49 012 10.45 0 13.67 0 20.61 1 15.29 013 9.19 0 14.58 0 13.03 0 16.94 014 11.27 0 17.89 0 15.51 0 12.3 015 11.83 0 16.24 2 12.78 0 18.04 016 14.45 0 19.11 0 11.81 0 10.25 017 11.43 0 18.48 0 18.5 0 19.26 118 11.7 0 15.79 0 16.25 0 12.25 019 13.19 0 15.24 0 15.02 0 10.74 020 15.03 0 47.34 0 20.11 0 12.89 021 11.04 0 14.92 0 14.1 0 17.77 022 11.39 0 16.63 0 14.96 0 10.86 023 10.6 0 14.87 1 17.5 0 12.49 124 15.06 0 17.61 0 16.43 0 11.69 025 10.21 0 14.02 0 15.63 0 14.19 0
12.16 1.92 0.08 17.31 6.57 0.12 16.54 2.77 0.16 14.46 2.94 0.16Mean STD Mean STD Mean STD Mean STD
Cage 1 Cage 2 Cage 3 Cage 4
FRGP 2010 - 02
Page 4 of 7
Inspection Summary 3 Jun 11, 2010
Mean St Dev Polydora Mean St Dev Polydora Mean St Dev Polydora Mean St Dev Polydora1 28.77 0 45.85 2 40.89 3 28.2 42 30.99 0 40.19 0 53.06 2 29.06 33 21.53 0 27.51 1 42.75 1 33.31 24 28.06 0 35.46 0 42.48 0 30.7 35 31.24 0 39.32 1 27.58 0 35.48 36 24.64 0 35.07 2 29.63 3 22.1 47 26.43 0 43.45 1 44.64 2 46.31 28 24.3 0 28.74 1 40.53 2 47.96 39 27.1 0 43.73 2 40.9 4 27.12 210 31.47 0 37.55 1 45.41 2 43.72 111 26.99 0 36.51 1 28.94 1 34.18 112 21.33 0 35.77 0 39.43 2 36.45 313 21.22 0 29.19 1 31.81 2 37.15 214 26.81 0 32.42 0 35.32 0 44.67 415 23.75 0 27.14 1 43.92 3 38.35 316 27.94 1 38.59 3 36.95 3 43.8 117 21.27 0 30.68 0 39.39 2 29.47 418 19.72 0 39.68 2 41.95 1 41.98 219 25.08 0 44.5 0 38.91 4 40.59 020 22.14 0 32.78 1 47.35 2 27.64 121 28.84 0 25.5 0 25.08 2 42.72 022 23.21 0 27.03 2 38.1 1 30.99 223 22.37 0 41.72 2 41.78 1 32.18 224 21.69 0 22.68 1 33.88 1 35.39 125 21.15 0 25.84 0 25.32 2 29.93 3
25.12 3.56 0.04 34.676 6.77 1.00 38.24 7.07 1.84 35.58 6.95 2.24
Cage 1 Cage 2 Cage 3 Cage 4
FRGP 2010 - 02
Page 5 of 7
Inspection Summary 4 July 16, 2010
Mean St Dev Polydora Mean St Dev Polydora Mean St Dev Polydora Mean St Dev Polydora1 43.95 0 44.95 5 41.12 6 34.93 72 41.16 0 42.16 2 37.94 6 29.5 73 42.61 0 43.61 2 46.4 3 28.39 74 37.39 0 38.39 7 52.91 6 20.98 75 45.64 0 46.64 4 30.59 4 24.58 66 34.83 0 35.83 8 34.15 3 32.75 77 28.55 0 48.47 4 44.24 10 45.06 118 48.3 0 49.7 3 50.29 10 32.92 59 34.63 0 60.55 4 54.67 6 27.16 310 37.74 0 43.93 5 46.64 10 34.76 311 37.26 0 43.55 4 53.97 8 34.53 612 38.79 0 60.65 4 59.32 7 30.01 913 21.56 0 56.92 2 52.88 6 32.02 614 28.85 0 51.41 5 49.88 7 40.75 715 26.44 0 43.92 4 48.73 8 33.62 1016 41.11 0 35.67 10 37.61 13 30.3 517 59.54 0 29.91 2 49.42 7 36.24 818 30.75 0 37.6 3 56.26 9 29.64 919 36.43 0 35.2 2 34.49 3 40.94 420 46.78 0 54.38 6 46.72 5 30.37 821 37.15 0 57.11 7 31.41 5 45.56 722 44.13 0 67.83 4 52.52 9 53.31 1223 35.84 0 55.64 2 44.6 3 34.64 724 32.05 0 45.71 0 42.25 5 26.59 525 34.86 0 37.13 3 36.58 6 29.36 5
37.85 7.97 0 46.67 9.52 4.08 45.42 8.15 6.6 33.56 7.15 6.84
Cage 1 Cage 2 Cage 3 Cage 4
FRGP 2010 - 02
Page 6 of 7
Inspection Summary 5
Mean St Dev Polydora Mean St Dev Polydora Mean St Dev Polydora Mean St Dev Polydora1 54.02 0 57.65 2 55.07 7 54.56 112 40.25 0 55.73 9 55.04 6 38.73 73 46.56 0 55.97 3 50.13 5 40.85 74 46.43 0 58.7 2 48.91 4 45.38 85 41.66 0 56.12 3 43.38 7 34.91 66 43.92 0 61.48 3 43.13 7 35.2 77 51.57 0 58.12 5 46.12 5 51.08 108 42.45 0 52.43 1 52 9 31.27 59 45.96 0 53.21 1 46.68 8 38.92 310 49.92 0 48.59 3 44.24 5 36.33 411 40.68 0 62.41 4 39.89 8 31.71 612 41.48 0 56.67 8 35.64 4 42.54 813 44.74 0 66.04 6 51.41 5 45.18 614 47.64 0 61.27 4 43.62 4 48.57 1015 43.08 0 53.91 8 42.6 4 30.97 616 45.8 0 37.91 2 45.65 6 33.06 417 42.05 0 42.89 4 37.92 6 35.34 618 40.41 0 45.56 5 41.49 7 36.72 519 40.68 0 39.13 7 30.35 7 29.81 820 34.32 0 39.87 3 34.02 2 33.67 621 47.91 0 36.37 4 36.44 7 36.61 522 39.15 0 36.31 2 40.05 6 31.2 623 38.01 0 27.02 8 33.74 7 42.3 1124 33.69 0 26.78 4 33.8 8 56.8 825 31.08 0 22.3 4 29.6 7
42.94 0.00 48.50 23.32 42.44 6.04 39.24 6.79
Cage 1 Cage 2 Cage 3 Cage 4
FRGP 2010 - 02
Page 7 of 7
Inspection Summary 6 September 23, 2010
Mean St Dev Polydora Mean St Dev Polydora Mean St Dev Polydora Mean St Dev Polydora1 48.34 6 60.05 10 54.34 8 54.63 42 54.05 1 59.57 6 54.7 1 41.74 73 47.44 8 63.28 9 49.01 11 56.41 74 58.73 6 55.6 7 55.44 7 32.7 75 37.25 4 54.17 11 59.53 5 53.49 56 51.96 3 57.62 16 49.74 2 54 107 53.61 1 64.5 7 42.5 3 46.51 58 55.33 3 68.51 17 61.9 8 66.66 99 53.71 3 55.72 13 56.95 7 46.07 1110 44.36 2 44.02 9 48.27 4 44.69 711 41.37 6 47.65 6 67.19 16 52.46 512 34.26 6 57.31 9 60.92 10 36.26 913 57.18 8 41.34 8 49.59 8 55.14 1414 45.45 3 50.06 13 45.45 7 57.93 1115 54.92 1 69.34 16 57.48 11 55.26 1016 50.86 1 61.42 8 50.71 5 46.72 1217 37.25 4 46.91 10 39.67 14 40.65 1018 38.64 5 60.49 10 58.37 21 45.14 719 48.03 3 49.69 14 43.06 9 47.02 1020 45.78 9 52.82 10 38.82 9 54.91 521 50.05 5 79.37 19 44.34 5 47.14 822 60.59 6 60.26 10 41.71 7 47.96 823 36.68 5 54.33 9 50.7 5 58.9 724 39.04 1 43.33 3 45.9 9 53.4 1025 37.89 4 48.25 7 43.75 7 41.6 726 34.45 2
46.82 8.06 4.08 56.22 8.96 10.28 50.80 7.62 7.96 49.50 7.71 8.2
Cage 1 Cage 2 Cage 3 Cage 4
Appendix 3 Parasite Summary
FRGP 2010 - 02
Appendix 3, Parasite Summary
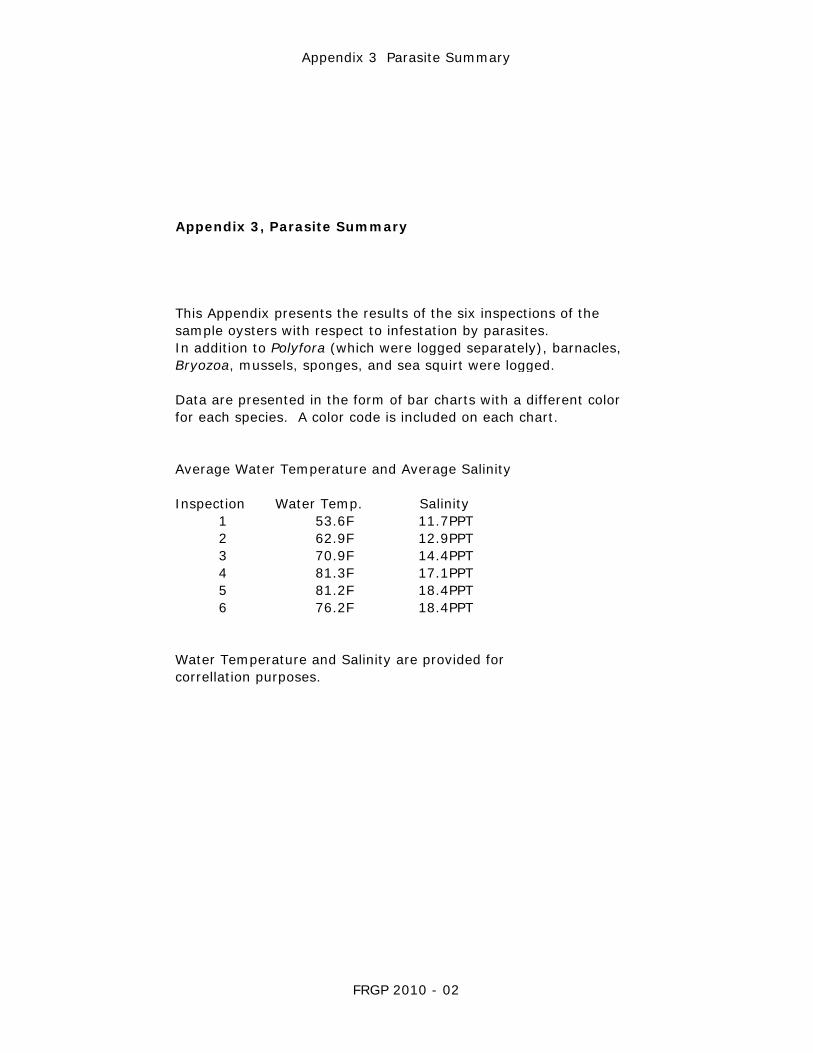
This Appendix presents the results of the six inspections of thesample oysters with respect to infestation by parasites.In addition to Polyfora (which were logged separately), barnacles, Bryozoa, mussels, sponges, and sea squirt were logged.
Data are presented in the form of bar charts with a different colorfor each species. A color code is included on each chart.
Average Water Temperature and Average Salinity
Inspection Water Temp. Salinity1 53.6F 11.7PPT2 62.9F 12.9PPT3 70.9F 14.4PPT4 81.3F 17.1PPT5 81.2F 18.4PPT6 76.2F 18.4PPT
Water Temperature and Salinity are provided for correllation purposes.

Appendix 3 Parasite Summary
FRGP 2010 - 02
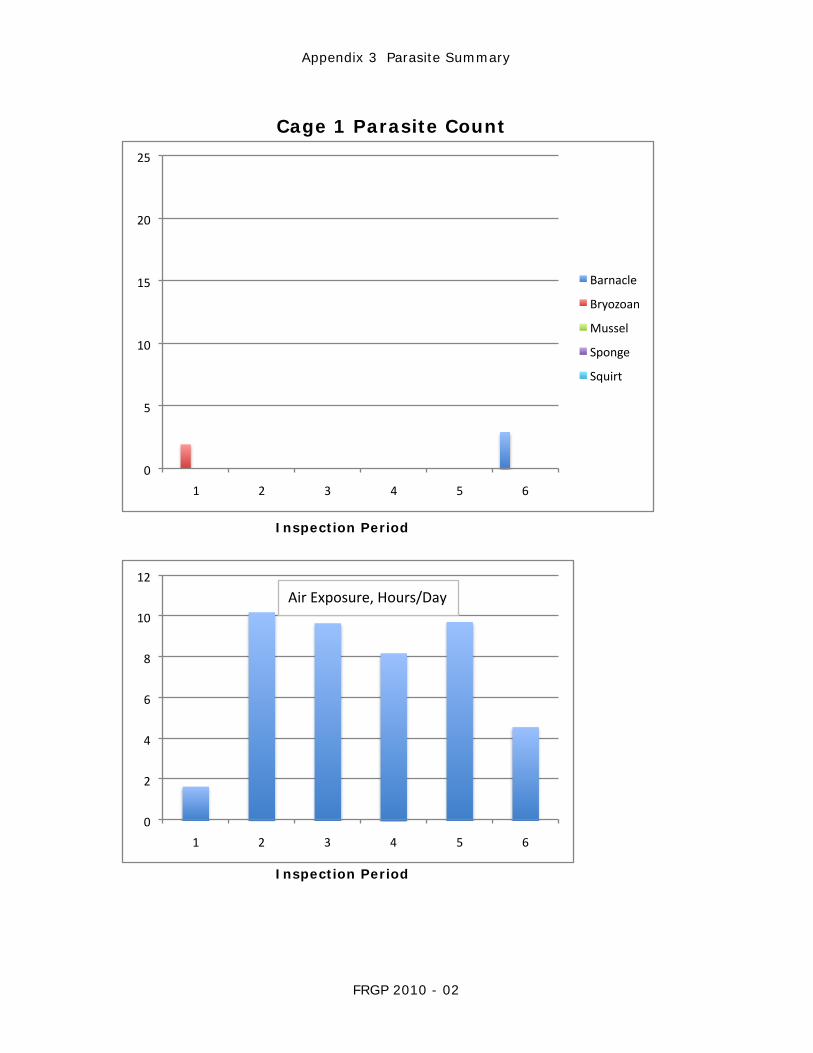
Cage 1
Inspection Barnacle Bryozoan Mussel Sponge Squirt1 0 2 0 0 02 0 0 0 0 03 0 0 0 0 04 0 0 0 0 05 0 0 0 0 06 3 0 0 0 0
AverageExposure,
Inspection Hours/Day1 1.682 10.233 9.694 8.225 9.766 4.6
Appendix 3 Parasite Summary
FRGP 2010 - 02
Cage 1 Parasite Count
Inspection Period
Inspection Period
0
5
10
15
20
25
1 2 3 4 5 6
Barnacle
Bryozoan
Mussel
Sponge
Squirt
0
2
4
6
8
10
12
1 2 3 4 5 6
Air Exposure, Hours/Day
Appendix 3 Parasite Summary
FRGP 2010 - 02
Cage 2
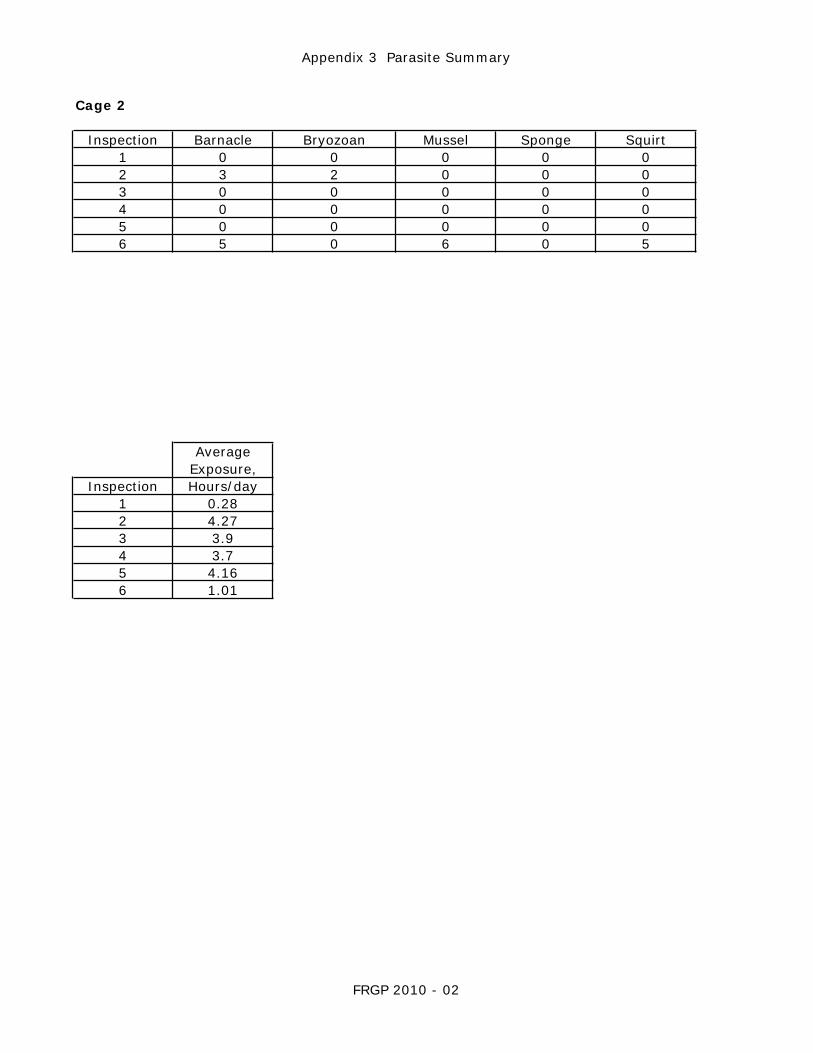
Inspection Barnacle Bryozoan Mussel Sponge Squirt1 0 0 0 0 02 3 2 0 0 03 0 0 0 0 04 0 0 0 0 05 0 0 0 0 06 5 0 6 0 5
AverageExposure,
Inspection Hours/day1 0.282 4.273 3.94 3.75 4.166 1.01

Appendix 3 Parasite Summary
FRGP 2010 - 02
Cage 2 Parasite Count
Inspection Period
Inspection Period
0
5
10
15
20
25
1 2 3 4 5 6
Barnacle
Bryozoan
Mussel
Sponge
Squirt
0
2
4
6
8
10
12
1 2 3 4 5 6
Air Exposure, Hours/Day
Appendix 3 Parasite Summary
FRGP 2010 - 02
Cage 3
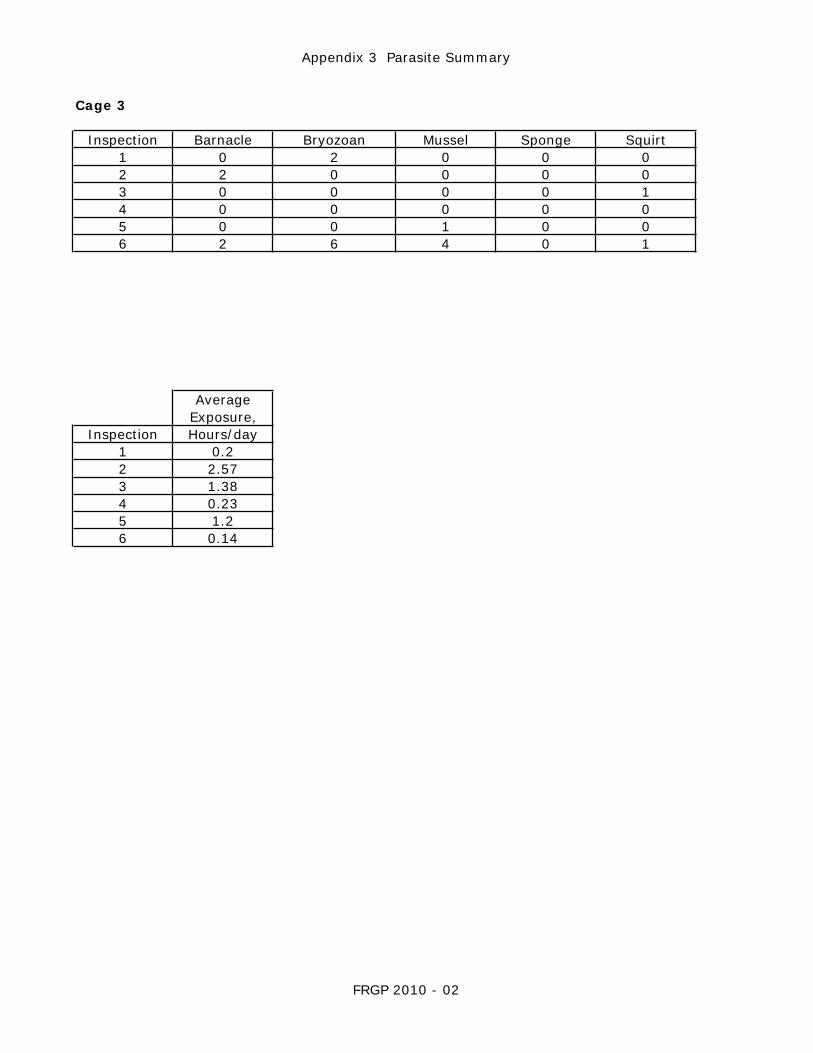
Inspection Barnacle Bryozoan Mussel Sponge Squirt1 0 2 0 0 02 2 0 0 0 03 0 0 0 0 14 0 0 0 0 05 0 0 1 0 06 2 6 4 0 1
AverageExposure,
Inspection Hours/day1 0.22 2.573 1.384 0.235 1.26 0.14

Appendix 3 Parasite Summary
FRGP 2010 - 02
Cage 3 Parasite Count
Inspection Period
Inspection Period
0
5
10
15
20
25
1 2 3 4 5 6
Barnacle
Bryozoan
Mussel
Sponge
Squirt
0
2
4
6
8
10
12
1 2 3 4 5 6
Air Exposure, Hours/Day
Appendix 3 Parasite Summary
FRGP 2010 - 02
Cage 4
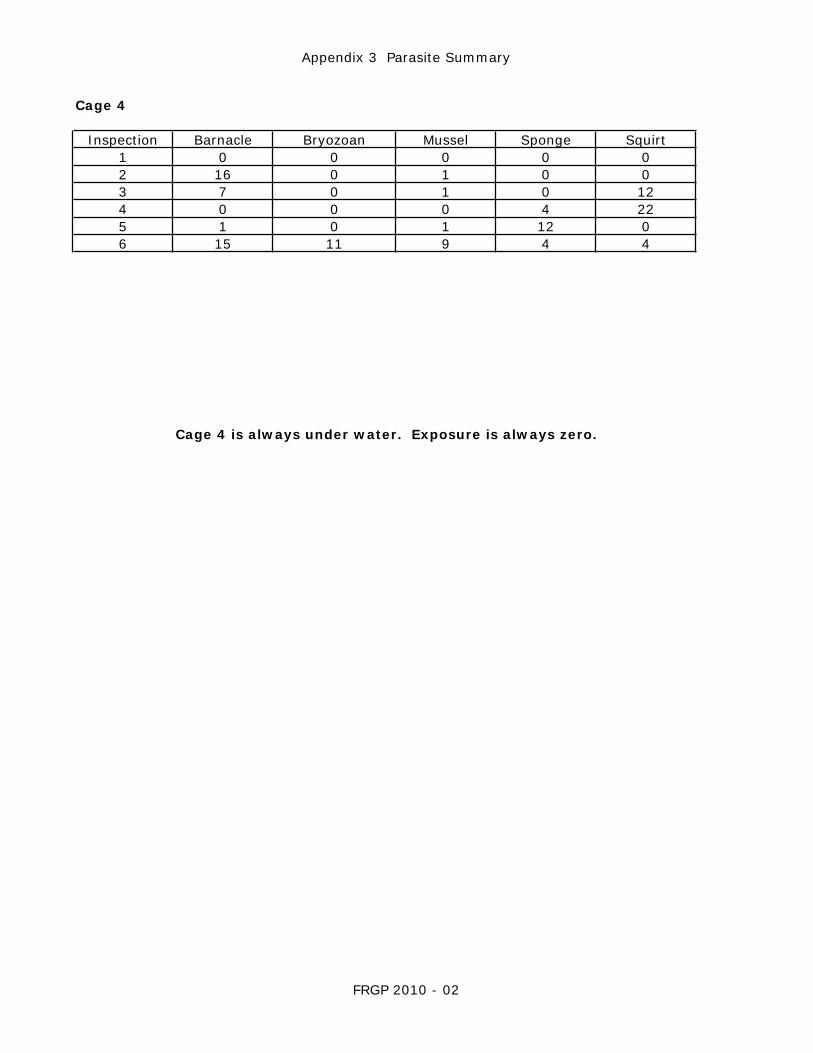
Inspection Barnacle Bryozoan Mussel Sponge Squirt1 0 0 0 0 02 16 0 1 0 03 7 0 1 0 124 0 0 0 4 225 1 0 1 12 06 15 11 9 4 4
Cage 4 is always under water. Exposure is always zero.

Appendix 3 Parasite Summary
FRGP 2010 - 02
Cage 4 Parasite Count
Inspection Period
Cage 4 is always under water
0
5
10
15
20
25
1 2 3 4 5 6
Barnacle
Bryozoan
Mussel
Sponge
Squirt

Summary of Results
FRGP - 2010 - 02
Sample Mean Size Polydora Exposure Mean Size Polydora Exposure Mean Size Polydora Exposure Mean Size Polydora Exposure1 9.6 0.25 1.68 9.76 0.44 0.28 9.36 0.52 0.02 10.06 0.2 02 12.16 0.08 10.23 17.31 0.12 4.27 16.54 0.16 2.57 14.46 0.16 03 25.12 0.04 9.69 34.68 1 3.9 38.24 1.84 1.38 35.58 2.24 04 37.85 0 8.22 46.67 4.08 3.7 45.42 6.6 0.23 33.56 6.84 05 42.94 0 9.76 48.5 4.2 4.16 42.44 6.04 1.2 39.22 6.54 06 46.82 4.08 4.6 56.62 10.28 1.01 50.8 7.96 0.14 49.5 8.2 0
MeanSize
(mm)
AverageNumber ofPolydora
per Animal
Average Control Sample IsExposure Always Submerged
(Hours/Day)
Cage 1 Cage 4Cage 2 Cage 3
0
2
4
6
8
10
1 2 3 4 5 6
0
10
20
30
40
50
60
1 2 3 4 5 6
0
10
20
30
40
50
60
1 2 3 4 5 6
0
10
20
30
40
50
60
1 2 3 4 5 6
0
2
4
6
8
10
1 2 3 4 5 6
0
2
4
6
8
10
1 2 3 4 5 6 0
2
4
6
8
10
1 2 3 4 5 6 0
2
4
6
8
10
1 2 3 4 5 6
0
2
4
6
8
10
1 2 3 4 5 6
0
10
20
30
40
50
60
1 2 3 4 5 6
0
2
4
6
8
10
1 2 3 4 5 6