1 7 th – 8 th april, 2015 group - i. 2 of 64 andhra pradesh agriculture profile s noitemunitandhra...
TRANSCRIPT
1
7th – 8th April, 2015
Group - I

2 of 64
ANDHRA PRADESH AGRICULTURE PROFILEANDHRA PRADESH AGRICULTURE PROFILE
S No Item Unit Andhra Pradesh
1 Total Geographical Area Lakh Ha 160.97
2 Gross Cropped Area Lakh Ha 68.18
3 Net Cropped Area Lakh Ha 51.39
4 Gross Irrigated Area Lakh Ha 35.30
5 Net irrigated Area Lakh Ha 24.48
6 % of Rainfed Area % 48%
7 Number of Farm Holdings Lakh Nos. 76.21
i) Marginal Lakh Nos. 49.84
ii) Small Lakh Nos. 15.91
iii) Others Lakh Nos. 10.46
8 Average Annual Rainfall mm 966.1
9 Cropping Intensity % 1.33
10 Irrigation Intensity % 1.44
3 of 64
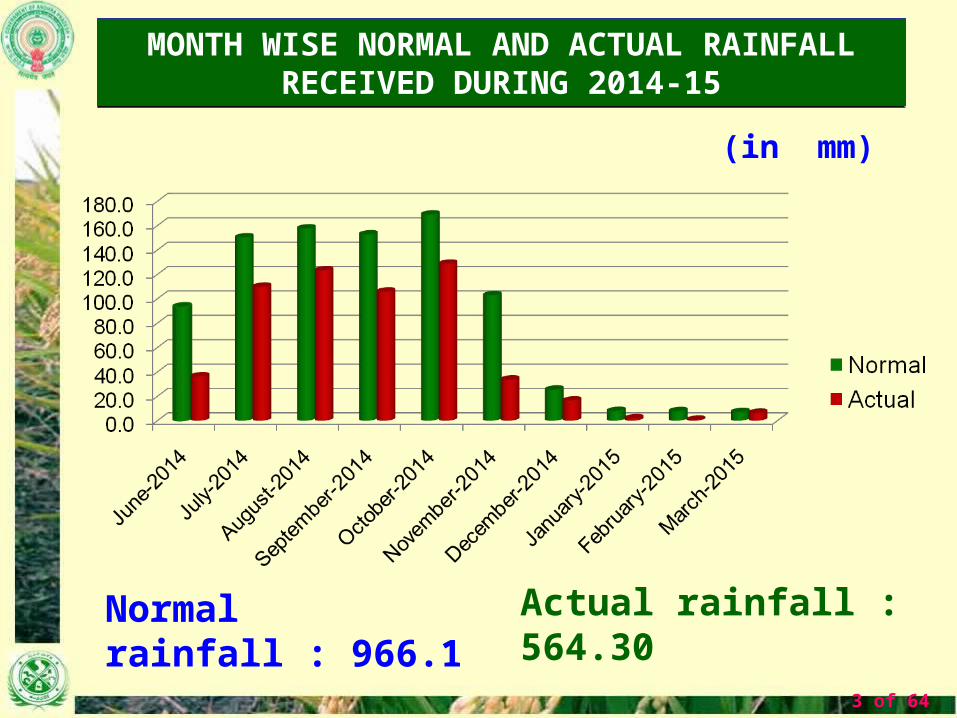
MONTH WISE NORMAL AND ACTUAL RAINFALL RECEIVED DURING 2014-15
MONTH WISE NORMAL AND ACTUAL RAINFALL RECEIVED DURING 2014-15
(in mm)
Normal rainfall : 966.1 Actual rainfall : 564.30
4 of 64
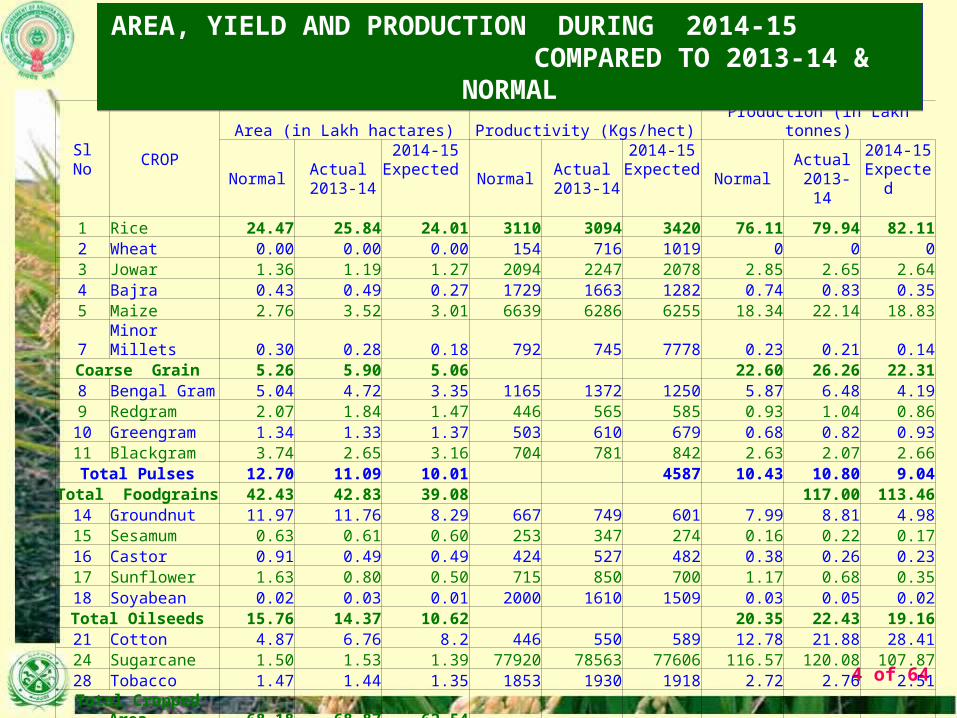
SlNo
CROP
Area (in Lakh hactares) Productivity (Kgs/hect) Production (in Lakh tonnes)
NormalActual
2013-14
2014-15 Expected Normal
Actual 2013-14
2014-15 Expected Normal
Actual 2013-14
2014-15 Expected
1 Rice 24.47 25.84 24.01 3110 3094 3420 76.11 79.94 82.112 Wheat 0.00 0.00 0.00 154 716 1019 0 0 03 Jowar 1.36 1.19 1.27 2094 2247 2078 2.85 2.65 2.644 Bajra 0.43 0.49 0.27 1729 1663 1282 0.74 0.83 0.355 Maize 2.76 3.52 3.01 6639 6286 6255 18.34 22.14 18.837 Minor Millets 0.30 0.28 0.18 792 745 7778 0.23 0.21 0.14
Coarse Grain 5.26 5.90 5.06 22.60 26.26 22.318 Bengal Gram 5.04 4.72 3.35 1165 1372 1250 5.87 6.48 4.199 Redgram 2.07 1.84 1.47 446 565 585 0.93 1.04 0.8610 Greengram 1.34 1.33 1.37 503 610 679 0.68 0.82 0.9311 Blackgram 3.74 2.65 3.16 704 781 842 2.63 2.07 2.66
Total Pulses 12.70 11.09 10.01 4587 10.43 10.80 9.04Total Foodgrains 42.43 42.83 39.08 117.00 113.4614 Groundnut 11.97 11.76 8.29 667 749 601 7.99 8.81 4.9815 Sesamum 0.63 0.61 0.60 253 347 274 0.16 0.22 0.1716 Castor 0.91 0.49 0.49 424 527 482 0.38 0.26 0.2317 Sunflower 1.63 0.80 0.50 715 850 700 1.17 0.68 0.3518 Soyabean 0.02 0.03 0.01 2000 1610 1509 0.03 0.05 0.02
Total Oilseeds 15.76 14.37 10.62 20.35 22.43 19.1621 Cotton 4.87 6.76 8.2 446 550 589 12.78 21.88 28.4124 Sugarcane 1.50 1.53 1.39 77920 78563 77606 116.57 120.08 107.8728 Tobacco 1.47 1.44 1.35 1853 1930 1918 2.72 2.76 2.51
Total Cropped Area 68.18 68.87 62.54
AREA, YIELD AND PRODUCTION DURING 2014-15 COMPARED TO 2013-14 & NORMAL
AREA, YIELD AND PRODUCTION DURING 2014-15 COMPARED TO 2013-14 & NORMAL

5 of 64
SlNo
CROP Area (in Lakh hactares) Productivity (Kgs/hect) Production (in Lakh tonnes)
NormalActual
2013-14Expected 2014-15
NormalActual
2013-14Expected 2014-15
NormalActual
2013-14Expected
2014-15
1 Rice 8.05 8.78 7.66 4013 4142 4160 32.31 36.37 36.372 Jowar 1.03 0.86 0.90 2213 2438 2175 2.29 2.07 2.083 Bajra 0.03 0.02 0.02 2077 1853 1282 0.05 0.04 0.034 Maize 2.01 2.42 2.01 7715 7454 7745 15.49 18.06 15.575 Ragi 0.05 0.05 0.04 1640 1555 1521 0.08 0.07 0.06
Coarse Grain 3.13 3.36 2.98 17.93 20.27 17.756 Bengal Gram 5.04 4.72 3.35 1165 1372 1250 5.87 6.48 4.197 Greengram 1.07 1.16 1.26 542 625 656 0.58 0.73 0.838 Blackgram 3.54 2.50 2.97 714 786 825 2.53 1.97 2.45
Total Pulses 10.04 8.78 8.06 4057 4604 9.23 9.48 7.78Total Foodgrains 21.22 20.91 18.70 59.47 66.12 61.909 Groundnut 1.06 0.90 0.69 2271 2218 2667 2.40 2.00 1.84
10 Sesamum 0.28 0.33 0.39 257 261 204 0.07 0.09 0.1111 Sunflower 1.29 0.62 0.39 759 868 756 0.98 0.54 0.29
Total Oilseeds 2.79 1.99 1.62 6256 5548 3.59 2.71 2.3412 Cotton 0.02 0.05 0.05 439 405 589 0.06 0.12 0.1713 Chillies 0.21 0.18 0.24 3962 4372 3970 0.84 0.80 0.9514 Onion 0.05 0.05 0.04 23391 22138 21697 1.08 1.18 0.8715 Tobacco 1.45 1.39 1.35 1850 1897 1918 2.69 2.63 2.59
Total Cropped Area 25.90 24.66 22.28
RABI 2014-15 ASSESSMENT COMPARED TO RABI 2013-14 & NORMAL
RABI 2014-15 ASSESSMENT COMPARED TO RABI 2013-14 & NORMAL
Area in Lakh ha, Productivity in Kgs/ha & Prodcution in LMTs(Provisional)

6 of 64
SlNo
CROP Area (in Lakh hactares) Productivity (Kgs/hect) Production (in Lakh tonnes)
NormalEst. Kharif
2014Target
2015Normal
Est. Kharif 2014
Target 2015
Normal Est. Kharif 2014Target
20151 Rice 16.42 16.35 2667 3073 43.80 50.24 2 Jowar 0.33 0.37 1720 1841 0.56 0.68 3 Bajra 0.40 0.25 1706 1282 0.69 0.32 4 Maize 0.75 1.00 3775 3260 2.85 3.26 5 Ragi 0.36 0.29 1017 1017 0.36 0.29
Coarse Grain 2.12 2.08 4.68 4.68 6 Redgram 2.05 1.46 443 585 0.91 0.85 7 Greengram 0.28 0.11 353 907 0.10 0.1 8 Blackgram 0.20 0.19 520 1089 0.10 0.21
Total Pulses 2.67 1.95 1.19 1.26 Total Foodgrains 21.22 20.38 49.67 56.18 9 Groundnut 10.91 7.60 512 413 5.59 3.14
10 Sesamum 0.35 0.21 250 274 0.09 0.06 11 Castor 0.87 0.46 415 482 0.36 0.22 12 Sunflower 0.34 0.11 552 559 0.19 0.06 13 Soyabean 0.02 0.01 1875 1509 0.03 0.02
Total Oilseeds 12.98 9.00 16.76 16.82 14 Cotton 4.84 8.15 446 589 12.72 28.24 15 Mesta 0.20 0.07 1510 1228 1.64 0.48 16 Chillies 1.09 1.09 3930 3934 4.29 4.29 17 Sugarcane 1.50 1.39 77920 77607 116.57 107.87 18 Onion 0.24 0.29 17174 18299 4.16 5.31 19 Turmeric 0.19 0.17 7935 7923 1.48 1.34
Total Cropped Area 42.27 40.54
KHARIF PROSPECTS 2015 COMPARED TO KHARIF 2014 AND NORMAL
KHARIF PROSPECTS 2015 COMPARED TO KHARIF 2014 AND NORMAL
Area in Lakh ha, Productivity in Kgs/ha & Prodcution in LMTs(Provisional)

7 of 64
Food Grains Production – All India Vs Andhra Pradesh Food Grains Production – All India Vs Andhra Pradesh
Sl. No.
Year All India Production
A.P. Production
%
1 2008-09 234.47 12.16 5.2
2 2009-10 218.20 10.41 4.8
3 2010-11 235.88 11.06 4.7
4 2011-12 250.42 10.90 4.4
5 2012-13 257.13 10.50 4.1
6 2013-14 263.20 11.70 4.4
7 2014-15 *11.35
(Million Tonnes)
* Source : DES Revised 2nd Advance Estimates
8 of 64
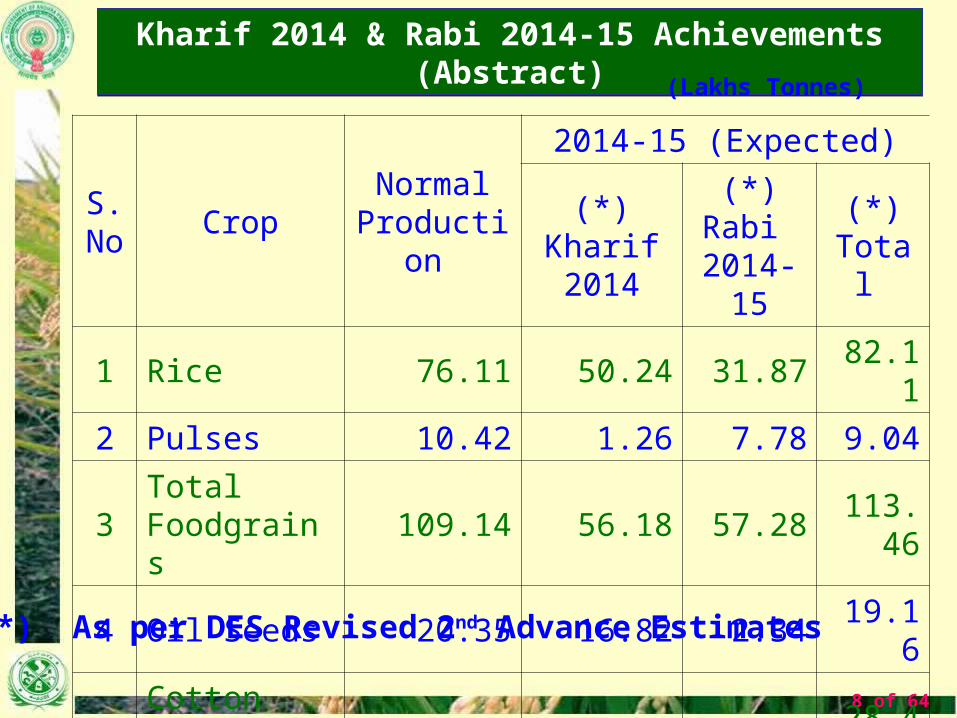
Kharif 2014 & Rabi 2014-15 Achievements (Abstract)Kharif 2014 & Rabi 2014-15 Achievements (Abstract)
(Lakhs Tonnes)
S. No
CropNormal
Production
2014-15 (Expected)
(*) Kharif 2014
(*) Rabi 2014-15
(*) Total
1 Rice 76.11 50.24 31.87 82.11
2 Pulses 10.42 1.26 7.78 9.04
3Total Foodgrains
109.14 56.18 57.28 113.46
4 Oil Seeds 20.35 16.82 2.34 19.16
5Cotton (Lakh bales)
12.78 28.24 0.17 28.41
(*) As per DES Revised 2nd Advance Estimates

•Steps to revive the non functioning AMC STLs is under progress.
•Under NMSA 5 MSTLs have been sanctioned to the state. The work is under progress.
9
S. No
Type of Soil Testing Lab Nos Facility
1 Regional Soil Testing Labs
1 Macro, Micro nutrient & water analysis.
2 District Soil Testing Lab 16 Macro, Micro nutrient & water analysis
3 Mobile labs 4 Macronutrients.
4 Agril. Market Committee level labs
30 Macronutrients.
(Out of 30, 17 AMC STLs are functioning)
Total 51
SOIL TESTING PROGRAMMESOIL TESTING PROGRAMME

S.No Component Target for 2014-15
Achievement
1 Macronutrient analysis 169000 180685
2 Micronutrient analysis 96400 88938
3 Water analysis 13220 18013
4 Distribution of soil Health cards 169000 163564 cards onlined
10
• As part of Agrisnet portal – software to computerize soil test results was developed and the results are being onlined.
• Facility to send SMS to farmers mobile in local language immediately after analysis has been launched by Department of Agriculture, AP on 8th Feb 2014.
• Based on the soil analysis results micronutrients and Gypsum are being supplied to farmers on 50% subsidy. During 2014-15 Zinc Sulphate 6745Mtons, Boron 182.96Mtons and Gypsum 17046 Mtons has been supplied to the farmers under various schemes.
Soil sample Targets & Achievements- 2014-15Soil sample Targets & Achievements- 2014-15

SOIL TESTING PROGRAMME IN AP 2015-16
SOIL SAMPLES COLLECTION:•Special drive has been taken up for soil samples collection.
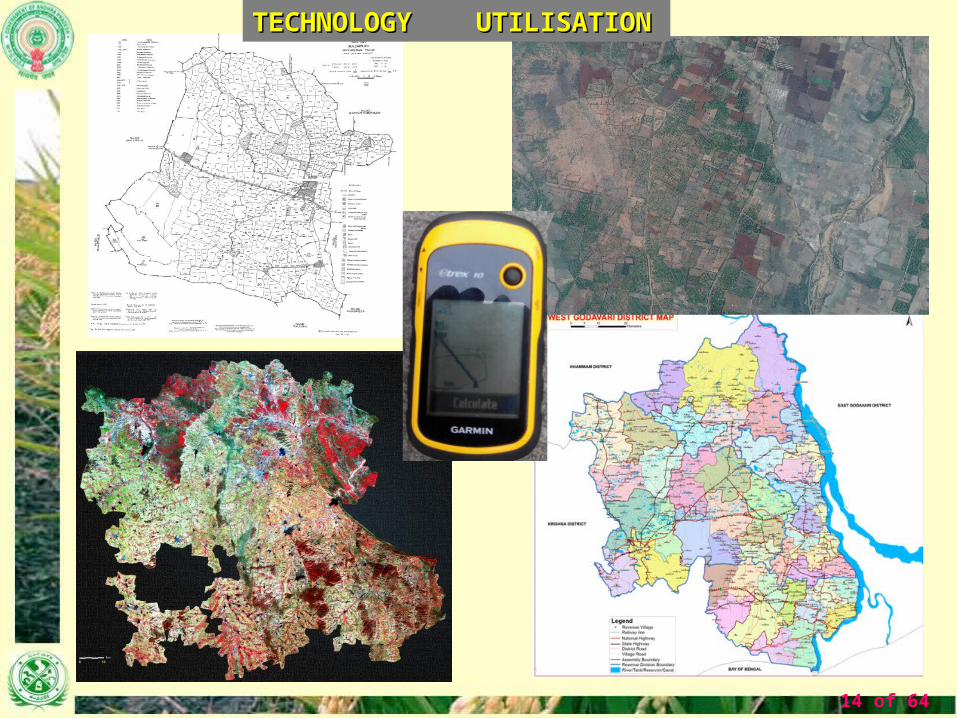
•Every Soil sample location is recorded by GPS instrument
•1983 GPS instruments have been provided to field functionaries through State Govt funds . •3,04,495 soil samples are planned to collect during 2015-16 @ 20-25 samples per revenue village.
•Campaigns are being conducted to create awareness on importance of soil sampling & process to be adopted for soil sample collection by adopting latest geo-spatial data & techniques.
•The sample collection targets week wise have been communicated & samples are being collected involving all the Dept officers & farmers
Contd…

• Expression of Interest has been invited from Companies/ Registered NGO’s/Institutes/Associations/Organizations etc having experience of satisfactory and successful work in rural areas of AP in soil testing on PPP mode.
• Soil samples are being collected based on the norms given by GOI covering both irrigated & rain fed areas, covering farmers from marginal, small, semi medium, medium and large farms.
• The results of Soil samples will be uploaded to Agrisnet portal of Dept of Ag, Govt of AP.
• Soil analysis results will also be sent to farmers’ through SMS to their mobile phones in Telugu.

13 of 64
• Soil health cards will be distributed to farmers before commencement of sowings.
• Village level interactive meetings will be arranged on Soil health status and farmers will be provided with recommendations based on soil test results to promote balanced & Integrated Nutrient Management (INM).
• Village level soil fertility maps will be prepared based on the soil test data.
• Micro-nutrient deficient areas will identified based on Soil test data & the required quantities of micronutrients will be distributed to farmers on 50% subsidy.
14 of 64
TECHNOLOGY UTILISATIONTECHNOLOGY UTILISATION

CAPACITY BUILDING IN USING GPS & CAPACITY BUILDING IN USING GPS & MAPSMAPS

FIELD FIELD ORIENTATIONORIENTATION

SOIL HEALTH CARD OF AP:

18 of 64