1 200 pt 300 pt 400 pt 500 pt 100 pt 200 pt 300 pt 400 pt 500 pt 100 pt 200 pt 300 pt 400 pt 500 pt...
TRANSCRIPT
1
200 pt
300 pt
400 pt
500 pt
100 pt
200 pt
300 pt
400 pt
500 pt
100 pt
200 pt
300 pt
400 pt
500 pt
100 pt
200 pt
300 pt
400 pt
500 pt
100 pt
200 pt
300 pt
400 pt
500 pt
100 pt
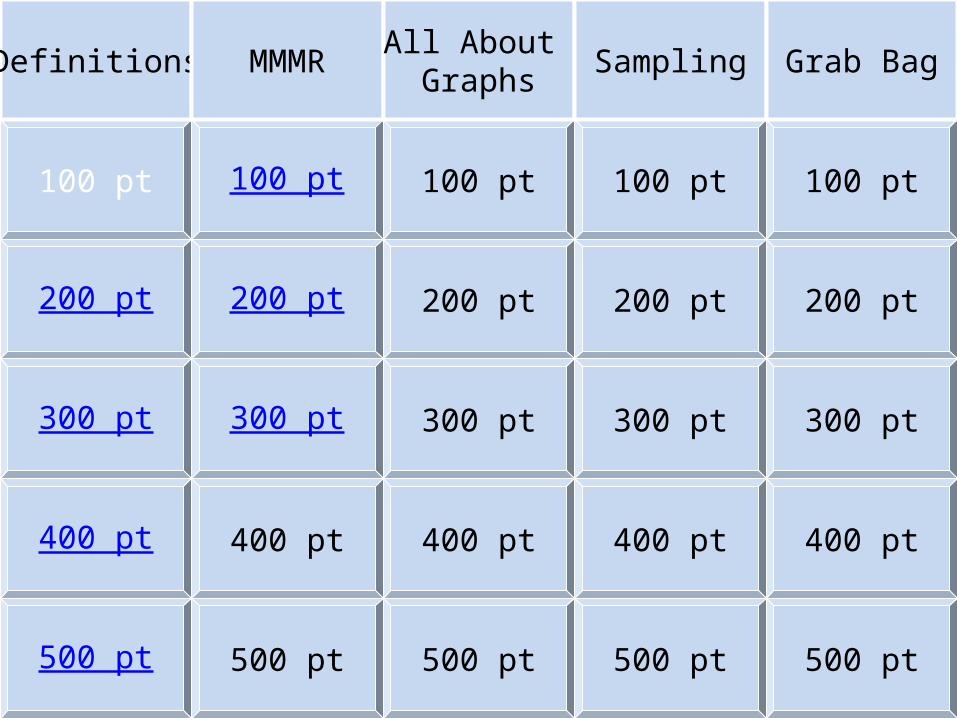
Definitions MMMRAll About
GraphsSampling Grab Bag
2
This is the difference between the largest number and smallest
number in a data set.
3
What is the range?
4
This number is found by adding all of the numbers up and dividing by however many numbers we have.
5
What is the mean?

6
This is the way that a histogram differs from a bar graph.
7
A histogram has intervals.A bar graph has categories.
There are no spaces between the bars in a histogram.

8
These are the items in a five number summary.

9
What are the minimum, lower quartile, median, upper quartile,
and the maximum?

10
This sample involves only those who want to participate in the sampling.
11
What is a voluntary response sample?

12
This is the median of 92, 98, 15, 92, 87, and 92.

13
What is 92?

14
This is the mean of 92, 98, 15, 92, 87, and 92 rounded to the nearest
whole number.
15
What is 79?
16
This is the range of 378, 410, 370, 336, 361, 394, 345, 328, 388, and
339.

17
What is 82?
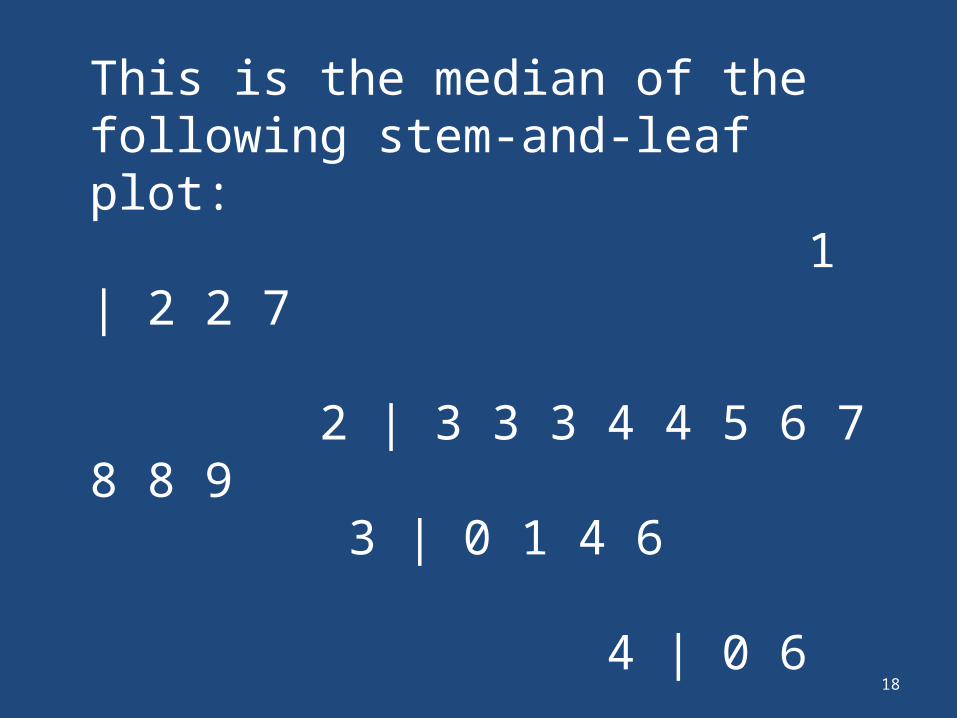
18
This is the median of the following stem-and-leaf plot: 1 | 2 2 7 2 | 3 3 3 4 4 5 6 7 8 8 9 3 | 0 1 4 6 4 | 0 6
19
What is 26.5?
20
This is the inter-quartile range of 378, 410, 370, 336, 361, 394, 345,
328, 388, and 339.
21
What is 49?
22
This lists one place value on one side of a vertical bar, and the other in
numerical order on the other side. It usually also gives a key.

23
What is a stem-and-leaf plot?

24
This is a chart that uses tally marks and categories to organize data.
25
What is a frequency table?

26
Use the double box plot below.
This is the difference between the ranges of 7th and 8th grade
donations.

27
What is 15?
28
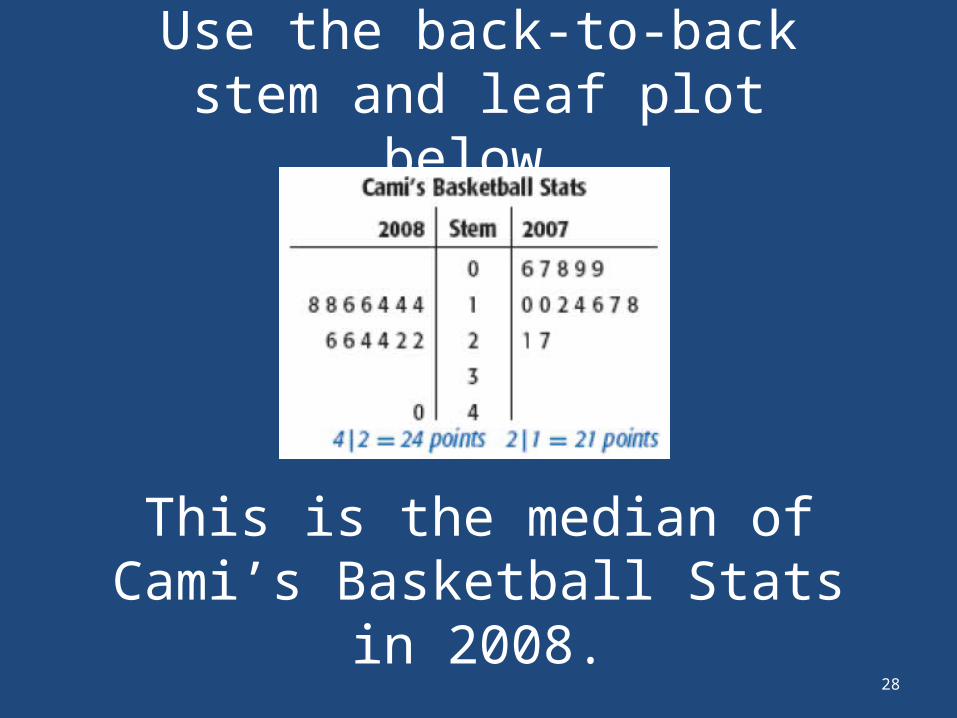
Use the back-to-back stem and leaf plot below.
This is the median of Cami’s Basketball Stats in 2008.
29
What is 20?

30
Use the line plot below.
This is the mean score of the restaurant survey rounded to the
nearest whole number.

31
What is 12?

32
What type of sampling is used below?
A hospital’s administration is interested in opening a gym for its
employees. They ask each member of the night-shift emergency room staff
if they would use it.

33
What is a Convenience Sample?
34
What type of sampling is used below?
Joe is concerned about the topsoil in his backyard. He divides the backyard into 5
equal sections, and then randomly removes 1-inch squares of topsoil from
each of the 5 sections to be tested.

35
What is a Stratified Random Sample?

36
Zack is trying to decide which golf course is the best. According to his random survey below, how many
people would vote for Rolling Meadows out of 150 people?

37
What is 42 people?

38
Amy captures and tags 75 monkeys. Later, she observes 200 monkeys
and 40 of them are tagged. Predict how many monkeys are in the
forest.

39
What is 375 monkeys?
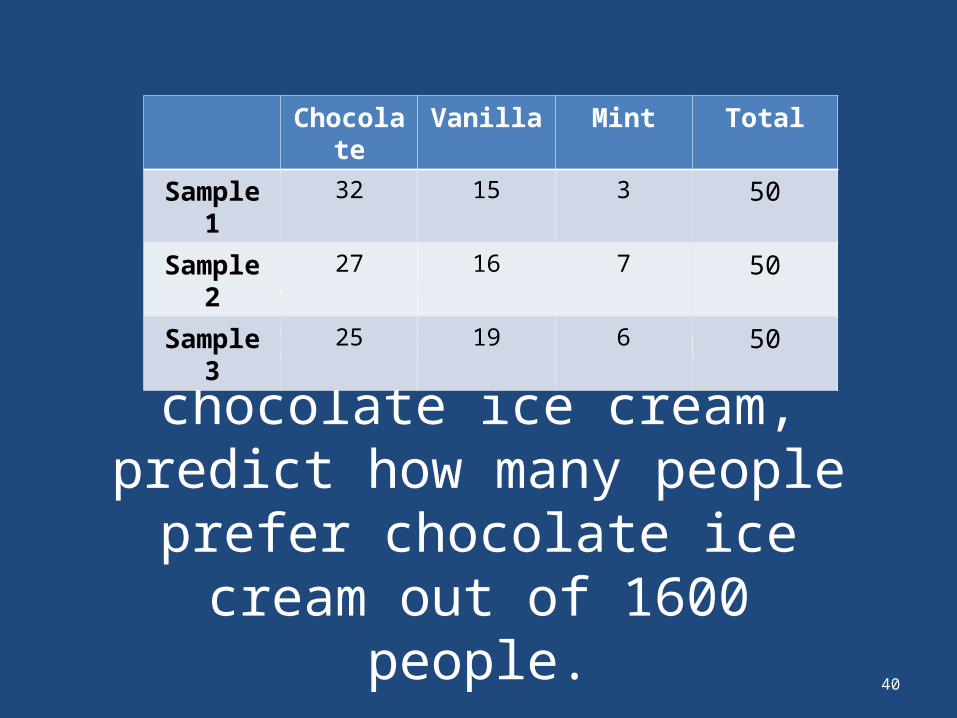
40
Using the mean of all three samples for chocolate ice cream, predict how
many people prefer chocolate ice cream out of 1600 people.
Chocolate Vanilla Mint Total
Sample 1 32 15 3 50
Sample 2 27 16 7 50
Sample 3 25 19 6 50

41
What is 896 people?

42
This is the number that appears most frequently in a data set.

43
What is the mode?

44
Mr. Roberts asks every 5th student that walks in his classroom if they
plan on attending the pep rally.
What type of sampling is used below?

45
What is a Systematic Random Sample?

46
Ms. Hernandez determined that 60% of her students in her classes
brought an umbrella to school when it rained. If she has a total of 150
students predict how many of them brought an umbrella.

47
What is 90 students?
48
Anna’s test scores are 98, 90, 93, and 89 on the last four tests she
took this semester in social studies. This is the score she needs on her
last test to get a mean of 90.
49
What is 80?

50
Using the mean of all three samples for vanilla ice cream and mint ice cream, predict how many more
people like vanilla than mint out of 1600 people.
Chocolate Vanilla Mint Total
Sample 1 32 15 3 50
Sample 2 27 16 7 50
Sample 3 25 20 5 50

51
What is 384 people?