1. 2 understanding atmospheric & oceanic flows: laboratory application of cross-correlation...
Post on 20-Dec-2015
217 views
TRANSCRIPT

1
2
Understanding Atmospheric & Oceanic Flows:Understanding Atmospheric & Oceanic Flows: Laboratory Application of Cross-Correlation Laboratory Application of Cross-Correlation
David M. HollandDavid M. Holland
Courant Institute of Mathematical SciencesCourant Institute of Mathematical Sciences
New York UniversityNew York University
June 10June 10thth, 2003, 2003
Faculty Resource Network SeminarFaculty Resource Network Seminar

3
Seminar Schedule Seminar Schedule
09:00 – 10:00 Lecture – Cross Correlation
10:00 – 10:30 Laboratory Visit
(Room 103, 251 Mercer St. WWH)
10:30 – 11:30 MATLAB Computing Exercises
11:30 – 12:00 Group Presentations
(Answers to MATLAB Exercises)

4
Introduction to LectureIntroduction to Lecture
Atmospheric & Oceanic Flows
Planetary Scale Flows – Feature Tracking
Laboratory Scale Flows – Particle Image Velocimetry
Cross Correlation Analysis
MATLAB Implementation – Particle Image Velocimetry

5
Atmospheric FlowsAtmospheric Flows
Jet Stream (Discovery Video)
Hurricane
Tornado

6
Oceanic FlowsOceanic Flows
Great Conveyor Belt
Gulf Stream
Further Information: Read Chapter 1 of Handout:
The Oceans and Climate by Bigg

7
Image “a” Image “b”
Here are two sequential images (a and b) of chlorophyll-a data collected over the US east coast on May 8, 2000 by two different satellites at time spacing of 67 minutes.
Planetary Scale Flows – Planetary Scale Flows – Feature TrackingFeature Tracking

8
Flow Field Vectors - Derived by Feature Tracking Algorithm
Question: How are these flow arrows derived?
Planetary Scale Flows Planetary Scale Flows – Feature TrackingFeature Tracking

9
Laboratory Analog of Planetary Scale Flows (Jet Stream)
PIV Principles
Further Information: Read Chapter 3 of Handout:
Particle Image Velocimetry by Raffel et al.
NYU Laboratory
Laboratory Scale Flows –Laboratory Scale Flows –Particle Image Velocimetry (PIV)Particle Image Velocimetry (PIV)
10
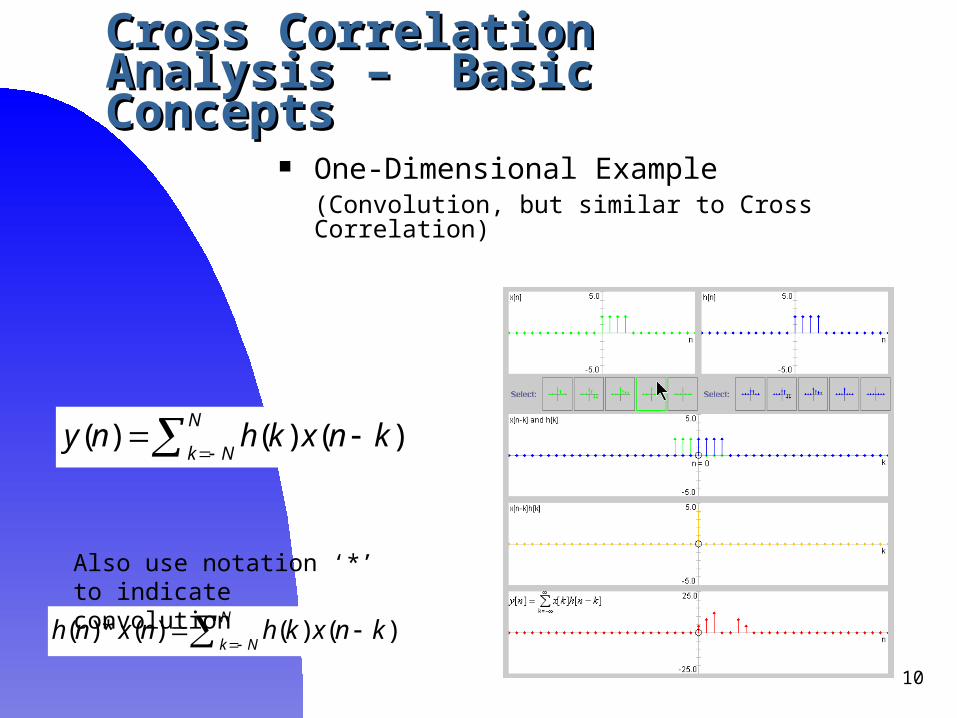
Cross Correlation Analysis – Cross Correlation Analysis – Basic ConceptsBasic Concepts
One-Dimensional Example(Convolution, but similar to Cross Correlation)
( ) ( ) ( )N
k Ny n h k x n k
( )* ( ) ( ) ( )N
k Nh n x n h k x n k
Also use notation ‘*’ to indicate convolution

11
Cross Correlation Analysis –Cross Correlation Analysis –Image Displacement Image Displacement
Demonstration of Cross Correlation to find (dis)placement of one image within another
(see MATLAB handout for details)
MATLAB • “demos”• Toolbox “Image Processing”• “Image Registration”• Set Path to “.”• Enter Commands

12
Cross Correlation Analysis –Cross Correlation Analysis –Fast Fourier TransformFast Fourier Transform
One-Dimensional Example
0
1 1
2 2
( )
+ cos( )
+ cos(2 )
... + cos( )
o
o
N o N
x t a
a t
a t
a N t

13
Cross Correlation Analysis – Cross Correlation Analysis – Convolution TheoremConvolution Theorem
One-Dimensional Example
(using functions f(k) and g(k))
( )* ( ) ( ) ( )N
k Nf n g n f k g n k
Convolution Theorem gives Convolution as Inverse Transform of Product of Fourier Transforms
( )* ( ) ( ) ( )N
k NInverse FourierTransform F v G v f k g n k
where F and G represent Fourier Transform of f and g.

14
MATLAB Implementation –MATLAB Implementation –Particle Image Velocimetry (PIV) Particle Image Velocimetry (PIV)

15
Concluding RemarksConcluding Remarks –– Cross Correlation
Atmospheric & Oceanic Flows are Complex – Laboratory Models Provide Insight
Particle Imaging Velocimetry – Non-Invasive Measurement
Cross Correlation Analysis – Plays Central Role
Future Research – Faster/Better Computer Algorithms

16
Concluding RemarksConcluding Remarks –– Educational Applications
MATLAB is a powerful teaching tool Various Demo Modules for most all
aspects of Mathematics
Interesting Applications of Statistics and Probability in the Geosciences (e.g., Fluid Flow Measurement)
This Seminar Web Site available http://fish.cims.nyu.edu/educational_pages/frn_2003/syllabus.html (see Handout)

17
Seminar Schedule – Seminar Schedule – Remainder of MorningRemainder of Morning
10:00 – 10:30 Physical Laboratory Visit (Room 103, 251 Mercer St.)
(see NYU Map Handout for details)
10:30 – 11:30 MATLAB Computing Exercises (Break into Groups of Two) (Room 305, 197 Mercer St.)
11:30 – 12:00 Group Presentations (Answers to MATLAB Exercises)

18