1. 2 thruway authority goals the authority is committed to: maintaining & operating the highway...
TRANSCRIPT

1

2
Thruway Authority Goals
The Authority is committed to:
Maintaining & operating the highway
Implementing capital improvement program to deliver high levels of safety & service
Improving the travelers’ experience

3
Fatality Rate 1954 through 2006
0
1
2
3
4
5
6
7
'54 '57 '60 '63 '66 '69 '72 '75 '78 '81 '84 '87 '90 '93 '96 '99 '02 '05
Fat
aliti
es p
er 1
00,0
00,0
00 V
ehic
le M
iles
National Thruway

4
Why Tolls
• In 1989 (Chapter 634), Governor Cuomo and the State Legislature created the Thruway Authority Transition Advisory Council and charged it with the responsibility to "make recommendations concerning the future of the Thruway and the Thruway Authority after the scheduled retirement of the Authority's bondable debt in the year 1996..."
• The Advisory Council concluded that tolls were the preferable choice because it was more appropriate for those who actually use the Thruway to pay for its maintenance and upkeep rather than the taxpayers of New York generally. Therefore the Advisory Council recommended to the Legislature and the Governor, that tolls be maintained and that the Authority, with its bonding ability, be retained to meet the highway
transportation needs along the Thruway corridor.

5
Why Tolls
• Instead of making the Thruway toll free and turning over operation to DOT, in 1992, the Governor and the State Legislature enacted legislation to further expand the responsibilities of the Authority to include the operation and maintenance of the canal system and authorized additional indebtedness secured by toll revenues to assist with the financing of this new responsibility.
• Unlike other highways in New York State, the Thruway Authority receives no state tax dollars and depends on tolls to maintain, operate, and police its roads and bridges. Because the Thruway is a toll road, only the people who use it pay for it. In addition, an estimated one-third of the tolls collected are paid by out-of-state drivers who use the Thruway.

6
Support to Retain Tolls in 1991

7
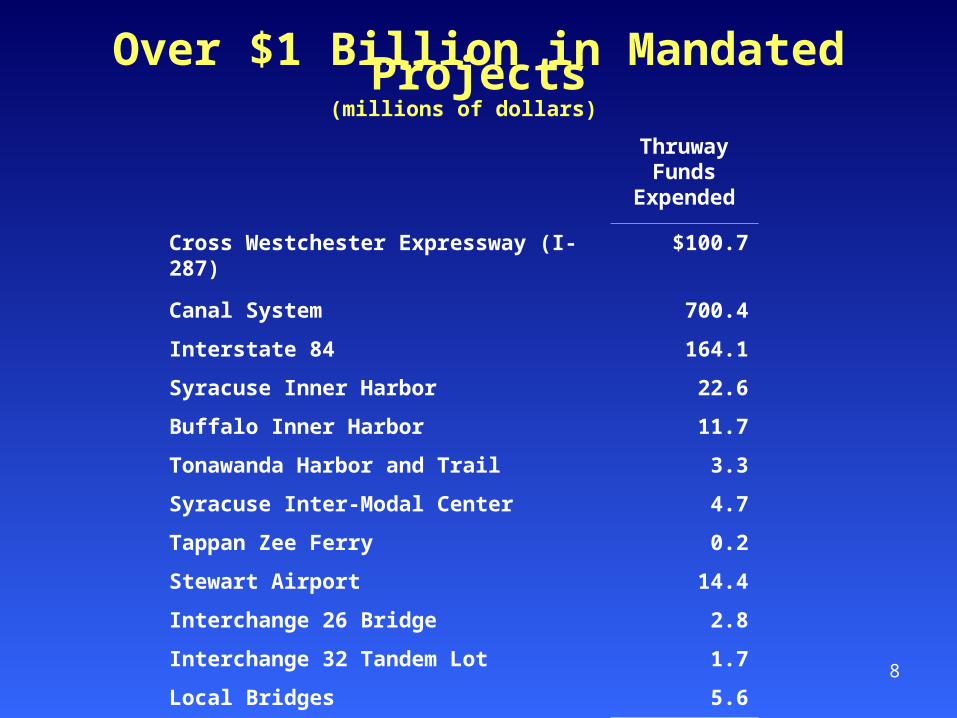
Mandated Responsibilities in the Early ’90s
8
Thruway Funds
Expended
Cross Westchester Expressway (I-287) $100.7
Canal System 700.4
Interstate 84 164.1
Syracuse Inner Harbor 22.6
Buffalo Inner Harbor 11.7
Tonawanda Harbor and Trail 3.3
Syracuse Inter-Modal Center 4.7
Tappan Zee Ferry 0.2
Stewart Airport 14.4
Interchange 26 Bridge 2.8
Interchange 32 Tandem Lot 1.7
Local Bridges 5.6
Total $1,032.2
Over $1 Billion in Mandated Projects(millions of dollars)

9
Capital Program
10
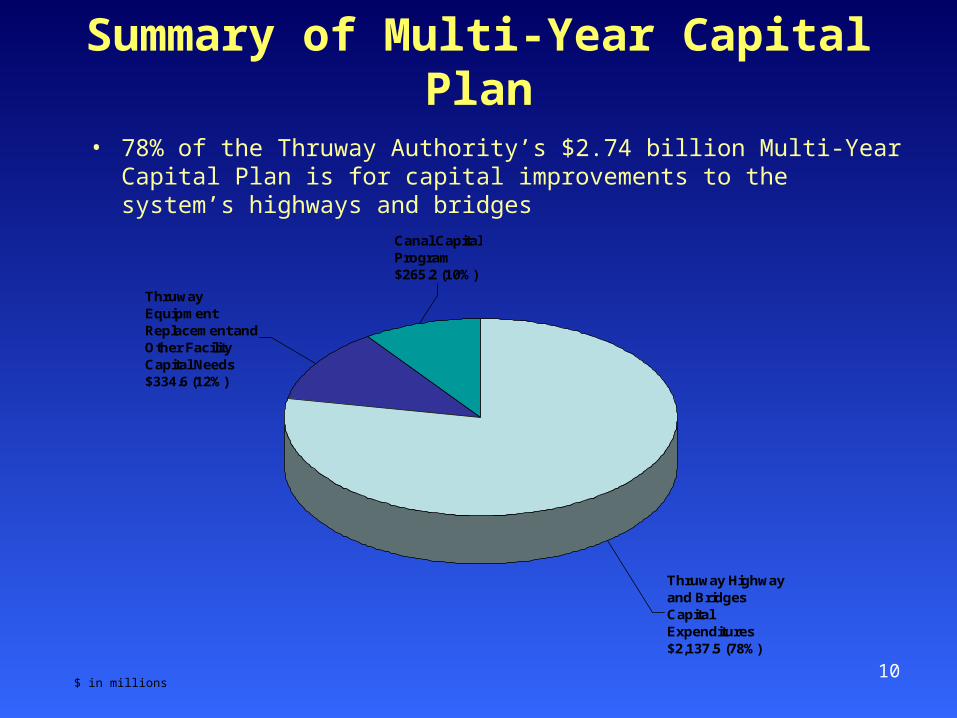
Summary of Multi-Year Capital Plan
• 78% of the Thruway Authority’s $2.74 billion Multi-Year Capital Plan is for capital improvements to the system’s highways and bridges
$ in millions
Thruway Equipment Replacement and Other Facility Capital Needs $334.6 (12%)
Canal Capital Program$265.2 (10%)
Thruway Highway and Bridges Capital Expenditures $2,137.5 (78%)

11
More than 300 projects in the 2005 -2011 Capital Plan; between 2005 and 2007 the Authority has let 86 projects at a cost of $746 million statewide; more than $1.3 billion statewide remains to be let through 2011 (214 projects remain)
520 miles of new and/or rehabilitated highway
196 new, rehabilitated, or improved bridges
195 additional truck parking spaces
7 additional noise barrier locations
56 additional higher-speed E-ZPass lanes
13 additional highway-speed E-ZPass lanes
6 additional dedicated E-ZPass lanes
Maintaining the Infrastructure

12
New York Division’s Significant Infrastructure Improvement Projects
Tappan Zee Bridge - Deck rehabilitation and substructure repairs ($147 million)
Woodbury Toll Barrier - Reconstruction for Highway Speed E-ZPass ($60-$70 million)
I-84/I-87 Interchange17 Contract 3 - Reconstruction, new bridges, direct connection to I-84 ($67 million)
77 miles of roadway improvements; 46 bridge rehabilitation, replacement or improvement projects

13
Albany Division’s Significant Infrastructure Improvement Projects
Interchange 23-24 - Pavement reconstruction with congestion relief ($72 million)
Interchange 24-25 - Pavement reconstruction ($68 million)
Castleton Bridge - Substructure rehabilitation ($32 million)
150 miles of roadway improvements; 24 bridge rehabilitation, replacement or improvement projects
14
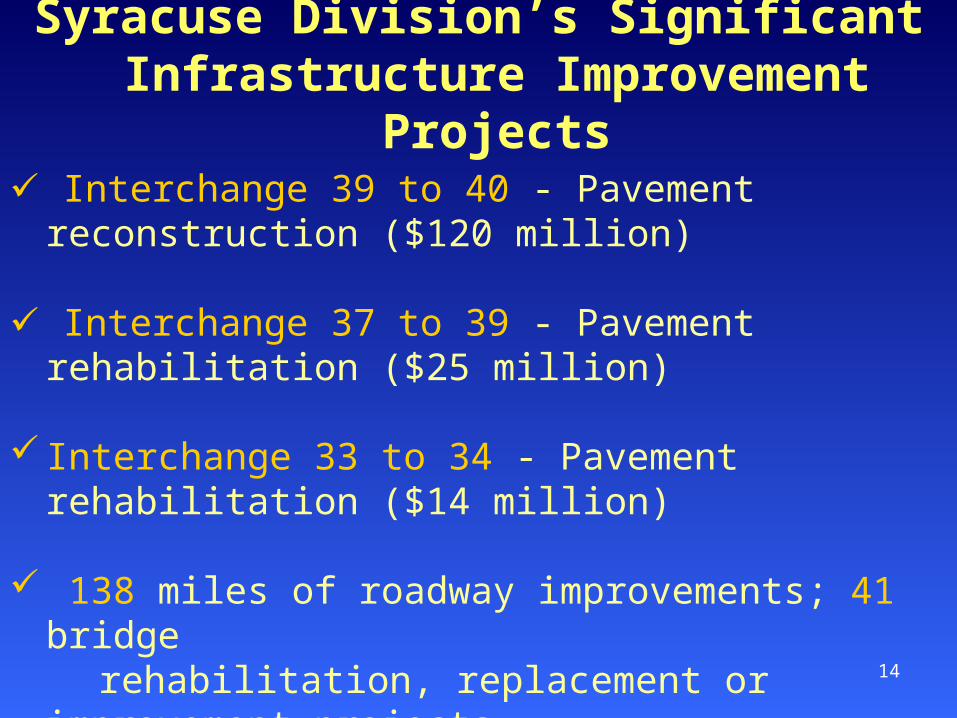
Syracuse Division’s Significant Infrastructure Improvement Projects
Interchange 39 to 40 - Pavement reconstruction ($120 million)
Interchange 37 to 39 - Pavement rehabilitation ($25 million)
Interchange 33 to 34 - Pavement rehabilitation ($14 million)
138 miles of roadway improvements; 41 bridge rehabilitation, replacement or improvement projects

15
Buffalo Division’s Significant Infrastructure Improvement Projects
Interchange 57 to 58 - Pavement and bridge rehabilitation ($69 million)
Interchange 54 to Lackawanna Barrier - Pavement and bridge rehabilitation and replacement ($77 million)
Williamsville Toll Barrier - Relocation ($67 million)
155 miles of roadway improvements; 85 bridge rehabilitation, replacement or improvement projects
16
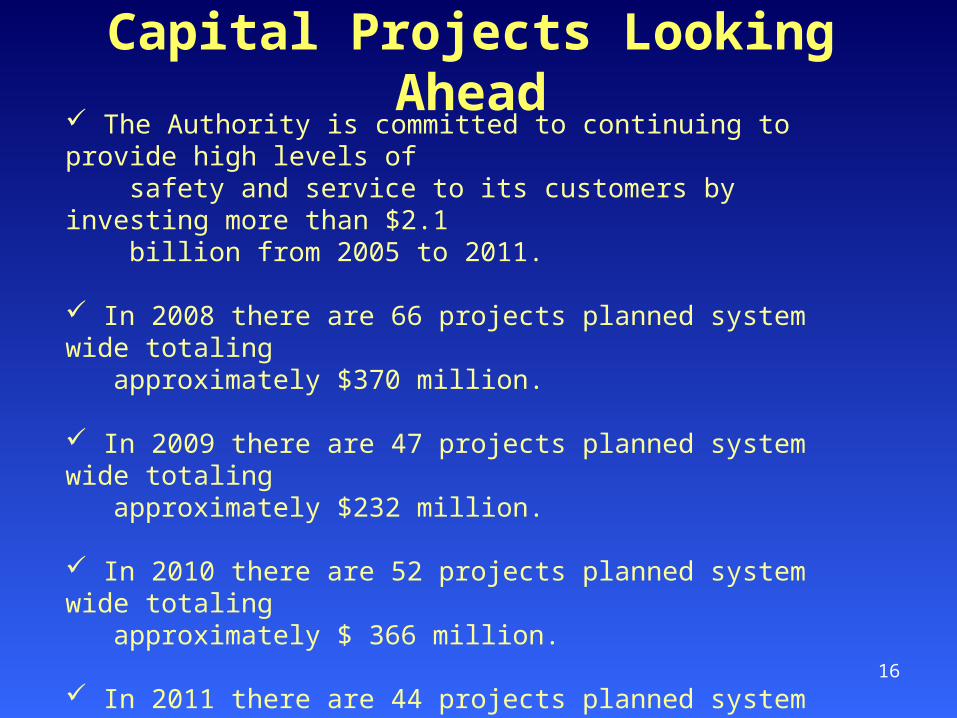
Capital Projects Looking Ahead The Authority is committed to continuing to provide high levels of safety and service to its customers by investing more than $2.1 billion from 2005 to 2011.
In 2008 there are 66 projects planned system wide totaling approximately $370 million.
In 2009 there are 47 projects planned system wide totaling approximately $232 million.
In 2010 there are 52 projects planned system wide totaling approximately $ 366 million.
In 2011 there are 44 projects planned system wide totaling approximately $355 million.
2008 through 2011, there is approximately $1.3 billion earmarked for future improvement projects system wide.
17
Project Selection Process Overview
Division and Headquarters maintenance engineers evaluate overall condition data on a system and project level basis
Review the work history (both capital and maintenance) on each project
Evaluate treatment options (including continued maintenance)
Select projects for inclusion in proposed capital plan
Evaluate proposed program versus available financial resources and, based on priority, adjust project selection and project scopes as needed to meet the available finances

18
Surface Pavement/BridgeCondition Trends

19
Historical Capital Expenditures(millions of dollars)
0
100
200
300
400
500
600

20
Historical Capital ExpendituresAdjusted for Inflation (millions of 2006 dollars)
0
100
200
300
400
500
600
700
800

21
Impacts of Deferring Capital Programon Pavement
Uneven pavement
Increased number of potholes
Increased chance of hydroplaning (rutting) More frequent unscheduled lane closures for repair
Deferring preventative maintenance of highways allows for accelerated deterioration of the underlying pavement structure and reduces the life of the pavement increasing future costs
Reduction in overall safety
22
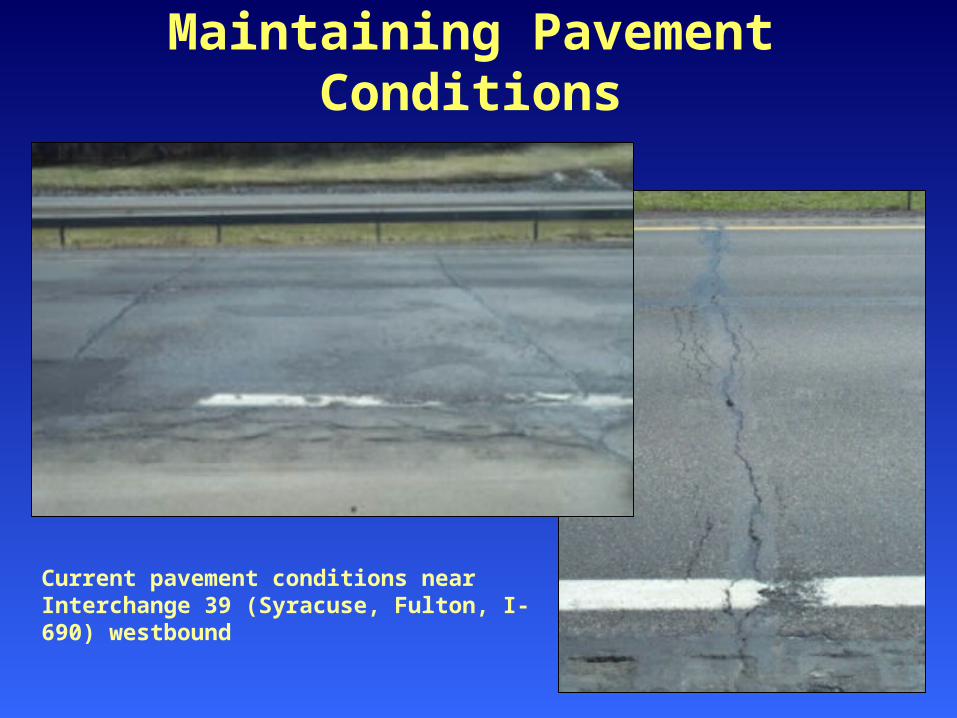
Maintaining Pavement Conditions
Current pavement conditions near Interchange 39 (Syracuse, Fulton, I-690) westbound

23
Impacts of Deferring Capital Program on Bridges
Deferring major rehabilitations and replacements results in negative impacts to the structural integrity of the bridge
Deferring preventative maintenance will accelerate the deterioration of the structural elements of the bridge – leading to more extensive repairs and/or replacements
While the Authority has never had to post a mainline bridge, eventually there could be a need to institute weight limit restrictions (load posting), which would significantly impact commerce.
Reduction in overall safety

24
Maintaining Bridge Conditions
Current Tappan Zee Bridge conditions
25
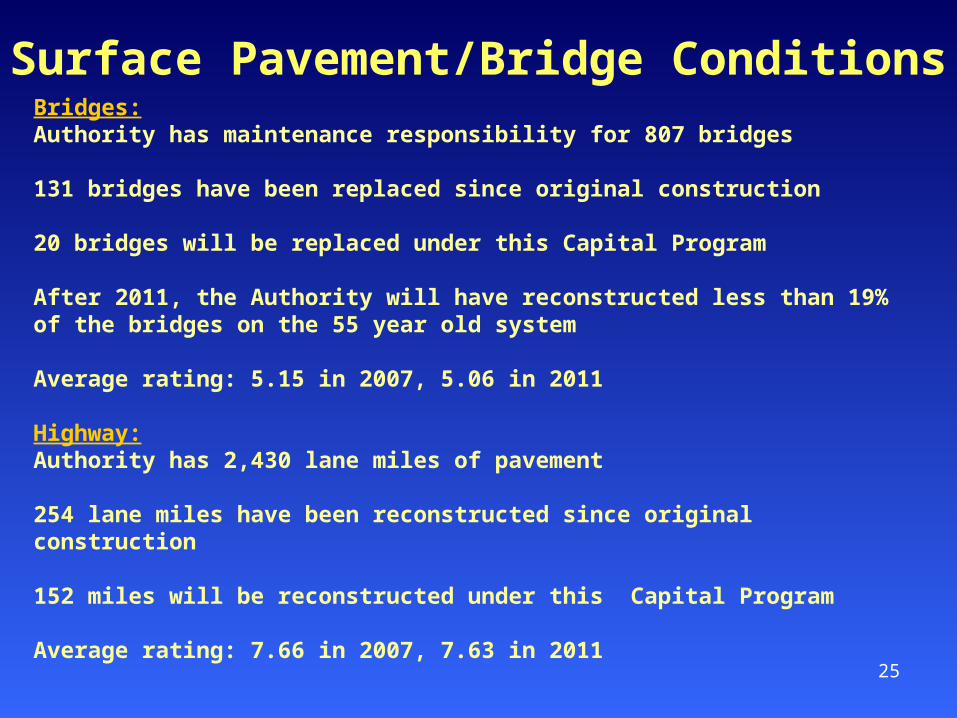
Bridges:Authority has maintenance responsibility for 807 bridges
131 bridges have been replaced since original construction
20 bridges will be replaced under this Capital Program
After 2011, the Authority will have reconstructed less than 19% of the bridges on the 55 year old system
Average rating: 5.15 in 2007, 5.06 in 2011
Highway:Authority has 2,430 lane miles of pavement
254 lane miles have been reconstructed since original construction
152 miles will be reconstructed under this Capital Program
Average rating: 7.66 in 2007, 7.63 in 2011
Surface Pavement/Bridge Conditions

26
Out-Year Gaps in Multi-Year Financial Plan
27
Stantec Toll Revenue Projections
As a result of several factors, Stantec, an outside traffic engineering firm, has revised its traffic and revenue projections for 2007-2011 to show the following:
Traffic Growth Revised Downward
Shorter Average Trip Lengths
Increased E-ZPass Usage
Larger & more frequent fuel price spikes
28
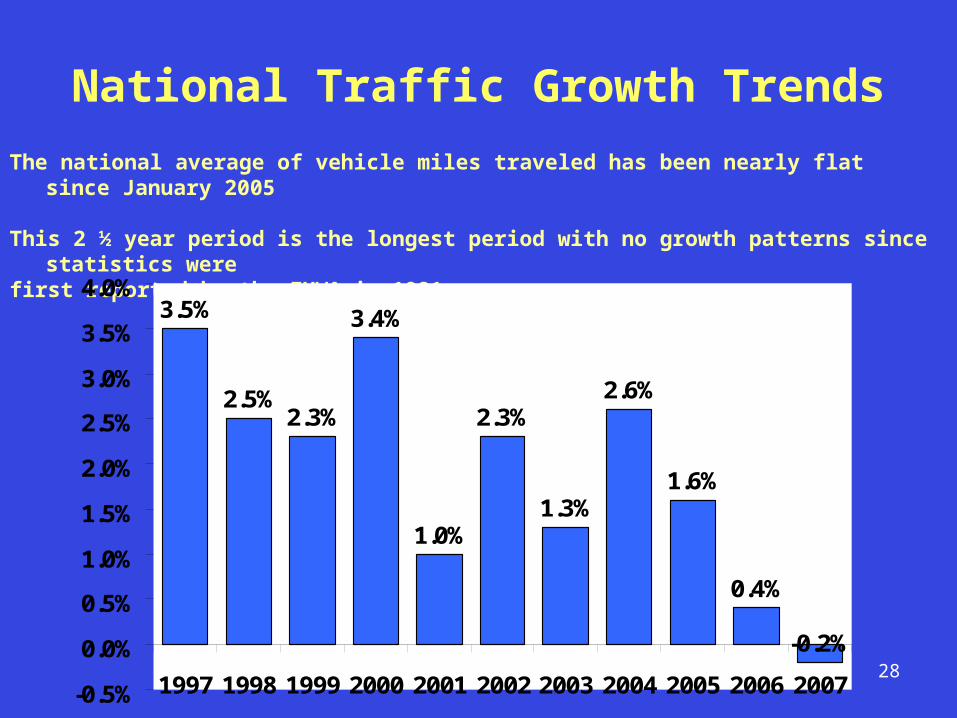
National Traffic Growth Trends
The national average of vehicle miles traveled has been nearly flat since January 2005
This 2 ½ year period is the longest period with no growth patterns since statistics were first reported by the FHWA in 1981
3.5%
2.5%2.3%
3.4%
1.0%
2.3%
1.3%
2.6%
1.6%
0.4%
-0.2%
-0.5%
0.0%
0.5%
1.0%
1.5%
2.0%
2.5%
3.0%
3.5%
4.0%
1997 1998 1999 2000 2001 2002 2003 2004 2005 2006 2007
29
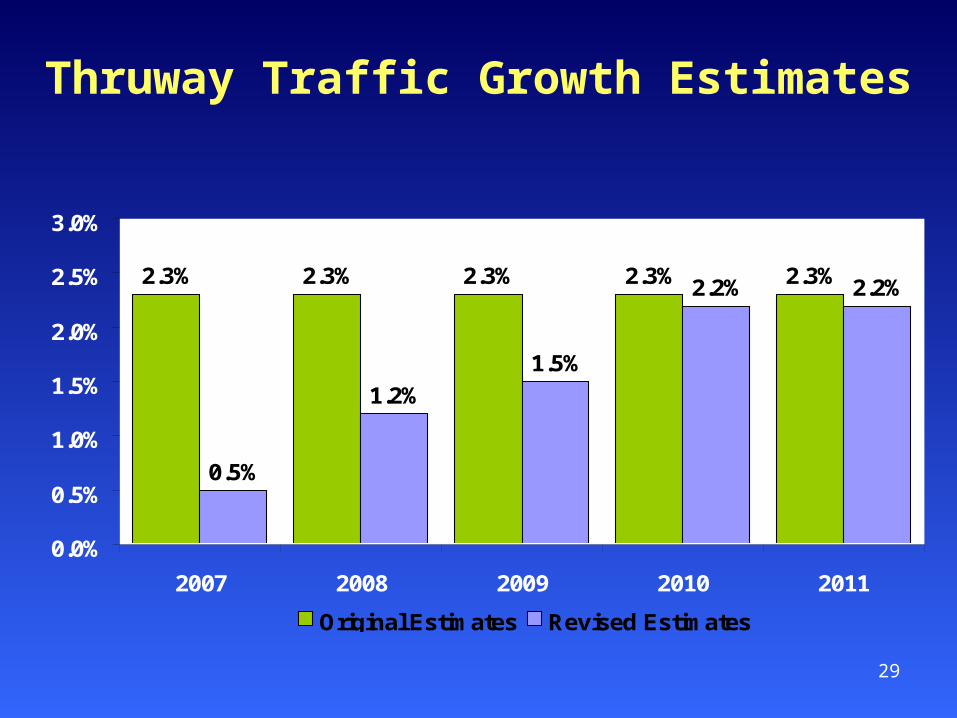
Thruway Traffic Growth Estimates
2.3% 2.3% 2.3% 2.3% 2.3%
0.5%
1.2%
1.5%
2.2% 2.2%
0.0%
0.5%
1.0%
1.5%
2.0%
2.5%
3.0%
2007 2008 2009 2010 2011
Original Estimates Revised Estimates
30
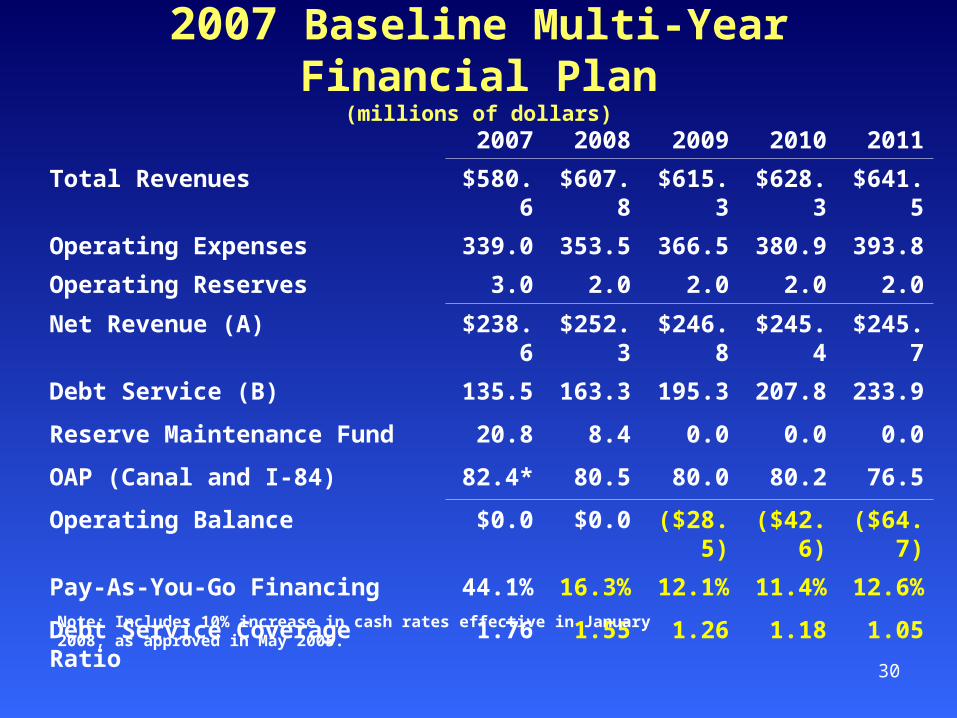
2007 Baseline Multi-Year Financial Plan(millions of dollars)
2007 2008 2009 2010 2011
Total Revenues $580.6 $607.8 $615.3 $628.3 $641.5
Operating Expenses 339.0 353.5 366.5 380.9 393.8
Operating Reserves 3.0 2.0 2.0 2.0 2.0
Net Revenue (A) $238.6 $252.3 $246.8 $245.4 $245.7
Debt Service (B) 135.5 163.3 195.3 207.8 233.9
Reserve Maintenance Fund 20.8 8.4 0.0 0.0 0.0
OAP (Canal and I-84) 82.4* 80.5 80.0 80.2 76.5
Operating Balance $0.0 $0.0 ($28.5) ($42.6) ($64.7)
Pay-As-You-Go Financing 44.1% 16.3% 12.1% 11.4% 12.6%
Debt Service Coverage Ratio 1.76 1.55 1.26 1.18 1.05
Note: Includes 10% increase in cash rates effective in January 2008, as approved in May 2005.

31
Closing the Gaps
Preserve the $2.7 billion Capital Program
Preserve the Commercial Volume & Commuter Discount Programs
Eliminate any anticipated out-year operational gaps
Maintain debt service coverage ratios of at least 1.7 in 2011
Increase pay-as-you-go financing of the Capital Program
Enhance real property revenue
Limit Thruway & OAP operating expenditure growth to 3.1% in 2008
Continue cost containment through 2011- more than 450 positions eliminated since 1995; additional 50 positions eliminated through 2011

32
Proposed Toll Adjustment
Phased in approach so that the proposal can be revisited if circumstances change
E-ZPass Discounts to 5% off cash rates for both passenger and commercial vehicle classes in June 2008, that will remain throughout the plan
5% general toll increase in January 2009
5% general toll increase in January 2010
Implement an increase at the barriers and bridges in 2009 only (except Grand Island where passenger cash customers will see no increase under this proposal)
Increase commercial and towing congestion pricing rates at the Tappan Zee Bridge and Spring Valley in 2010

33
Proposed Toll Adjustment Continued
Increase the fee for mainline commuters under the E-ZPass Annual Permit Program - from $80 to $84 in 2009, and $88 in 2010 (note: the permit plan has been $80 since 1988).
Bridge & barrier commuter discount plan rates increase by 5% in 2009 and 2010 (except Grand Island where residents will see no increase).
The E-ZPass Tappan Zee Bridge Commuter Program will see an increase from $2.00 to $3.00 per trip.
Retain a 10% additional E-ZPass discount for vehicles with high fuel efficiency and super ultra low emissions (Green Pass Program).
Preserve the existing Commercial Volume Discount Program.
34
Impact of Toll Adjustment
If the cash rate for passenger vehicles increased by the rate of inflation, it would increase from 3.1 cents per mile in 1988 to 5.5 cents per mile in 2011. By the end of the proposed plan, in 2011 the cash rate will be 4.7 cents per mile.
Despite the rate of inflation and additional responsibilities given to the Authority since 1991 totaling $1 billion, the proposed increase is less than 1 cent per mile
The cash rate for passenger vehicles under the proposed plan will increase by 0.43 cents per mile and the E-ZPass rate will increase less than 1 cent per mile.

35
Commuter Plan Rates
Annual Permit
TZB
Commuter
New Rochelle
Commuter
GI Bridge Commuter
Harriman/
Yonkers
Commuter
2005 $80.00 $2.00 $1.00 $0.25 $0.50
2008 $80.00 $2.00 $1.00 $0.25 $0.50
2009 $84.00 $3.00 $1.05 $0.26 $0.53
2010 $88.00 $3.00 $1.10 $0.28 $0.55
*The Annual Permit can be used anywhere along the ticketed portion of the system for a flat fee, the first 30 miles or less of each trip is free.

36
Protecting the Daily Commuter
• Annual Permit Plan is $80 (unchanged since 1988), the first 30 miles of each trip is free; proposed to increase from $80 to $84 in 2009, and to $88 in 2010.
• Commuter making 200 round trips annually pays 20 cents per trip if 30 miles or less ($80 fee/400 trips).
• If implemented, the same trip would be 22 cents when fully phased-in, an increase of 2 cents per trip ($88 fee/400 trips).
37
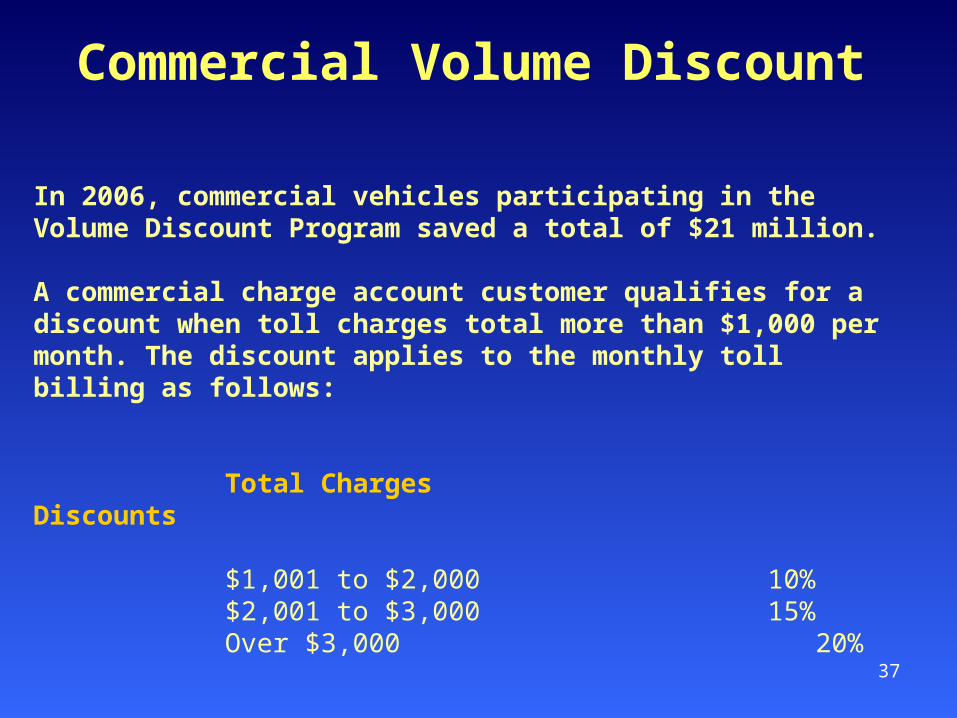
Commercial Volume Discount
In 2006, commercial vehicles participating in the Volume Discount Program saved a total of $21 million.
A commercial charge account customer qualifies for a discount when toll charges total more than $1,000 per month. The discount applies to the monthly toll billing as follows:
Total Charges Discounts
$1,001 to $2,000 10% $2,001 to $3,000 15%Over $3,000 20%

38
Comparing Passenger (2L) Toll Rates
0 5 10 15 20 25 30 35 40
Delaware Turnpike
Pocahontas Parkway
Dulles Greenway
Chesapeake Expressway
John F. Kennedy Highway
Dulles Toll Road
Blue Star Turnpike
Pennsylvania Turnpike
New Jersey Turnpike
Illinois State Toll Highway
NYS Thruway (2011)
Mass. Pike
NYS Thruway (2008)
West Virginia Turnpike
Garden State Parkway
Cents Per Mile
39
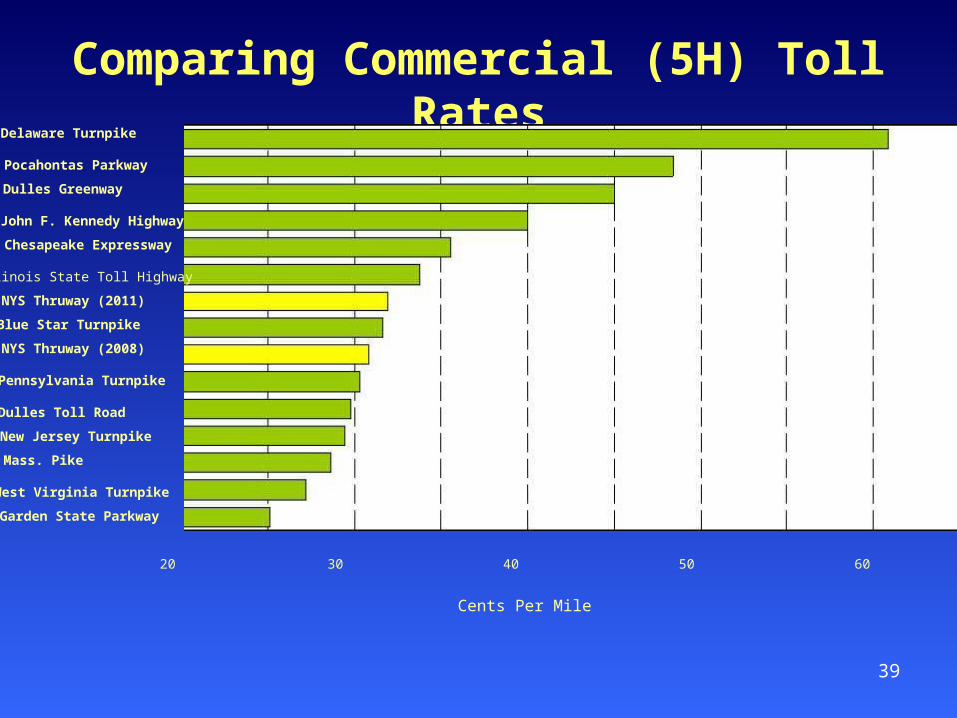
Comparing Commercial (5H) Toll Rates
0 10 20 30 40 50 60 70 80 90
Cents Per Mile
Delaware Turnpike
Pocahontas Parkway
Dulles Greenway
Chesapeake Expressway
John F. Kennedy Highway
Dulles Toll Road
Blue Star Turnpike
Illinois State Toll Highway
NYS Thruway (2011)
NYS Thruway (2008)
Pennsylvania Turnpike
New Jersey Turnpike
Mass. Pike
West Virginia Turnpike
Garden State Parkway

40
Revised Multi-Year Financial Plan(millions of dollars)
Note: Includes 10% increase in cash rates effective in January 2008, as approved in May 2005.
2007 2008 2009 2010 2011
Total Revenues $580.6 $632.7 $713.9 $757.4 $773.8
Operating Expenses 338.0 352.8 365.0 376.8 386.9
Operating Reserves 3.0 2.0 2.0 2.0 2.0
Net Revenue (A) $239.6 $278.0 $346.9 $378.6 $384.9
Debt Service (B) 132.3 163.1 188.9 198.4 218.6
Reserve Maintenance Fund 25.1 34.4 78.2 100.2 90.0
OAP (Canal and I-84) 82.3* 80.5 79.9 80.0 76.3
Operating Balance $0.0 $0.0 $0.0 $0.0 $0.0
Pay-As-You-Go Financing 45.1% 21.1% 28.5% 33.3% 33.5%
Debt Service Coverage Ratio 1.81 1.70 1.84 1.91 1.76

41
The Public Process
Preliminary Board approval to commence the public process
Submission of Financial Reports to the Governor, State Comptroller and Legislative Fiscal Committees (Section 2804 of the Public Authorities Law)
Submission of proposed regulations for filing and public comment in accordance with requirements of State Administrative Procedure Act (SAPA)
Staff conducts public hearings (minimum of three statewide) 60 days after OSC’s review period
Preparation of environmental review in accordance with State Environmental Quality Review Act (SEQRA) and assessment of public comment (assesses potential for diversion among other things)
Final Board approval of toll adjustment, adoption of SEQRA findings and filing of Notice of Adoption in State Register.

42
Customer Service Initiatives
43
Providing High Levels of Customer Service
Snow and Ice Removal
Interactive Mapping
Free WiFi Connectivity at Travel Plazas
E-ZPass Improvements System wide
Newly Renovated Travel Plazas new & improved concepts

44

45
The Future

46
The Future
Highway-Speed E-ZPass

47
Toll Study
• Stantec, an outside engineering firm that specializes in traffic and transportation planning, is conducting a study to examine the costs, benefits and impacts of alternatives to the way Thruway tolls are collected.
• The framework for the study is expected to be completed near the end of
2007

48
Commitment to Service
The Authority is committed to:
Maintaining & operating the highway
Implementing capital improvement program to deliver high levels of safety & service
Improving the travelers’ experience
49
2007 Revised Budget and 2008 Proposed Budget
50
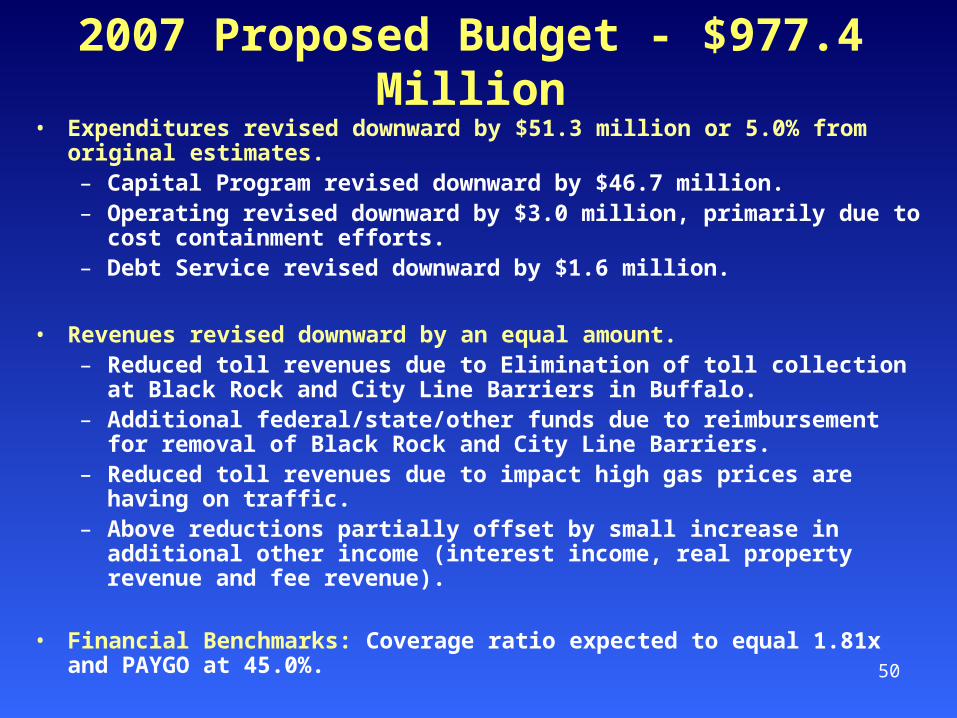
2007 Proposed Budget - $977.4 Million• Expenditures revised downward by $51.3 million or 5.0% from original
estimates.– Capital Program revised downward by $46.7 million.– Operating revised downward by $3.0 million, primarily due to cost
containment efforts.– Debt Service revised downward by $1.6 million.
• Revenues revised downward by an equal amount.– Reduced toll revenues due to Elimination of toll collection at Black
Rock and City Line Barriers in Buffalo.– Additional federal/state/other funds due to reimbursement for removal
of Black Rock and City Line Barriers. – Reduced toll revenues due to impact high gas prices are having on
traffic.– Above reductions partially offset by small increase in additional other
income (interest income, real property revenue and fee revenue).
• Financial Benchmarks: Coverage ratio expected to equal 1.81x and PAYGO at 45.0%.
51
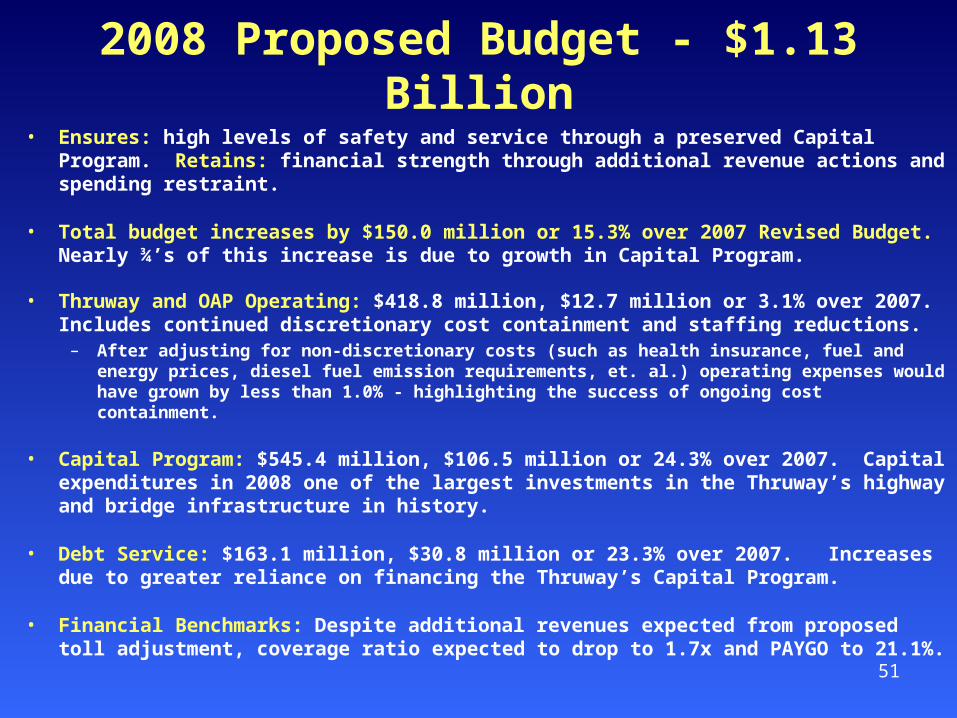
2008 Proposed Budget - $1.13 Billion• Ensures: high levels of safety and service through a preserved Capital Program.
Retains: financial strength through additional revenue actions and spending restraint.
• Total budget increases by $150.0 million or 15.3% over 2007 Revised Budget. Nearly ¾’s of this increase is due to growth in Capital Program.
• Thruway and OAP Operating: $418.8 million, $12.7 million or 3.1% over 2007. Includes continued discretionary cost containment and staffing reductions.
– After adjusting for non-discretionary costs (such as health insurance, fuel and energy prices, diesel fuel emission requirements, et. al.) operating expenses would have grown by less than 1.0% - highlighting the success of ongoing cost containment.
• Capital Program: $545.4 million, $106.5 million or 24.3% over 2007. Capital expenditures in 2008 one of the largest investments in the Thruway’s highway and bridge infrastructure in history.
• Debt Service: $163.1 million, $30.8 million or 23.3% over 2007. Increases due to greater reliance on financing the Thruway’s Capital Program.
• Financial Benchmarks: Despite additional revenues expected from proposed toll adjustment, coverage ratio expected to drop to 1.7x and PAYGO to 21.1%.

52
2008 Proposed Budget – Sources(millions of dollars)
Total Budget = $1.13 billion
Other Funds, $41.9, 3.7%
Thruway Revenues, $632.7, 56.1%
Note/Bond Proceeds, $422.4, 37.5%
Federal Funds, $30.4, 2.7%

53
2008 Proposed Budget – Uses(millions of dollars)
Total Budget = $1.13 billion
Thruway Operating, $418.8, 37.2%
Debt Service, $163.1, 14.5%
Capital Program, $545.4, 48.4%
54
2008 Contracts Program

55
Federal Aid, $23.9 , 4.4%
State and Local Funds, $13.6 , 2.5%
State Bond Act Proceeds, $6.0 , 1.1%
Thruway Revenues, $79.5 , 14.6%
Bond Proceeds, $422.4 , 77.4%
2008 Proposed Capital Spending – Uses (millions of dollars)
Total Budget = $545.4 million
56
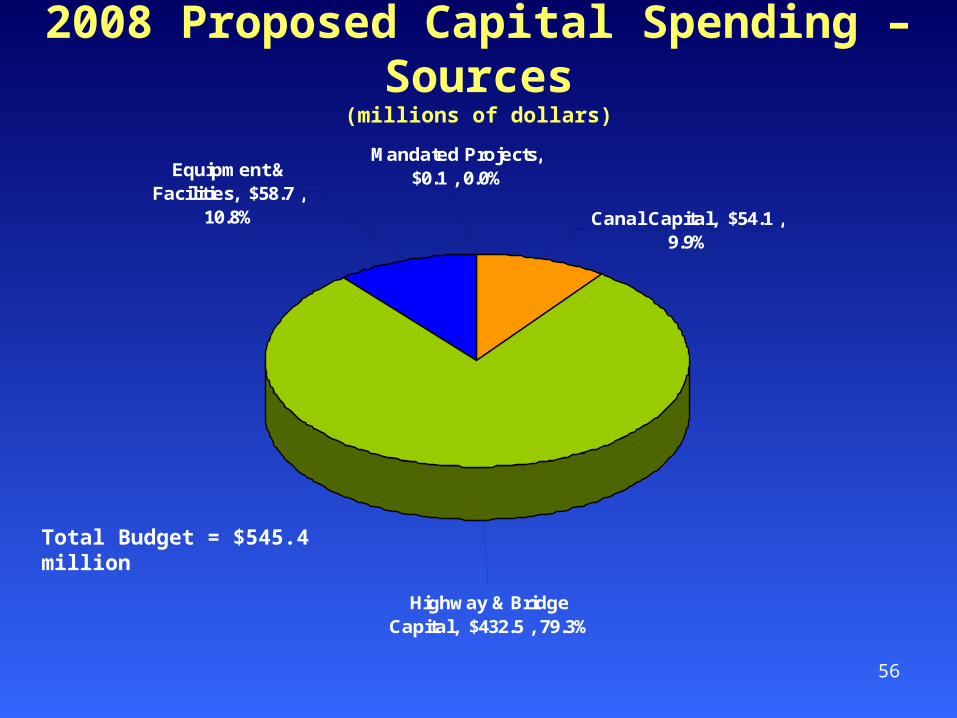
2008 Proposed Capital Spending – Sources(millions of dollars)
Highway & Bridge Capital, $432.5 , 79.3%
Equipment & Facilities, $58.7 ,
10.8%
Mandated Projects, $0.1 , 0.0%
Canal Capital, $54.1 , 9.9%
Total Budget = $545.4 million