1 2 dynamics of extraclassical surround modulation in ... · 46 for the full 2 second stimulus time...
TRANSCRIPT

1
1
Dynamics of extraclassical surround modulation in three types of V1 2
neurons 3
4
5
6
Yong-Jun Liu, Maziar Hashemi-Nezhad, and David C. Lyon* 7
Department of Anatomy & Neurobiology, School of Medicine, University of 8
California, Irvine, CA 92697 9
10
11
*Corresponding author: 12
David C. Lyon 13
Department of Anatomy & Neurobiology 14
School of Medicine 15
University of California 16
Irvine, CA 92697-1275 17
Email: [email protected] 18
Phone: 949-824-0447 19
Fax: 949-824-8549 20
21
22
Pages: 31 23
24
Figures: 8 25
26
27
28
29
30
31
32
33
34
35
36
37
38
39
Articles in PresS. J Neurophysiol (January 12, 2011). doi:10.1152/jn.00692.2010
Copyright © 2011 by the American Physiological Society.

2
40
ABSTRACT 41
Visual stimuli outside of the classical receptive field (CRF) can influence the 42
response of neurons in primary visual cortex (V1). While recording single 43
units in cat, we presented drifting sinusoidal gratings in circular apertures of 44
different sizes to investigate this extraclassical surround modulation over time. 45
For the full 2 second stimulus time course, three types of neurons were found: 46
1) 68% of the cells were ‘suppressive’; 2) 25% were ‘plateau’ cells that 47
showed response saturation with no suppression; 3) the remaining 6% of cells 48
were ‘facilitative’. Analysis of the response dynamics revealed that at 49
response onset, activity of half of facilitative cells, 70% of plateau cells, and all 50
suppressive cells is suppressed by the surround. However, over the next 20-51
30ms, surround modulation changes to stronger suppression for ‘suppressive’ 52
cells, substantial facilitation for ‘facilitative’ cells, and weak facilitation for 53
‘plateau’ cells. For all three cell types these modulatory effects then stabilize 54
between 100-200ms from stimulus onset. Thus, our findings illustrate two 55
stages of surround modulation. Early modulation is mainly suppressive 56
regardless of cell type and, because of rapid onset, may rely on feedforward 57
mechanisms. Surround modulation that evolves later in time is not always 58
suppressive, depending on cell type, and may be generated through different 59
combinations of cortical circuits. Additional analysis of modulation throughout 60
the cortical column suggests the possibility that the larger excitatory fields of 61
‘facilitative’ cells, primarily found in infragranular layers, may contribute to the 62
second stage of suppression through intra-columnar circuitry. 63
64
Key Words: area 17; center-surround; facilitation; feedback; feedforward; 65
horizontal connections; infragranular; spatial summation; suppression 66
67
3
Neurons in primary visual cortex (V1) are typically comprised of a classical 68
receptive field (CRF) center and an extraclassical surround (Albright and 69
Stoner 2002; Allman et al. 1985; Fitzpatrick 2000). Whereas cell responses 70
are driven by center stimulation, the surround plays a more modulatory role 71
that is thought to be important in figure ground segregation and in forming the 72
building blocks of form perception (Seriès et al. 2003; Slllito et al. 1995; Zipser 73
et al. 1996). Previous studies suggest that the center responses of most V1 74
cells are suppressed by inclusion of surround stimuli (Jones et al. 2001; 75
Sengpiel et al. 1997; Walker et al. 2000), with maximal suppressive 76
modulation when the center and the surround have the same orientation and 77
spatial frequency (Akasaki et al. 2002; DeAngelis et al. 1994; Knierim and Van 78
Essen 1992; Levitt and Lund 1997; Walker et al. 1999). 79
However, even under these optimal stimulus conditions not all V1 cells 80
are suppressed by surround stimuli. Instead, in about a quarter of the cells, 81
responses will saturate and exhibit a plateau-like tuning profile (DeAngelis et 82
al. 1994; Sengpiel et al. 1997; Walker et al. 2000). In addition, there is a third, 83
more rarely encountered type of V1 cell which shows neither suppression nor 84
saturation of response to increasing stimulus size, but rather increases in 85
firing rate (Cavanaugh et al. 2002a; Gilbert 1977; Li and Li 1994). Thus, three 86
types of V1 cells can be characterized -suppressive, plateau and facilitative- 87
based on their responses to increasing stimulus size beyond their classical 88
receptive field. 89
Results from previous studies examining the dynamics of surround 90
suppression have helped unravel the underlying mechanisms of surround 91
modulation for suppressive cells. For example, it has been shown that there 92
is an early suppressive component (Alitto and Usrey 2008; Xing et al. 2005) 93
which likely arises through relatively fast feedforward LGN afferents that 94
already exhibit extraclassical surround suppression (Alitto and Usrey 2008; 95
Ozeki et al. 2004; Sceniak et al. 2006; Solomon et al. 2002; Webb et al. 96
2005a). In addition, there is a second component that develops later in time 97
4
(Chen et al. 2005; Xing et al. 2005) and it is likely to be mediated instead 98
through cortical mechanisms which propagate more slowly (Bringuier et al. 99
1999; Girard et al. 2001; Grinvald et al. 1994; Schwabe et al. 2006). 100
Previous studies on surround dynamics, however, have not included 101
analyses of non-suppressive modulation. Therefore, here we investigated 102
response dynamics of all three types of surround modulation found in V1 103
(suppressive, plateau, and facilitative) using drifting sinusoidal gratings of 104
various radii. Our results reveal that there are two stages of surround 105
modulation: 1) Early surround modulation that is mainly suppressive 106
regardless of cell type and may rely on feedforward mechanisms because of 107
rapid onset; 2) a secondary surround modulation that evolves later in time that 108
can be suppressive or facilitative depending on the cell type and may be 109
generated through more slowly propagating cortical circuits. 110
111
METHODS 112
Animal preparation and recording 113
The experiments were performed in thirteen adult cats weighing 2.4-5.0 kg 114
and of both sexes. All procedures were approved by the institutional Animal 115
Care and Use Committee of the University of California, Irvine. Animals were 116
initially anesthetized with a mixture of ketamine (21 mg/kg, IM) and xylazine (3 117
mg/kg, IM). Anesthesia was maintained with isofluorane (0.2–0.6%) in a 67:33 118
mixture of nitrous oxide and oxygen through artificial respiration. EKG, EEG 119
and expired CO2 were monitored throughout the entire experiment to ensure 120
proper level of anesthesia. To prevent eye movements neuromuscular 121
blockade was induced with an initial bolus of vecuronium bromide (0.6 mg/ml, 122
IV) and maintained for the duration of the experiment with 0.15 mg/ml at a 123
flow rate of 2.0 ml/kg/hr mixed with dexamethasone (0.5 mg/kg/hr, IV) in a 124
solution of 5% dextrose and lactated Ringers’. Pupils were dilated with 1% 125
atropine sulfate solution and the nictitating membranes were retracted with 126
2.5% phenylephrine hydrochloride. Zero-power, air-permeable contact lenses 127

5
were fitted to each cornea and 3 mm artificial pupils were placed in front of the 128
eyes. 129
A craniotomy was made above the dorsal surface of area 17 (V1). 130
Extracellular recording of single cells were made with epoxy insulated 131
tungsten microelectrodes (5-7 MΩ, FHC, Bowdoin, ME). Electrode 132
penetrations were made perpendicular to the cortical surface and cells were 133
recorded at all cortical depths. Visually evoked action potentials of single 134
neurons were amplified and isolated by an Xcell-3 four-channel amplifier 135
(FHC), and then fed into a computer running EXPO software (courtesy of 136
Peter Lennie). Spikes were saved at 1 ms resolution for further analysis using 137
custom Matlab software. 138
139
Visual stimuli 140
The visual stimuli were generated by a G5 Mac with an ATI Radeon 9200 141
graphics card running EXPO software. Stimuli were displayed on a gamma 142
calibrated View Sonic Graphics Series G225f CRT monitor with a mean 143
luminance of 50 cd/m2 and at a viewing distance of 37 cm. The refresh rate 144
was set at 100 Hz on the non-interlaced monitor. The location of the optic disc 145
and the area centralis for each eye were plotted daily using a fiber-optic light 146
source (Pettigrew et al. 1979). 147
Through visual stimulation of the dominant eye the receptive field 148
center of each isolated cell was approximated under mouse control with a ~4° 149
diameter aperture of drifting square wave gratings at the approximate 150
preferred orientation. Maximal response was estimated audibly. Then the 151
exact position of the receptive field center was determined by reducing 152
aperture size to as small as 1°. Spatial eccentricities of all receptive fields in 153
our experiment were constrained within 2° above and 16° below the area 154
centralis. 155
Once the receptive field center was established, the CRF properties 156
were tested in detail in the following sequence: First, we re-assessed the 157

6
preferred orientation of each neuron by varying the tilt of the drifting sinusoidal 158
gratings in 22.5° increments. Gratings were shown at 100% contrast with 159
spatial and temporal frequencies of 0.2 c/° and 4 Hz, respectively. Next, 160
optimal spatial frequency was determined by presenting ~10° gratings at the 161
preferred orientation while varying spatial period. It is worth noting that while 162
this aperture size did not always match the optimal receptive field size of the 163
cell (see below), it should nevertheless not affect spatial frequency tuning 164
since this aperture size was more than twice the diameter of the spatial 165
frequency periods used (Mazer et al. 2002). Preferred temporal frequency 166
was then assessed using gratings with the preferred orientation and spatial 167
frequency. The starting phase of all drifting gratings was set to 0°. Finally, the 168
optimal contrast for each cell was determined through contrast response 169
profiles (10-100%, in 10% steps). 170
Once the optimal parameters were determined, we then performed 171
spatial summation measurements (aperture tuning test) using circular 172
apertures of drifting sinusoidal gratings of various diameters (0.2-30°; see Fig. 173
1). The gratings were presented at optimal contrast at the preferred 174
orientation, spatial and temporal frequencies, and in pseudorandom order. 175
Each grating drifted for 2 s, followed by a 6 s interstimulus interval during 176
which the animal viewed a blank screen presented at the mean luminance. 177
This was repeated 2-4 times. 178
For cells that showed a monotonic increase in response up to the 179
largest aperture size (30°), a series of annuli with inner diameters ranging 180
from 0.2-20° were presented to determine whether a CRF region was present 181
within the large excitatory response field. 182
183
184
Data analysis 185
Aperture tuning curve fitting 186
Aperture tuning curves were fitted by a difference of Gaussian (DoG) function 187
7
188
(1) 189
190
in which Rs is the response evoked by different aperture sizes. The free 191
parameters, Ke and re, describe the strength and the size of the excitatory 192
space; Ki and ri represent the strength and the size of the inhibitory space, 193
respectively; and R0 is the spontaneous activity of the cell. 194
To evaluate how well our experimental data was explained by the 195
model, the coefficient of determination (R2) was calculated using 196
197
(2) 198
199
where Rn is the responses to the jth stimulus, Fn is the predicted value, and R0 200
is the mean response of the actual data (Freeman et al. 2002). Across the 201
population, the mean R2 for 2s stimuli is 0.86±0.09. 202
203
Definition of modulatory cell types and their CRF 204
In our study, cells with suppressive, plateau and facilitative extraclassical 205
surrounds were defined based on their tuning profiles to a series of gratings 206
drifting within circular apertures of varying diameter. Each aperture was 207
presented for 2 seconds and classification of the three modulatory cell types 208
are based on this full time course. 209
Suppressive cells were defined as those showing a response 210
attenuation, ≥ 5%, to stimuli beyond their classical receptive field (CRF; see 211
examples in Figs. 1A, 1B and 2A). The CRF of suppressive cells was 212
determined by parameter re from Eq.1 (mean re = 9.3±4.6°) which was similar 213
to the aperture size that evoked the maximum response (mean 9.6±3.9°; t-test, 214
p=0.14; Sceniak et al. 1999). 215
Plateau cells were defined as those that either showed less than 5% 216
suppression or a saturation of response to aperture sizes larger than the CRF 217
+=−
− s
s- 0)(s
s
)( RdxeK-dxeKR22
ie rx-i
rxes
== −−−= N1j
20n
N1j
2nn
2 ))R(R)F(R(1R

8
(see examples in Figs. 1C and 2B). As described above for suppressive cells, 218
the CRF size of plateau cells was also determined by the parameter re from 219
Eq.1, consistent with earlier reports describing plateau cells (DeAngelis et al. 220
1994; Walker et al. 2000). 221
Facilitative cells were defined as those which exhibited no saturation, 222
but instead showed a monotonic response increase to increases in size of the 223
stimulus aperture (see examples in Figs. 1D and 2C). For such cells, the size 224
of the CRF (center) was determined by locating the annular minimum 225
response field (5% above background; Cavanaugh et al. 2002a) to a series of 226
annuli with variable inner diameters and a fixed 30° outer diameter (see gray 227
trace in Fig. 2C). Thus, while we found that these cells always responded 228
optimally to the largest aperture presented, 30°, the CRF of these facilitative 229
cells was much smaller, ranging from 4-10° in diameter (see arrow in Fig. 2C). 230
Importantly, if a stimulus was not presented to this small CRF region, the 231
facilitative cell was unresponsive to large stimuli. Overall, the average CRF 232
(7.0±2.5°) was comparable, though somewhat smaller than the excitatory 233
space constant derived from Eq. 1 (mean re = 10.0 ±3.4°). 234
235
Simple/Complex classification 236
The mean firing rate and first harmonic components of the accumulated 237
response were computed for each stimulus. V1 neurons were classified as 238
simple or complex by comparing the ratio of the first harmonic to the mean 239
response to drifting grating stimuli (Skottun et al. 1991). 240
241
Modulation index 242
To quantify the extraclassical surround (ECS) modulation of all three 243
modulatory cell types, a modulation index (MI) was calculated using 244
245
(3) 246
Where RECS is the response for maximum aperture size and RCRF is the 247
)R,(Rmax / )R(RMI CRFECSCRFECS −=
9
response for the CRF. A negative MI indicates suppression, whereas a 248
positive MI indicates facilitation. 249
250
Temporal dynamics of the surround modulation 251
To determine the time course of extraclassical surround modulation, aperture 252
tuning curves were fitted at successive time points using the DoG model in Eq. 253
1 and MI’s calculated for each using Eq. 3. Cumulative time windows were 254
created in steps of 10 ms for the first 200 ms from stimulus onset and in steps 255
of 50 ms for the remainder of the 2 s stimulus time period. For a schematic 256
of the cumulative time windows used for each of the aperture tuning curves, 257
see figure 1. Figures 1A and B are a simple suppressive cell and a complex 258
suppressive cell, respectively; figure 1C is a complex plateau cell and figure 259
1D is a simple facilitative cell. 260
The reason for using cumulative time windows as opposed to 261
sequential windows of equal size was to improve the signal to noise ratio and 262
allow for more reliable aperture fits at each 10ms bin. For some cells the use 263
of drifting sine wave gratings led to little or no response in several 10 ms bins 264
(see Figs. 1A and 1B). This is especially true for some simple cells that 265
preferred lower temporal frequencies, where several consecutive 10ms bins 266
would be unresponsive (see example in Fig. 1D). While the use of cumulative 267
time windows greatly improves fits of the aperture tuning curves, it also 268
sacrifices the precision at which changes in a cells’ response can be 269
pinpointed in time (see Discussion). 270
Response onset latency of simple cells depends on the initial phase of 271
the stimulus (Movshon et al. 1978; Skottun et al. 1991; Spitzer and Hochstein 272
1985). The starting phase of our stimuli was always 0°, which was not optimal 273
for a number of our simple cells. As a result, 63% (25/40) of them initiated 274
firing substantially later, especially for simple cells preferring low temporal 275
frequencies (see example in Fig. 1D). In order to compare results of all simple 276
and complex cells, the onset latency of these delayed simple cells (14/25 277
10
suppressive cells; 6/7 plateau cells; 5/8 facilitative cells) was re-aligned to the 278
average onset latency of our complex cells. For this purpose, onset latency 279
was defined as the earliest time that responses to the optimal aperture size 280
(CRF) reached 25% of maximum; the mean latency of our complex cells was 281
~47 ms. Therefore, for each simple cell the earliest time point that simple cell 282
responses reached 25% of maximum was aligned to 47 ms (see schematic of 283
the cumulative time windows shown in Fig. 1D). 284
285
Orientation tuning properties 286
Responses to drifting gratings varying in orientation (presented at the optimal 287
aperture size, and the preferred spatial and temporal frequencies) were 288
plotted. The orientation tuning curve was fitted using 289
290
(4) 291
292
In which Os is the stimulus orientation, OP is the preferred orientation, ROs is 293
the response to different orientations, RP and Rn correspond to the preferred 294
and non-preferred orientation response, Ro is the spontaneous response, and 295
σ is the tuning width. The narrowness of the orientation tuning curve was 296
measured as the half width at half height (HWHH), which equals 1.18*σ. The 297
orientation selectivity index (OSI), a measure of circular variance, was 298
calculated by using 299
300
(5) 301
302
Where θn is the nth orientation of the stimulus and Rn is the corresponding 303
response. 304
305
Significance Tests 306
Tests for significance were done with one tailed t-tests or one-way ANOVA’s. 307
)/(2σ180)POs(On
)2/()pO(O
poO
2222
ee RRRR +−−−−++=
σss
)( / nn
nnn R)θ exp(iROSI =

11
308
RESULTS 309
We recorded from 158 neurons in V1. For each cell, aperture tuning curves 310
were plotted for responses to aperture gratings with increasing diameters, 311
shown drifting for a duration of 2 s (see examples in Figs. 1 and 2). Each 312
curve was then fitted by a difference of Gaussian (DoG) function (Eq. 1). 313
314
Three types of extraclassical surround modulation 315
Based on fitted aperture tuning curves, cells could be classified into three 316
types: suppressive, plateau and facilitative (Fig. 2). The majority of our cells 317
(108/158, 68%) were suppressive, for which responses decreased 5% or 318
greater to aperture diameters beyond optimal. Figure 2A shows a 319
representative suppressive cell. For this cell, the CRF (parameter re from Eq.1) 320
is 9° (95 spikes/s). The strongest suppression beyond the CRF occurred with 321
the largest aperture diameter presented (30°), reducing spike rate 34% (63 322
spikes/s). 323
Effects of the extraclassical surround were not always suppressive. 324
Cells that exhibited no suppression to increasing aperture diameters beyond 325
their CRF were classified into two groups, the more common plateau cells 326
(40/158, 25%) and the rarely encountered facilitative cells (10/158, 6%). 327
Figure 2B shows an example of a plateau cell. Here, responses saturated 328
around 10° and no suppression was observed when larger apertures were 329
presented. This saturation may be caused by a balance between excitatory 330
and inhibitory inputs (Sengpiel et al. 1997). For these plateau cells their CRF 331
can be represented by the excitatory space constant re in Eq.1, as described 332
in previous work (DeAngelis et al. 1994; Walker et al. 2000). 333
Figure 2C shows an example facilitative cell, responses of which 334
continuously increased with increasing aperture size. Importantly, for 335
facilitative cells, we also tested the cell’s responses to surround annuli and 336
found that increasing the inner diameter led to a marked decrease in firing 337

12
rate (see gray trace in Fig. 2C). This means that stimulation of the receptive 338
field center is necessary for the surround to have a facilitative effect. In this 339
way, facilitative cells, like suppressive cells, can also be considered to have a 340
CRF. The inner diameter at which annulus responses dropped to within 5% of 341
the mean background firing rate (the annulus minimum response field; 342
Cavanaugh et al. 2002a) was used to define the CRF of these facilitative cells. 343
For the example shown in figure 2C, this corresponds to 10° (indicated by 344
arrow) where the cell response is 10 spikes/s. Center response is then 345
facilitated 62% to 27 spikes/s by presenting the full 30° aperture. 346
347
Simple and complex classification of modulatory cell types 348
In addition to categorizing each neuron based on the type of extraclassical 349
surround modulation, we also classified them as simple or complex by plotting 350
the first harmonic (F1) against the mean response (F0) to the drifting grating 351
stimuli. The results are illustrated in figure 3, where cells below the diagonal 352
(F1/F0>1) are classified as simple cells. Using this criteria, only 40 cells of our 353
entire population were simple cells (25%), whereas the majority were complex 354
cells (n=118; 75%). Likewise, most of our suppressive (83/108, 77%) and 355
plateau (33/40, 83%) cells were complex as well (open black and filled light-356
gray circles located above the diagonal in Fig. 3). Conversely, there was a 357
dramatic difference in the classification of our facilitative cells as 8 out of 10 358
were simple cells (black circles falling below the diagonal). 359
360
Dynamics of V1 size tuning 361
To determine the time course of extraclassical surround modulation in V1, 362
responses to different sized apertures were segregated into a series of 363
cumulative time windows (see Fig. 1). For each cell we plotted size tuning 364
curves for each window and fitted them using Eq.1. 365
Figure 4 shows several examples of size tuning curves over time for 366
the different modulatory cell types. For suppressive (Fig. 4A-C) and plateau 367

13
(Fig. 4D-F) cells, three examples each are shown in the first two columns, 368
whereas two facilitative cell examples (Fig. 4G-H) are shown in the last 369
column. In addition, the last panel (Fig. 4I) shows the dynamics of annulus 370
response profiles for a facilitative cell. In figure 4, for each neuron, the blue 371
curves represent earlier time courses, beginning as early as 30 ms from 372
stimulus onset. Progressively warmer colored curves represent cumulative 373
responses at later time windows up to 2 s (red traces). As a reminder, the 374
classification of each cell as suppressive, plateau, or facilitative is based on 375
the overall response curves to the full 2 s stimulus presentation. All but one of 376
these examples (see description of Fig. 4H below) illustrate that extraclassical 377
surround modulation of responses earlier in time was suppressive regardless 378
of cell type, and evolved later into stronger suppression for suppressive cells, 379
no suppression for plateau cells, and into facilitation for facilitative cells. 380
A prime example of the evolution of increasing suppression strength for 381
suppressive cells is illustrated in the traces of the complex cell shown in figure 382
4A. Here the tuning curve at 40 ms (blue trace indicated by arrow) shows a 383
CRF response at 14 spikes/s that is suppressed 64% (MI=-0.64, as 384
determined through Eq. 3) by the largest aperture (30°) to 5 spikes/s. 385
However, at 120 ms (green trace indicated by arrow) CRF response is 58 386
spikes/s and responses are now suppressed nearly 80%, down to 13 spikes/s, 387
by the largest aperture. Similar increases in suppression strength over time 388
are seen for the two other suppressive cells shown in figure 4B and C, with 389
the latter of the two being a simple cell example. 390
The evolution of modulation over time in our plateau cells from 391
suppression to no suppression is best illustrated by the complex cell shown in 392
figure 4D. Here, from 40-70 ms suppression is quite strong. For example, the 393
response at 40 ms (blue trace indicated by arrow) is 14 spikes/s for the CRF 394
aperture and drops to only 2 spikes/s for the largest aperture size, yielding 395
86% suppression (MI=-0.86). However, by 90 ms and beyond, suppression is 396
minimal, such that the responses beyond optimal at 150 ms (green trace 397

14
indicated by arrow) are suppressed now only 6% (MI=-0.06); ~31 spikes/s at 398
CRF, down to 30 spikes/s at 30°. At even later cumulative time windows no 399
suppression is evident. Weakening of suppression strength over time is seen 400
in the other two examples as well; one of these is another complex cell (Fig. 401
4E) and the other a simple cell (Fig. 4F). 402
For facilitative cells, half (5/10) show relatively strong suppression early 403
in time followed later by facilitation. For the example complex cell shown in 404
figure 4G the response peaks for a relatively small sized aperture at 50 ms 405
(blue trace indicated by arrow) and is then suppressed 56% by apertures of 406
30°. By 120 ms (green trace indicated by arrow), peak response occurs for a 407
larger stimulus and suppression is no longer evident. At most of the 408
subsequent time points the cell response increases as the size of the stimulus 409
increases, showing neither suppression nor saturation. In some of the 410
facilitative cells (5/10) on the other hand, suppression was not evident at early 411
time points, but rather weak facilitation was observed such as the blue 50 ms 412
trace shown for the example facilitative cell in figure 4H. Nevertheless, as 413
indicated by the green 90 ms trace in the same panel, facilitation also became 414
stronger later in time for these cells. 415
Figure 4I shows the response profiles over time for annulus testing of 416
an example facilitative cell. In this example, the minimum annulus response 417
field used to define the CRF was very consistent, 8°, across all time points 418
(see arrow in Fig. 4I). This invariance of CRF size over time was found for the 419
population of facilitative cells as well (data not shown). 420
421
Dynamics of the extraclassical surround modulation 422
We next examined detailed dynamics of extraclassical surround modulation 423
for the three cell populations. To do this we computed a modulation index (MI) 424
for each cumulative time window of each cell (see examples in previous 425
section). Actual time windows used for this analysis were in steps of 10 ms 426
for the first 200 ms after stimulus onset and then in steps of 50 ms for the 427
15
remaining time (see x-axis in Fig. 5). 428
The resulting evolution of extraclassical surround modulation (MI) over 429
time for the populations is plotted in figure 5. The black trace represents 430
facilitative cells, the gray trace plateau cells, and the light gray trace 431
suppressive cells. Consistent with the individual examples shown in figure 4, 432
for the three populations, all cell types showed suppression early, even 433
facilitative cells (mean MI<0; at response onset, ~30 ms from stimulus onset 434
in Fig. 5). Following this initial period, modulation evolved into facilitation 435
(MI>0) for facilitative cells 20 ms later (at ~50 ms from stimulus onset). 436
Similarly, the MI of plateau cells crossed from suppression into facilitation 437
~100 ms after stimulus onset. These evolving modulatory effects then 438
stabilized by ~200 ms for facilitative and plateau cells. For suppressive 439
cells, following the first 30 ms from response onset, surround suppression 440
became even stronger as indicated by an increase in –MI beginning at the 441
transition from 60-70 ms from stimulus onset (see light gray trace in Fig. 5). 442
Suppression then hit maximum strength at ~100 ms from stimulus onset 443
which is mostly consistent with the maximum suppression latency shown for 444
monkey V1 neurons (Bair et al. 2003). 445
Thus from our population results we conclude that two types of 446
extraclassical surround modulation are present over time: an early component 447
that is suppressive even for facilitative and plateau cells, and a later 448
component that is either suppressive or facilitative depending on the cell type. 449
The early suppressive modulation may rely on feedforward mechanisms 450
because of its rapid onset, and the surround modulation that evolves later in 451
time may be generated through different combinations of more slowly 452
propagating cortical circuits. 453
454
Receptive field size of different cell types across cortical depth 455
The dynamics of extraclassical surround modulation that we have observed 456
thus far suggest the presence of suppression early in time followed by either 457

16
facilitation or increased suppression depending on the cell type. The early 458
onset of suppression is consistent with a feedforward mechanism from LGN 459
and/or retina (Alitto and Usrey 2008; Nolt et al. 2004; Sceniak et al. 2006), 460
whereas, later modulation may be generated through different combinations 461
of cortical circuits. In addition to the more commonly considered cortical 462
sources for extraclassical surround modulation, feedback and long-range 463
lateral connections (Angelucci et al. 2002; Gilbert 1992), another source is 464
through deeper layer neurons within the same cortical column (Allison and 465
Bonds 1994; Bolz and Gilbert 1986). To address this issue, we plotted the 466
diameter of the aperture size eliciting maximum response for each cell and 467
sorted by cortical depth encountered via the electrode penetration (as shown 468
in Fig. 6A). For facilitative cells the optimal aperture was always the maximum 469
stimulus diameter (30°). For suppressive cells the optimal aperture was the 470
aperture that corresponded to the peak response. For plateau cells it was 471
defined as the point of saturation (size corresponding to 95% of the maximum 472
response). 473
For each cell we plotted the aperture size of maximum response within 474
their respective columns relative to cortical depth (see Fig. 6A). Cells from the 475
same electrode penetration are plotted along the same dashed vertical line. 476
The size of each circle is shown proportionally, with the largest apertures 477
representing 30° of visual angle. As evident in this figure, all but one of the 478
facilitative cells (black circles) were located in cortical depths corresponding to 479
the infragranular layers of V1 (>1200 µm). On the other hand, suppressive 480
(filled light-gray circles) and plateau (gray circles) cells were distributed evenly 481
across all cortical layers. Furthermore, as would be expected, facilitative cells 482
require larger aperture sizes for maximum response than the other two cell 483
types (see Fig. 6B). Average optimal aperture size for suppressive (9.3±3.9°) 484
and plateau (10.1±4.1°) cells are similar and not significantly different (p=0.30); 485
whereas aperture sizes for facilitative cells are significantly larger than 486
suppressive (p<0.001) and plateau (p<0.001) cells. 487

17
It has been proposed that the surround temporal dynamics and visual 488
space covered by the full extraclassical receptive field can only be accounted 489
for through feedback from higher order visual areas where individual neurons 490
have large enough receptive fields with faster propagation speeds than multi-491
synaptic long range lateral connections (Bullier et al. 2001; Cantone et al. 492
2005; Cavanaugh et al. 2002a; Schwabe et al. 2006). However, the 493
suppressive surround could arise from local circuits. The large excitatory 494
receptive fields of the deep layer intrinsic facilitative cells may provide an 495
alternative source for the suppressive surround of V1 cells since the size of 496
these receptive fields are comparable with receptive field sizes of neurons 497
found in higher visual areas (see Discussion). 498
499
Spatial frequency and orientation tuning of suppressive, plateau and 500
facilitative cells 501
Spatial frequency and orientation tuning are related to extraclassical surround 502
modulation in that the maximal suppression occurs when the center and 503
surround are presented with the same orientation and spatial frequency 504
(Akasaki et al. 2002; DeAngelis et al. 1994; Knierim and Van Essen 1992; 505
Levitt and Lund 1997; Walker et al. 1999). Here we analyzed spatial 506
frequency and orientation properties for all three cell types. Figure 7 shows 507
examples for cells located in the same electrode track (track 3 in figure 6A), 508
including 4 suppressive cells, 2 facilitative cells, and 2 plateau cells. As can 509
be seen in figure 7A, the preferred spatial frequency is comparable regardless 510
of modulatory cell type. Likewise, the preferred orientation varies by no more 511
than 22.5° from cell to cell (see figure 7B). Furthermore, while orientation 512
tuning width does vary, broad and narrow band widths are observed for all 513
three cell types. 514
Across the population, the spatial frequency distribution shown in figure 515
8A is similar for all three types of modulatory cells (ANOVA, p=0.28). As 516
illustrated in figure 8B, the orientation tuning width (half width at half height; 517

18
HWHH) is linearly related to the orientation selectivity index (OSI) of the cells 518
(R=0.54, p<0.001). Among the three types of modulatory cells the HWHH is 519
not significantly different (ANOVA, p=0.14). On the other hand, the OSI of 520
facilitative cells is significantly higher than suppressive and plateau cells 521
(ANOVA, p=0.02).This is perhaps due to most of the facilitative cells being 522
simple cells, and the simple cells had higher average OSI’s than our complex 523
cells (Fig. 8D; Heggelund and Albus, 1978; Leventhal and Hirsch, 1978; 524
Ringach et al. 2002; Schummers et al. 2007). Likewise, the HWHH was 525
smaller for simple cells generally and the results are statistically significant for 526
suppressive and plateau cells (p=0.002 and p=0.003, respectively; Fig. 8C). 527
528
DISCUSSION 529
We find that three different kinds of extraclassical surround modulation exist 530
depending on the type of V1 cell: suppressive, plateau or facilitative. In 531
addition, our response dynamic analyses show that these types of surround 532
modulations are not stationary over time. Shortly after stimulus onset 533
surround modulation is suppressive for all three types of cells. However, this 534
modulation evolves into facilitation for facilitative and plateau cells. On the 535
other hand, suppression does not turn into facilitation at later time points for 536
suppressive cells, but rather increases in suppressive strength. Here we 537
discuss our results in light of previous work, and consider how they relate to 538
possible underlying mechanisms involved in the evolution of different types of 539
surround modulation over time. 540
541
Three types of extraclassical surround modulation 542
Stimuli extending beyond the classical receptive field (CRF) of a V1 neuron 543
will often lead to suppression of the cell’s excitatory center (Allman et al. 544
1985). It has been well documented that the strength of suppression induced 545
by extraclassical stimuli depends on the relationship between the stimulus 546
represented in the center and in the surround. For example, stronger 547

19
suppression can be obtained when stimulus properties like orientation, 548
direction and spatial frequency of the center and the surround match, even 549
when these parameters are not optimal (Akasaki et al. 2002; Cavanaugh et al. 550
2002b; DeAngelis et al. 1994; Knierim and Van Essen 1992; Levitt and Lund 551
1997; Walker et al. 1999). The stimuli we employed (full contrast gratings that 552
varied in diameter, but always drifted in the preferred orientation, temporal and 553
spatial frequencies) were most likely to lead to maximum suppression. 554
Accordingly, we found that 68% of our V1 cells were suppressed by an 555
extraclassical surround, which is consistent with previous work in both cat and 556
monkey (Jones et al. 2001; Sengpiel et al. 1997; Walker et al. 2000). 557
While the majority of our cells were suppressive, 32% (50/158) did not 558
show suppression as they either reached a plateau in their excitatory 559
response (plateau cells; n=40), or they continued to increase their firing rate 560
with increasing stimulus size (facilitative cells; n=10). Plateau and facilitative 561
cells have been reported several times before (Cavanaugh et al. 2002a; 562
DeAngelis et al. 1994; Kapadia et al. 1999; Knierim and Van Essen 1992; Li 563
and Li 1994; Polat et al. 1998; Sengpiel et al. 1997; Walker et al. 2000). As 564
such, it has been postulated that responses of plateau cells may be generated 565
by a balance between excitatory and inhibitory inputs (Sengpiel et al. 1997). 566
Responses of our facilitative cells increased with aperture size and 567
showed no saturation. In our entire experiment, facilitative cells were rarely 568
encountered (10/158, 6%), consistent with the idea that accurate estimation of 569
the receptive field center primarily yields a high incidence of non-facilitative 570
cells (Cavanaugh et al. 2002a; Fitzpatrick 2000; Walker et al. 2000). 571
Interestingly, most of our facilitative cells were located in infragranular layers 572
of V1 (>1200 µm) and a larger proportion were simple cells (8 out of 10). This 573
is consistent with earlier work showing that a majority of neurons in layer 6 of 574
V1 are simple and some have very large excitatory receptive fields (Bolz and 575
Gilbert 1989; Gilbert 1977; Leventhal and Hirsch 1978). The novel 576
observation in our work here is that we also find deep layer facilitative cells to 577

20
have a relatively small CRF ranging from 4-10°, and a facilitative 578
extraclassical surround of at least 30°. Similar results using narrow bars with 579
drifting gratings have been reported by Li and Li (1994) for cat V1, although 580
they were not attributed specifically to deep layer simple cells. More recently, 581
Haider et al. (2010) have found that fast-spiking interneurons and regular/thin-582
spiking pyramidal neurons in cat V1 increased responses to larger natural 583
stimuli which exceeded the CRF. This subpopulation of GABAergic and 584
pyramidal cells is consistent with the small population of facilitative cells found 585
in our experiment, and indicates that our facilitative cells could be either 586
inhibitory or excitatory. Furthermore, we reported here that 50% of the 587
facilitative cells in our sample showed suppression early in time followed later 588
by facilitation, whereas the other half of cells showed no evidence of 589
suppression early in time. It could be possible that the inhibitory and 590
excitatory cells with large receptive fields described by Haider and colleagues 591
(2010) correspond to the two different suppression dynamics we observed. 592
593
Mechanisms underlying extraclassical surround modulation 594
Across the great majority of the neurons we recorded, extraclassical surround 595
modulation was suppressive at early time points (at response onset), but later 596
diverged into either facilitation or even stronger suppression (Fig. 5). 597
Feedforward mechanism from the LGN may account for this early universal 598
suppression as LGN neurons already exhibit a suppressive extraclassical 599
surround (Alitto and Usrey 2008; Solomon et al. 2002; Webb et al. 2005b). 600
Furthermore, a feedforward model without lateral inhibition, used to explain 601
suppression for simple cells, could also contribute to the early suppression 602
(Finn et al. 2007). A third possibility is fast suppression arising from nearby 603
cells within V1, especially for cells where suppression comes even before the 604
excitatory input to the CRF reaches spike threshold, as shown in monkeys 605
(Bair et al. 2003). In monkey, faster feedforward propagation of the 606
magnocellular compared to the parvocellular pathway (Alitto and Usrey 2008; 607

21
Lyon et al. 2010; Schiller and Malpeli 1978; Vidyasagar et al. 2002) may 608
account for such an effect. Likewise, in cat, parallel pathways of feedforward 609
geniculo-cortical inputs from the slower X and faster Y channels (Cleland et al. 610
1971; Lennie 1980; Sur et al. 1987) can provide the biological basis for such a 611
scenario. 612
While on average early modulation of all the V1 cell types was 613
suppressive, later in time, surround modulations evolved into two types. That 614
is, modulation became positive for facilitative and plateau cells, and for 615
suppressive cells modulation became even more strongly suppressive. These 616
later modulations may be generated through different combinations of cortical 617
circuits. One candidate is long-range lateral connections in V1 which tend to 618
link cells with similar functional properties, such as orientation preference 619
(Buzás et al. 2006; Callaway and Katz 1990; Gilbert and Wiesel 1989; 620
Kisvarday et al. 1997), direction preference (Roerig and Kao 1999) and ocular 621
dominance (Yoshioka et al. 1996). Long-range lateral connections have been 622
demonstrated to account for extraclassical surround modulation, including 623
facilitation and suppression (Mizobe et al. 2001; Polat et al. 1998; Sceniak et 624
al. 2001). Importantly, the speed of horizontal connections covering the 625
extraclassical surround is slow (~0.1-0.2mm/ms; Bringuier et al. 1999; Girard 626
et al. 2001; Grinvald et al. 1994), which may contribute to the later modulation 627
of our results. For instance, as measured through cumulative time windows 628
the change to stronger suppression for suppressive cells and the transition 629
from suppression to facilitation for facilitative and plateau cells occurs 630
approximately 20-30 ms after response onset (Fig. 5) which would correspond 631
to long-range connections arising from cells located ~2-3 mm laterally. In 632
addition, suppression strength which peaks ~70 ms after response onset for 633
suppressive cells, or facilitation which rises for another ~100 ms are indicative 634
of even longer range lateral connections or possibly multi-synaptic lateral 635
circuits. An intriguing possibility for facilitative cells may be the involvement of 636
Meynert cells, which like most of our facilitative cells are found in infragranular 637

22
layers of cat and monkey V1 (i.e., Gabbott et al. 1987; Rockland and Knutson, 638
2001). Meynert cells are large pyramidal neurons which have been shown to 639
have extremely long-range projecting axons, up to 8mm (Rockland and 640
Knutson, 2001), and could thus provide excitatory monosynaptic inputs to 641
facilitative cells that arrive as late as 80 ms after response onset. 642
As explained in the Methods, the reason for using cumulative time 643
windows was to improve the signal to noise ratio and allow for more reliable 644
fits at each 10 ms bin. However, it is important to note that the cumulative 645
time point at which suppression strength increases for suppressive cells or 646
when suppression switches to facilitation for the population of our facilitative 647
cells (20-30 ms as shown in Fig. 5) is not the exact point at which this signal 648
begins to affect the cell's response; rather, it is when this influence has 649
outweighed the influence of an early suppressed response. Therefore, the 650
true latencies for these components are likely to be modestly shorter, by some 651
amount that is difficult to estimate. 652
Another likely contributor to extraclassical surround modulation is 653
feedback from extrastriate visual cortex, which can cover large regions of 654
visual field corresponding to the extraclassical surround of V1 neurons 655
(Angelucci et al. 2002; Bair et al. 2003; Bullier et al. 2001; Cantone et al. 2005; 656
Cavanaugh et al. 2002a; Chen et al. 2005; Levitt and Lund 2002; Xing et al. 657
2005)and usually targets excitatory neurons (Johnson and Burkhalter 1996; 658
Salin and Bullier 1995; Shao and Burkhalter 1996). In this way, feedback 659
connections arising from a large region of the visual field may contribute to the 660
larger facilitative surround modulation that occurs later in time for facilitative 661
and plateau cells. Feedback may also contribute to the later increase in 662
strength of suppression for suppressive cells via intrinsic V1 relays onto local 663
inhibitory cells (Schwabe et al. 2006). Because feedback axons are 664
myelinated, these inputs are likely to arrive similarly in time, if not sooner, to 665
the typical ~2mm long-range lateral connections described above (Angelucci 666
et al. 2002; Bair et al. 2003; Schwabe et al. 2006). Therefore, the effects of 667

23
feedback projections should occur within the first 20 ms beyond response 668
onset (Xing et al. 2005). In our experiments this time frame corresponds to 669
the change from suppression to facilitation for our facilitative cell population 670
and the point where suppression strength begins to increase for our 671
suppressive cells (Fig. 5). 672
In addition to long-range lateral and feedback connections, another 673
possibility for later extraclassical surround modulation is through connections 674
within columns. Most of our facilitative cells were located in deeper layers of 675
V1 and were simple cells, consistent with previous results showing that such 676
cells are found in layer 6 (Gilbert 1977). End-inhibition of layer 4 cells will 677
disappear after inactivating layer 6 with GABA, indicating layer 6 cells account 678
for, at least partly, surround suppression of cells in layer 4 (Bolz and Gilbert 679
1986; Bolz et al. 1989). Moreover, the inhibitory effects mediated by 680
infragranular layers could be propagated throughout the column (see Allison 681
and Bonds 1994). In this regard, our dynamic surround modulation results 682
(Fig. 5) show that the evolution of stronger suppression and stronger 683
facilitation occur over a similar time course. Probably the most noteworthy 684
feature of these rarely encountered facilitative cells is that they have very 685
large excitatory receptive fields, far bigger than the excitatory fields of other 686
cells in V1, even within the same column (Fig. 6). But, most critically, these 687
large facilitative receptive fields match the diameter of the extraclassical 688
suppressive surrounds for the more commonly encountered suppressive cells. 689
As such, they are capable of contributing to the more distal surround effects. 690
Because facilitation develops later in time and coincides with the onset and 691
continued development of the stronger suppression observed for suppressive 692
cells, we suggest that facilitative cells may play a key role, perhaps directly as 693
GABAergic interneurons or through excitatory synapses onto inhibitory 694
neurons within the same cortical column. 695
Overall, our results presented here suggest that mechanisms 696
underlying surround modulation combine a number of different sources, 697

24
including feedforward, intra-columnar, long-range horizontal, and feedback 698
connections, and that these sources differ depending not only on the 699
cumulative time relative to stimulus onset but also on the type of V1 cell. 700
701
ACKNOWLEDGEMENTS 702
We thank Emily Grossman for helpful comments on this manuscript. This 703
work was partially supported by the Whitehall Foundation. 704
705
REFERENCES 706
Akasaki T, Sato H, Yoshimura Y, Ozeki H, and Shimegi S. Suppressive effects of 707
receptive field surround on neuronal activity in the cat primary visual cortex. 708
Neurosci Res 43: 207-220, 2002. 709
Albright TD, and Stoner GR. Contextual influences on visual processing. Annu Rev 710
Neurosci 25: 339-379, 2002. 711
Alitto HJ, and Usrey WM. Origin and dynamics of extraclassical suppression in the 712
lateral geniculate nucleus of the macaque monkey. Neuron 57: 135-146, 2008. 713
Allison JD, and Bonds AB. Inactivation of the infragranular striate cortex broadens 714
orientation tuning of supragranular visual neurons in the cat. Exp Brain Res 101: 715
415-426, 1994. 716
Allman J, Miezin F, and McGuinness E. Stimulus specific responses from beyond 717
the classical receptive field: neurophysiological mechanisms for local-global 718
comparisons in visual neurons. Annu Rev Neurosci 8: 407-430, 1985. 719
Angelucci A, Levitt JB, Walton EJS, Hupe J-M, Bullier J, and Lund JS. Circuits 720
for local and global signal integration in primary visual cortex. J Neurosci 22: 721
8633-8646, 2002. 722
Bair W, Cavanaugh JR, and Movshon JA. Time course and time-distance 723
relationships for surround suppression in macaque V1 neurons. J Neurosci 23: 724
7690-7701, 2003. 725
Bolz J, and Gilbert CD. Generation of end-inhibition in the visual cortex via 726
interlaminar connections. Nature 320: 362-365, 1986. 727
Bolz J, and Gilbert CD. The role of horizontal connections in generating long 728
receptive fields in the cat visual cortex. Eur J Neurosci 1: 263-268, 1989. 729
Bolz J, Gilbert CD, and Wiesel TN. Pharmacological analysis of cortical circuitry. 730
Trends in Neurosci 12: 292-296, 1989. 731
Bringuier V, Chavane F, Glaeser L, and Frégnac Y. Horizontal propagation of 732
visual activity in the synaptic integration field of area 17 neurons. Science 283: 733
695-699, 1999. 734
Bullier J, Hupé J-M, James AC, Girard P, Casanova C, and Ptito M. The role of 735
feedback connections in shaping the responses of visual cortical neurons. In: Prog 736
in Brain ResElsevier, 2001, p. 193-204. 737

25
Buzás P, Kovács K, Ferecskó AS, Budd JML, Eysel UT, and Kisvárday ZF. 738
Model-based analysis of excitatory lateral connections in the visual cortex. J 739
Comp Neurol 499: 861-881, 2006. 740
Callaway E, and Katz L. Emergence and refinement of clustered horizontal 741
connections in cat striate cortex. J Neurosci 10: 1134-1153, 1990. 742
Cantone G, Xiao J, McFarlane N, and Levitt JB. Feedback connections to ferret 743
striate cortex: Direct evidence for visuotopic convergence of feedback inputs. J 744
Comp Neurol 487: 312-331, 2005. 745
Cavanaugh JR, Bair W, and Movshon JA. Nature and interaction of signals from 746
the receptive field center and surround in macaque V1 neurons. J Neurophysiol 747
88: 2530-2546, 2002a. 748
Cavanaugh JR, Bair W, and Movshon JA. Selectivity and spatial distribution of 749
signals from the receptive field surround in macaque V1 neurons. J Neurophysiol 750
88: 2547-2556, 2002b. 751
Chen G, Dan Y, and Li C-Y. Stimulation of non-classical receptive field enhances 752
orientation selectivity in the cat. J Physiol 564: 233-243, 2005. 753
Cleland BG, Dubin MW, and Levick WR. Sustained and transient neurones in the 754
cat's retina and lateral geniculate nucleus. J Physiol 217: 473-496, 1971. 755
DeAngelis GC, Freeman RD, and Ohzawa I. Length and width tuning of neurons in 756
the cat's primary visual cortex. J Neurophysiol 71: 347-374, 1994. 757
Finn I.M., Priebe N.J., and Ferster D. The emergence of contrast-invariant 758
orientation tuning in simple cells of cat visual cortex. Neuron 54: 137-152, 2007 759
Fitzpatrick D. Seeing beyond the receptive field in primary visual cortex. Curr Opin 760
Neurobiol 10: 438-443, 2000. 761
Freeman TCB, Durand S, Kiper DC, and Carandini M. Suppression without 762
Inhibition in visual cortex. Neuron 35: 759-771, 2002. 763
Gabbott PLA, Martin KAC, and Whitteridge D. Connections between pyramidal 764
neurons in layer 5 of cat visual cortex (area 17). J Comp Neurol 259: 364-381, 765
1987. 766
Gilbert C, and Wiesel T. Columnar specificity of intrinsic horizontal and 767
corticocortical connections in cat visual cortex. J Neurosci 9: 2432-2442, 1989. 768
Gilbert CD. Horizontal integration and cortical dynamics. Neuron 9: 1-13, 1992. 769
Gilbert CD. Laminar differences in receptive field properties of cells in cat primary 770
visual cortex. J Physiol 268: 391-421, 1977. 771
Girard P, Hupe JM, and Bullier J. Feedforward and feedback connections between 772
areas V1 and V2 of the monkey have similar rapid conduction velocities. J 773
Neurophysiol 85: 1328-1331, 2001. 774
Grinvald A, Lieke E, Frostig R, and Hildesheim R. Cortical point-spread function 775
and long-range lateral interactions revealed by real-time optical imaging of 776
macaque monkey primary visual cortex. J Neurosci 14: 2545-2568, 1994. 777
Haider B, Krause MR, Duque A, Yu Y, Touryan J, Mazer JA, and McCormick DA. 778
Synaptic and Network Mechanisms of Sparse and Reliable Visual Cortical Activity 779
during Nonclassical Receptive Field Stimulation. Neuron 65: 107-121, 2010. 780
Heggelund P, and Albus K. Orientation selectivity of single cells in striate cortex of 781

26
cat: The shape of orientation tuning curves. Vision Research 18: 1067-1071, 1978. 782
Johnson RR, and Burkhalter A. Microcircuitry of forward and feedback connections 783
within rat visual cortex. J Comp Neurol 368: 383-398, 1996. 784
Jones HE, Grieve KL, Wang W, and Sillito AM. Surround suppression in primate 785
V1. J Neurophysiol 86: 2011-2028, 2001. 786
Kapadia MK, Westheimer G, and Gilbert CD. Dynamics of spatial summation in 787
primary visual cortex of alert monkeys. Proc Natl Acad Sci USA 96: 12073-12078, 788
1999. 789
Kisvarday Z, Toth E, Rausch M, and Eysel U. Orientation-specific relationship 790
between populations of excitatory and inhibitory lateral connections in the visual 791
cortex of the cat. Cereb Cortex 7: 605-618, 1997. 792
Knierim JJ, and Van Essen DC. Neuronal responses to static texture patterns in 793
area V1 of the alert macaque monkey. J Neurophysiol 67: 961-980, 1992. 794
Lennie P. Parallel visual pathways: A review. Vis Res 20: 561-594, 1980. 795
Leventhal AG, and Hirsch HV. Receptive-field properties of neurons in different 796
laminae of visual cortex of the cat. J Neurophysiol 41: 948-962, 1978. 797
Levitt JB, and Lund JS. Contrast dependence of contextual effects in primate visual 798
cortex. Nature 387: 73-76, 1997. 799
Levitt JB, and Lund JS. The spatial extent over which neurons in macaque striate 800
cortex pool visual signals. Vis Neurosci 19: 439-452, 2002. 801
Li C-Y, and Li W. Extensive integration field beyond the classical receptive field of 802
cat's striate cortical neurons-classification and tuning properties. Vis Neurosci 34: 803
2337-2355, 1994. 804
Lyon DC, Nassi JJ, and Callaway EM. A disynaptic relay from superior colliculus to 805
dorsal stream visual cortex in macaque monkey. Neuron 65: 270-279, 2010. 806
Mazer JA, Vinje WE, McDermott J, Schiller PH, Gallant JL. Spatial frequency and 807
orientation tuning dynamics in area V1. Proc Natl Acad Sci USA 99: 1645-1650, 808
2002. 809
Mizobe K, Polat U, Pettet MW, and Kasamatsu T. Facilitation and suppression of 810
single striate-cell activity by spatially discrete pattern stimuli presented beyond the 811
receptive field. Vis Neurosci 18: 377-391, 2001. 812
Movshon JA, Thompson ID, and Tolhurst DJ. Spatial summation in the receptive 813
fields of simple cells in the cat's striate cortex. J Physiol 283: 53-77, 1978. 814
Nolt MJ, Kumbhani RD, and Palmer LA. Contrast-dependent spatial summation in 815
the lateral geniculate nucleus and retina of the cat. J Neurophysiol 92: 1708-1717, 816
2004. 817
Ozeki H, Sadakane O, Akasaki T, Naito T, Shimegi S, and Sato H. Relationship 818
between excitation and inhibition underlying size tuning and contextual response 819
modulation in the cat primary visual cortex. J Neurosci 24: 1428-1438, 2004. 820
Pettigrew J, Cooper M, and Blasdel G. Improved use of tapetal reflection for eye-821
position monitoring. Invest Ophthalmol Vis Sci 18: 490-495, 1979. 822
Polat U, Mizobe K, Pettet MW, Kasamatsu T, and Norcia AM. Collinear stimuli 823
regulate visual responses depending on cell's contrast threshold. Nature 391: 580-824
584, 1998. 825

27
Ringach DL, Shapley RM, and Hawken MJ.Orientation selectivity in macaque V1: 826
diversity and laminar dependence. J Neurosci 22: 5639-5651, 2002. 827
Rockland KS, and Knutson T. Axon collaterals of meynert cells diverge over large 828
portions of area V1 in the macaque monkey. J Comp Neurol 441: 134-147, 2001. 829
Roerig B, and Kao JPY. Organization of intracortical circuits in relation to direction 830
preference maps in ferret visual cortex. J Neurosci 19: 44RC-, 1999. 831
Salin PA, and Bullier J. Corticocortical connections in the visual system: structure 832
and function. Physiol Rev 75: 107-154, 1995. 833
Sceniak MP, Chatterjee S, and Callaway EM. Visual spatial summation in macaque 834
geniculocortical afferents. J Neurophysiol 96: 3474-3484, 2006. 835
Sceniak MP, Hawken MJ, and Shapley R. Visual spatial characterization of 836
macaque V1 neurons. J Neurophysiol 85: 1873-1887, 2001. 837
Sceniak MP, Ringach DL, Hawken MJ, and Shapley R. Contrast's effect on spatial 838
summation by macaque V1 neurons. Nat Neurosci 2: 733-739, 1999. 839
Schiller PH, and Malpeli JG. Functional specificity of lateral geniculate nucleus 840
laminae of the rhesus monkey. J Neurophysiol 41: 788-797, 1978. 841
Schwabe L, Obermayer K, Angelucci A, and Bressloff PC. The role of feedback in 842
shaping the extra-classical receptive field of cortical neurons: A recurrent network 843
model. J Neurosci 26: 9117-9129, 2006. 844
Schummers J, Cronin B, Wimmer K, Stimberg M, Martin R, Obermayer KH, 845
Koerding K, and Sur M. Dynamics of orientation tuning in cat V1 neurons 846
depend on location within layers and orientation maps. Front Neurosci 1: 14, 2007. 847
Sengpiel F, Sen A, and Blakemore C. Characteristics of surround inhibition in cat 848
area 17. Exp Brain Res 116: 216-228, 1997. 849
Seriès P, Lorenceau J, and Frégnac Y. The "silent" surround of V1 receptive fields: 850
theory and experiments. J Physiol (Paris) 97: 453-474, 2003. 851
Shao Z, and Burkhalter A. Different balance of excitation and inhibition in forward 852
and feedback circuits of rat visual cortex. J Neurosci 16: 7353-7365, 1996. 853
Skottun BC, De Valois RL, Grosof DH, Movshon JA, Albrecht DG, and Bonds 854
AB. Classifying simple and complex cells on the basis of response modulation. 855
Vis Res 31: 1078-1086, 1991. 856
Slllito AM, Grieve KL, Jones HE, Cudeiro J, and Davls J. Visual cortical 857
mechanisms detecting focal orientation discontinuities. Nature 378: 492-496, 1995. 858
Solomon SG, White AJR, and Martin PR. Extraclassical receptive field properties of 859
parvocellular, magnocellular, and koniocellular cells in the primate lateral 860
geniculate nucleus. J Neurosci 22: 338-349, 2002. 861
Spitzer H, and Hochstein S. Simple- and complex-cell response dependences on 862
stimulation parameters. J Neurophysiol 53: 1244-1265, 1985. 863
Sur M, Esguerra M, Garraghty PE, Kritzer MF, and Sherman SM. Morphology of 864
physiologically identified retinogeniculate X- and Y-axons in the cat. J 865
Neurophysiol 58: 1-32, 1987. 866
Vidyasagar TR, Kulikowski JJ, Lipnicki DM, and Dreher B. Convergence of 867
parvocellular and magnocellular information channels in the primary visual cortex 868
of the macaque. Eur J Neurosci 16: 945-956, 2002. 869
28
Walker GA, Ohzawa I, and Freeman RD. Asymmetric suppression outside the 870
classical receptive field of the visual cortex. J Neurosci 19: 10536-10553, 1999. 871
Walker GA, Ohzawa I, and Freeman RD. Suppression outside the classical cortical 872
receptive field. Vis Neurosci 17: 369-379, 2000. 873
Webb BS, Dhruv NT, Solomon SG, Tailby C, and Lennie P. Early and late 874
mechanisms of surround suppression in striate cortex of macaque. J Neurosci 25: 875
11666-11675, 2005a. 876
Webb BS, Tinsley CJ, Vincent CJ, and Derrington AM. Spatial distribution of 877
suppressive signals outside the classical receptive field in lateral geniculate 878
nucleus. J Neurophysiol 94: 1789-1797, 2005b. 879
Xing D, Shapley RM, Hawken MJ, and Ringach DL. Effect of stimulus size on the 880
dynamics of orientation selectivity in macaque V1. J Neurophysiol 94: 799-812, 881
2005. 882
Yoshioka T, Blasdel GG, Levitt JB, and Lund JS. Relation between patterns of 883
intrinsic lateral connectivity, ocular dominance, and cytochrome oxidase-reactive 884
regions in macaque monkey striate cortex. Cereb Cortex 6: 297-310, 1996. 885
Zipser K, Lamme VAF, and Schiller PH. Contextual modulation in primary visual 886
cortex. J Neurosci 16: 7376-7389, 1996. 887
888
889
FIGURE LEGENDS 890
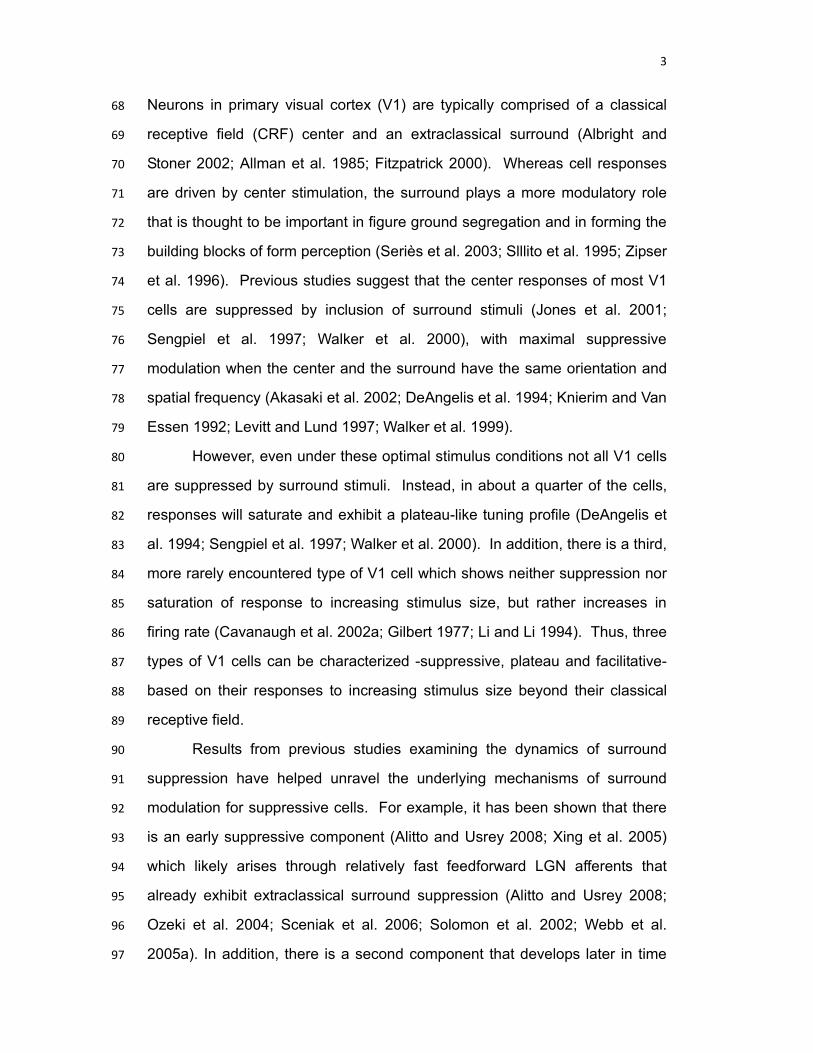
FIG. 1. Response time course of V1 cells to variations in stimulus diameter. A: 891
Suppressive simple cell; B: Suppressive complex cell; C: Plateau complex cell; 892
and D: Facilitative simple cell. Left panels show the fitted aperture tuning 893
curve for each cell. Histograms of the cell’s response time to apertures 894
corresponding to the black points in the left panels are plotted at the right. To 895
explore the time course of response, firing rates were calculated in cumulative 896
windows schematically illustrated by t1, t2 to tn with steps of 10 ms or 50 ms 897
from stimulus onset (see Methods for details). For some simple cells, such as 898
the one shown in D, response onset was delayed because stimulus phase 899
was non-optimal (phase was set to 0° for all cells). For these cells, response 900
onset was shifted to be aligned with complex cells (see Methods for details). 901
Error bars are SEM. 902
903
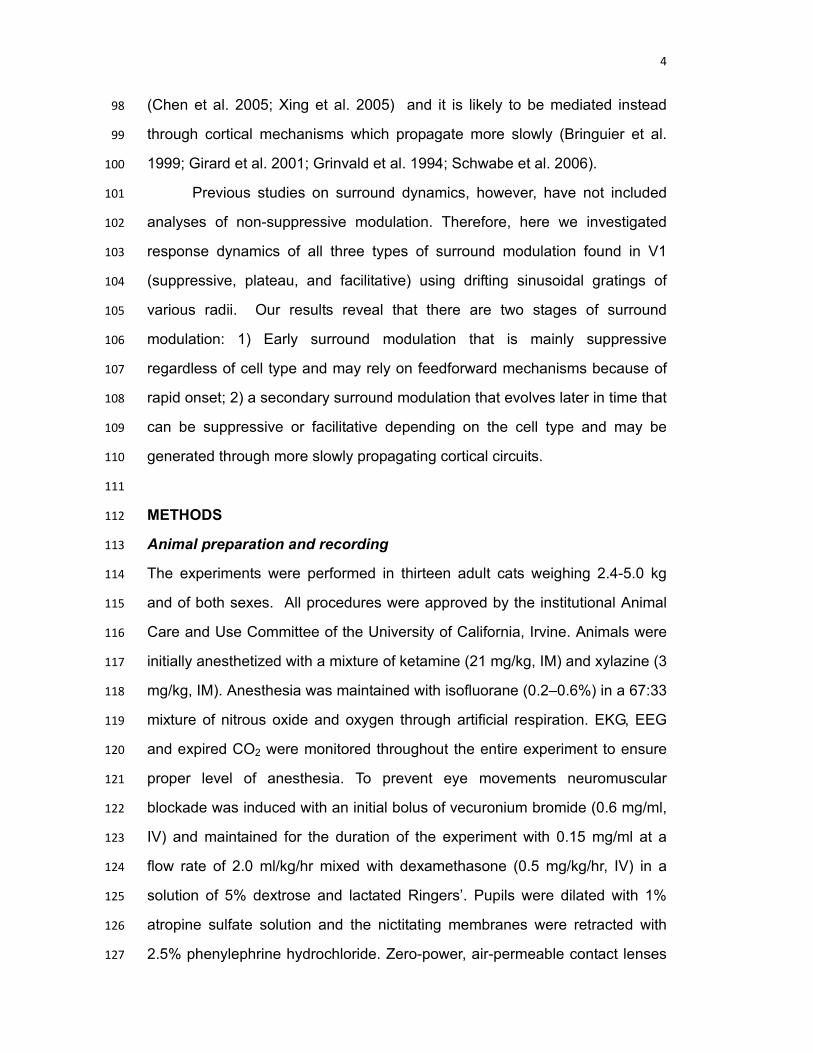
FIG. 2. Three types of extraclassical surround modulation exemplified by 904
different V1 cells. Responses for each cell are plotted against the diameter of 905

29
stimulus aperture. A: A suppressive cell shows peak response at 10°, which is 906
close to the cell’s classical receptive field (re=9°, indicated by arrow), and then 907
rapidly suppresses in response to further increases in aperture size. B: An 908
example plateau cell shows maximum response to apertures of 10° and larger. 909
Thus, the response saturates but is not suppressed by stimuli larger than 10°. 910
The CRF (10°; indicated by arrow) for plateau cells is represented by 911
parameter re extracted from Eq.1. C: For the example facilitative cell the 912
response increases with increase in aperture size and does not suppress or 913
saturate (black trace). To identify the CRF the annular minimum response field 914
was determined through a series of annuli of varying inner diameters (gray 915
trace). Here the cell has a CRF of 10° (indicated by arrow). The modulation 916
index (MI) is also plotted for each type of cell, and equals -0.34 for the 917
suppressive cell in A, +0.07 for the plateau cell in B, and +0.62 for the 918
facilitative cell in C. Error bars are SEM. 919
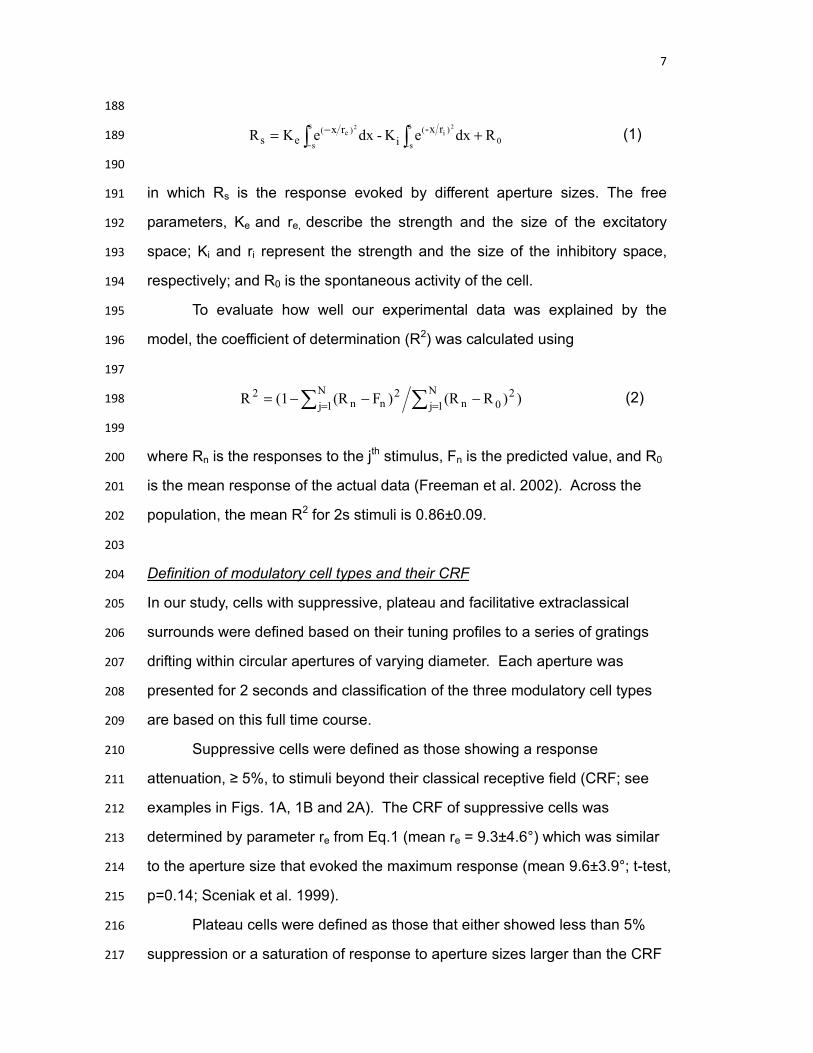
FIG. 3. Simple/complex classification of the three modulatory cell types. Mean 920
response (F0) to drifting gratings was plotted as a function of the first 921
harmonic response (F1) for each cell. The majority of our neurons (118/158, 922
75%) fall above the diagonal (F1/F0 < 1) and are considered complex cells 923
based on the criteria of Skottun et al. (1991). Conversely, the remaining 40 924
neurons fall below the diagonal (F1/F0 >1) and are regarded as simple cells. 925
The majority of suppressive (83/108; gray circles) and plateau (33/40; light-926
gray filled circles) cells are complex cells; whereas, 8 out of 10 facilitative cells 927
(black circles) are simple cells. 928
929
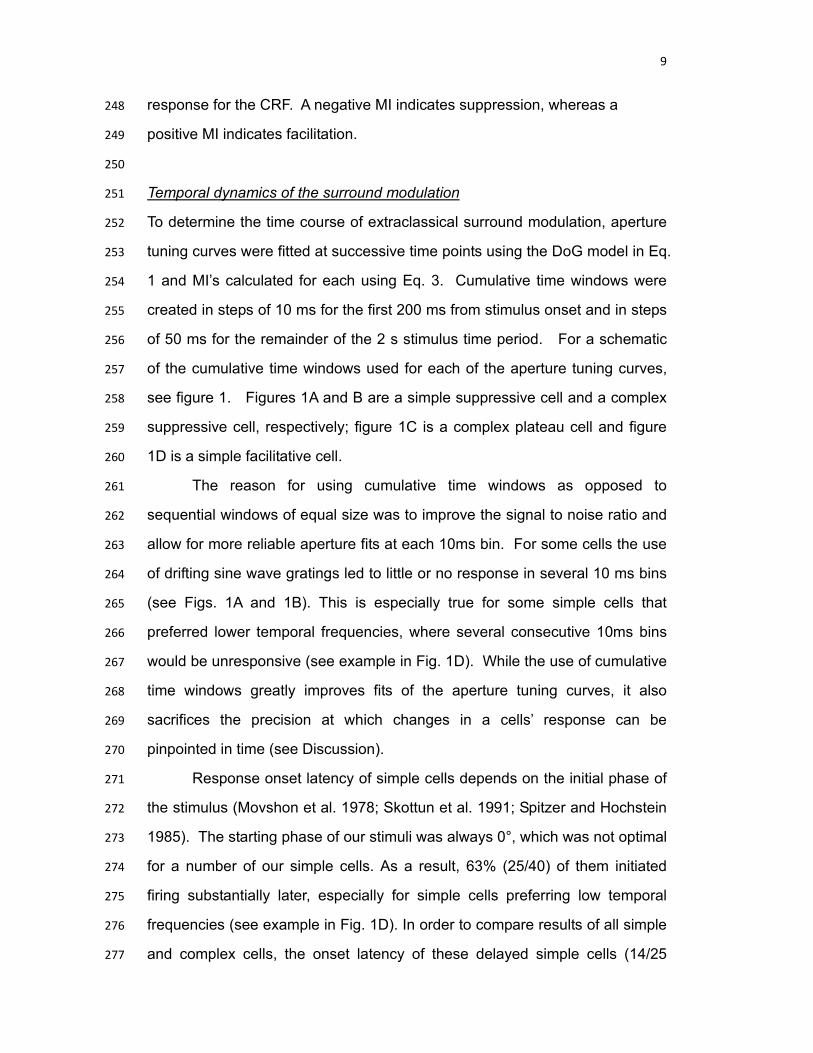
FIG. 4. Temporal dynamics of size tuning curves for the three modulatory cell 930
types. A-C: Three suppressive cell examples. D-F: Three plateau cell 931
examples. G and H: Two facilitative cells. Aperture tuning curves in each 932
cumulative time window are represented as a collection of colored curves for 933
each cell. Blue curves represent responses at earlier time points relative to 934
stimulus onset. Warmer colored curves represent the cumulative responses at 935

30
later time windows up to the full 2 s stimulus presentation colored red. Time 936
window (ms) and R2 of the fits for each tuning curve are shown in the legends 937
to the right of each panel. Arrows in A-H indicate aperture tuning curves 938
described in the Results. I: Annulus response of a facilitative cell at different 939
time windows. As indicated by the arrow, the annular minimum response field 940
is consistent across time (8°). Panels A, B, D, E and G are complex cell 941
examples. The remaining panels are simple cells. 942
943
FIG. 5. The mean temporal evolution of the extraclassical surround 944
modulation for the three modulatory cell types. A: The modulation index (MI) 945
for suppressive (light-gray trace), plateau (gray trace), and facilitative (black 946
trace) cells are plotted against time. Each time point is cumulative. A negative 947
MI represents suppressive modulation and a positive MI facilitation. The value 948
0 on the x-axis represents stimulus onset time. B: Average R2 of the fitted 949
curves are plotted as a function of each cumulative time window. Error bars 950
are SEM. 951
952
FIG. 6. Receptive field size of maximum response of different modulatory cell 953
types as a function of cortical depth. A: Receptive fields of maximum 954
response (illustrated by circle size) within each of 27 electrode penetrations 955
relative to cortical depth (µm). Circle sizes range from 2-30° and are shown to 956
scale (see right). Cells located in the same penetration are plotted along the 957
same dashed vertical line. Light-gray filled circles are suppressive cells, gray 958
open circles are plateau cells, and facilitative cells are represented by black 959
open circles. All but one of the facilitative cells is located >1200 µm below the 960
cortical surface in what is considered the infragranular layer; whereas 961
suppressive and plateau cells are distributed broadly across all layers. 962
<600µm approximates the location of superficial layers; 600-1200µm 963
approximates the position of the granular layer; >1200µm approximates the 964
position of infragranular layers. B: Distributions of receptive fields of 965

31
maximum response for the three cell types. 966
967
FIG. 7. Spatial frequency and orientation tuning curve examples for cells 968
within the same penetration. Cells from this single penetration (track 3 in 969
figure 6) include 4 suppressive, 2 plateau and 2 facilitative cells. A: the 970
preferred spatial frequencies are similar for each cell. B: Orientation tuning 971
curves vary, but are comparable across the three modulatory cell types. In 972
addition, preferred orientations are similar for all the cells. 973
974
FIG. 8. Spatial frequency preference and orientation selectivity distributions 975
for the three modulatory cell types. A: The distributions of spatial frequency 976
preference for suppressive, plateau and facilitative cells are similar (ANOVA, 977
p=0.28). B: The orientation selectivity index (OSI) for all cells is plotted 978
against the orientation tuning width (HWHH, shown in radians) and they are 979
linearly related (R=0.54, p<0.001). In addition, the OSI of facilitative cells 980
(which are predominantly simple cells) is significantly larger than suppressive 981
and plateau cells (ANOVA, p=0.02). HWHH is similar for the three types of 982
cells (ANOVA, p=0.14). C and D: Mean HWHH and OSI for the three 983
modulatory cell types. Across the population, orientation selectivity and tuning 984
of simple cells (solid bars) is better than complex cells (hatched bars). For 985
suppressive cells these simple/complex differences are significant for both 986
HWHH and OSI, whereas for plateau cells this difference is significant for only 987
the HWHH. For facilitative cells, simple/complex cell differences in HWHH and 988
OSI are not significant, probably due to only having two complex cells in the 989
sample. 990

A
B
C
D
400
0200
020
40
60
80
Res
pons
e
SF:0.1 TF:5
020
40
60
80SF:0.2 TF:5
020406080
100
SF:0.1 TF:5
0
20
40
60SF:0.1 TF:2
Res
pons
eR
espo
nse
Res
pons
e
0
4000
3000
0.8 1.2 1.6 2
0 0.4 0.8 1.2 1.6 2
0.40t1
t2tn
t1t2
tn
0 10 20 30
0 10 20 30
0 10 20 30
0 10 20 30
Time (s)
Aperture
Res
pons
e (s
p/s)
Fig. 1

plateau
0 5 10 15 20 25 300
20
40
60
80
100
120suppressive
MI
Res
pons
e (s
pike
s/s)
Res
pons
e (s
pike
s/s)
A
B
0
5
10
15
20
25
30
MI
0 5 10 15 20 25 30
0 5 10 15 20 25 30
Aperture Size (degree)
0
10
20
30
40
50
Res
pons
e (s
pike
s/s)
C
MI
facilitative
Fig. 2

0
50
100
150
200
F1 (max)
F0 (m
ax)
0 50 100 150 200
suppressive (n=108)plateau (n=40)facilitative (n=10)
Fig. 3

0 5 10 15 20 25 300
4
8
12
16
2020
0
20
40
60
80
100
0
20
40
60
0 2 4 6 8 10 12 14
10
20
30
40
0
10
20
30
40
0
20
40
60
80
100
120
0
20
40
60
80
0
10
20
30
40
0 5 10 15 20 25 30
0 5 10 15 20 25 30
0 5 10 15 20 25 30
0 5 10 15 20 25 30
0 5 10 15 20 25 30
0 5 10 15 20 25 30
0 5 10 15 200
40
80
120
0
120ms
50ms
40ms
120ms
40ms
90ms
50ms
120ms
50ms
90ms
150ms40ms
70ms
120ms
50ms
120ms
Facilitative PlateauSuppressive
C F
G
B
D
H
A
E
I50/ 0.6760/ 0.7270/ 0.7690/ 0.77
120/ 0.73150/ 0.79200/ 0.80500/ 0.85
1000/ 0.802000/ 0.83
50/ 0.7960/ 0.8770/ 0.8890/ 0.93
120/ 0.99150/ 0.98200/ 0.99500/ 0.93
1000/ 0.982000/ 0.94
30/ 0.8240/ 0.7650/ 0.8670/ 0.8190/ 0.85120/ 0.81150/ 0.84200/ 0.89500/ 0.961000/ 0.97
50/ 0.9360/ 0.9070/ 0.9290/ 0.96120/ 0.96150/ 0.95200/ 0.92500/ 0.981000/ 0.982000/ 0.99
40/ 0.6950/ 0.7070/ 0.7490/ 0.80
120/ 0.77150/ 0.80200/ 0.88500/ 0.92
1000/ 0.902000/ 0.98
40/ 0.6850/ 0.7170/ 0.7690/ 0.85
120/ 0.89150/ 0.92200/ 0.86500/ 0.85
1000/ 0.812000/ 0.86
40/ 0.7450/ 0.8070/ 0.8490/ 0.83
120/ 0.83150/ 0.83200/ 0.80500/ 0.83
1000/ 0.812000/ 0.82
30/ 0.8450/ 0.9270/ 0.9190/ 0.91
120/ 0.97150/ 0.97200/ 0.97500/ 0.99
1000/ 0.992000/ 0.99
30507090
110130150500
10002000
Res
pons
e (s
pike
s/s)
Aperture Size (degree)
366 μm
143 μm
1667 μm
1902 μm
1206 μm
610 μm
1624 μm
1996 μm
Fig. 4


suppressive (n=108)plateau (n=40)facilitative (n=10)
Receptive Field of Maximum Response
0 4 8 12 16 20 24 28 320
4
8
12
16
Num
ber
B
0 4 8 12 16 20 24 28
Electrode Tracks
Cor
tical
Dep
th (u
m)
0
500
1000
1500
2000
2500
246
810121416
18
25
30
A
Fig. 6

10
20
0
10
20
0
5
10
15
0
5
10
0
20
40
0
40
80
05
10
15
0 0.5 10
10
20
30
0
10
20
0
10
20
05
10
15
010
20
30
0
20
40
0
20
40
60
0
5
10
15
0 50 100 1500
20
40
0
Spatial frequency Orientation
Res
pons
e (s
pike
s/s)
suppressive
plateau
facilitative
plateau
facilitative
suppressive
suppressive
suppressive
BA
Fig. 7

0 0.5 1 1.5 2 2.50
0.2
0.4
0.6
0.8
1
HWHH
OSI
suppressive simple (n=22) plateau simple (n=7)facilitative simple (n=8) suppressive complex (n=81)plateau complex (n=33) facilitative complex (n=2)
B
0.1 0.2 0.3 0.4 0.5 0.6 0.70
10
20
30
40
50
60
Num
ber o
f cel
ls
Spatial frequency
suppressive (n=99)plateau (n=35)facilitative (n=10)
A
*0.02
Plateau Facilitative0
0.4
0.8 OS
I
1.2
0
0.4
0.8
1.2
HW
HH
SuppressiveSuppressive
Plateau Facilitative
C D simplecomplex
**
0.0020.003
1.61.6
Fig. 8